
RESEARCH ARTICLE
Sustainable Harvest of Large Pelagic Fish in the Western Sumatra Sea
Aquatic Life Sciences|Vol. 2, Issue 1, pp. 1-11 (2025)
CC BY 4.0-2025 Authors
Views
Downloads
Shares
Received
May 19, 2025Revised
Jun 13, 2025Accepted
Jun 24, 2025Published
Jun 30, 2025
Abstract
Large pelagic fish such as tuna, skipjack, and mackerel are key export commodities for fishers at Bungus Oceanic Fishing Port due to high demand and their importance in processed fish products. This study analyzed trends, sustainable potential, and utilization levels of these resources in the western Sumatra Sea. Research conducted from March 17 to April 1, 2023, used a descriptive quantitative survey and literature review, with catch and effort data from 2015 to 2022 processed using Microsoft Excel. Results showed increasing catch trends, with tuna, skipjack, and mackerel projected to reach 723,417 kg, 462,205 kg, and 706,592 kg by 2025, respectively. The Maximum Sustainable Yield (MSY) estimates were 532,728 kg/year for tuna, 1,047,319 kg/year for skipjack, and 10,445,616 kg/year for mackerel. On average, the utilization rate was 37%, with a fishing effort rate of 24%, both categorized as moderate. Although tuna catches exceeded the MSY in 2021 (109.55% utilization), average exploitation across species remained sustainable. These findings suggest current fishing practices have not yet surpassed ecological limits, providing room for controlled increases in fishing efforts to maximize yields while maintaining ecological balance.
Introduction
As a maritime nation, Indonesia is rich in marine fishery resources distributed across eleven Fisheries Management Areas (WPP) (1-3). One of the key areas is the Western Sumatra Sea, part of WPP-572, which includes significant fish resources, both pelagic and demersal (4). Pelagic fish, particularly large species such as tuna (Thunnus sp.), skipjack (Katsuwonus pelamis), and mackerel tuna (Euthynnus affinis), are crucial for the economy, serving as major export commodities and raw materials for processing industries (5). These species are characterized by their schooling behavior and migratory patterns, making them a primary target for fishermen, especially those operating at Bungus Oceanic Fishing Port, a prominent hub for large pelagic fisheries in West Sumatra.
Bungus Oceanic Fishing Port, located on the western coast of Sumatra, is a significant center for the tuna, skipjack, and mackerel tuna fisheries (6). The high commercial value of these fish makes them a key export product, necessitating effective management to ensure their sustainability (7). Proper management of pelagic fish resources is essential to control fishing efforts and maintain the long-term viability of these species (8, 9). Sustainable fisheries management is characterized by reduced catch efforts, lower exploitation rates, and enhanced fish stocks, focusing on eliminating destructive fishing practices (10, 11).
Accurately estimating the Maximum Sustainable Yield (MSY) of pelagic fish in the Western Sumatra Sea is crucial for successful resource management (12). Misestimating the sustainable potential could lead to ineffective policies, overfishing, and depletion of fish stocks (13). Overexploitation can result in diminished resources, eventually leading to the fishery's collapse. This study aims to assess the sustainable potential of large pelagic fish in WPP-572, using a case study from Bungus Port, to provide insights for policy development that will support the long-term sustainability of these fish stocks.
Methodology
Time and Location of the Study
The study was conducted from March to April 2023 at Samudera Bungus Fishing Port, located in the West Bungus Village, Bungus Teluk Kabung Subdistrict, West Sumatra Province.
Fishing equipment
The fishing equipment used in the Samudera Bungus Fisheries Harbor plays an essential role in fishing activities, particularly in the efficient capture of large pelagic fish. The performance of fishing gear greatly influences the success of fishing operations and significantly impacts the sustainability of fish stocks. Below are the types of fishing equipment commonly employed at the harbor.
Purse Seine
The purse seine is a highly effective fishing gear used to capture pelagic fish that tend to school together in large groups. It consists of a long rectangular net deployed around the target fish school. The net is pulled together at the bottom, trapping the fish inside (bodynote). This method is suitable for both nearshore and offshore fishing. The process includes finding fish schools, deploying the net, and hauling it back to the boat.
Tuna Longline
The tuna longline consists of a mainline with multiple branch lines, each equipped with a hook and bait. It is operated in open ocean waters, primarily targeting large pelagic fish such as tuna. The gear is set by deploying the line into the water, and after a while, the catch is hauled back. This method allows for targeting specific fish species while reducing bycatch. The operation phases include setting, immersing, and hauling the lines (14).
Pole and Line Line
The Pole and Line line is a fishing line system commonly used at Samudera Bungus for catching large pelagic fish like tuna, skipjack, and other schooling fish. It is operated by a boat pulling the line horizontally through the water. The process involves three key stages: searching for fish, setting the line, and hauling it back with the catch. The Pole and Line line is efficient and ensures that fish are captured selectively (14).
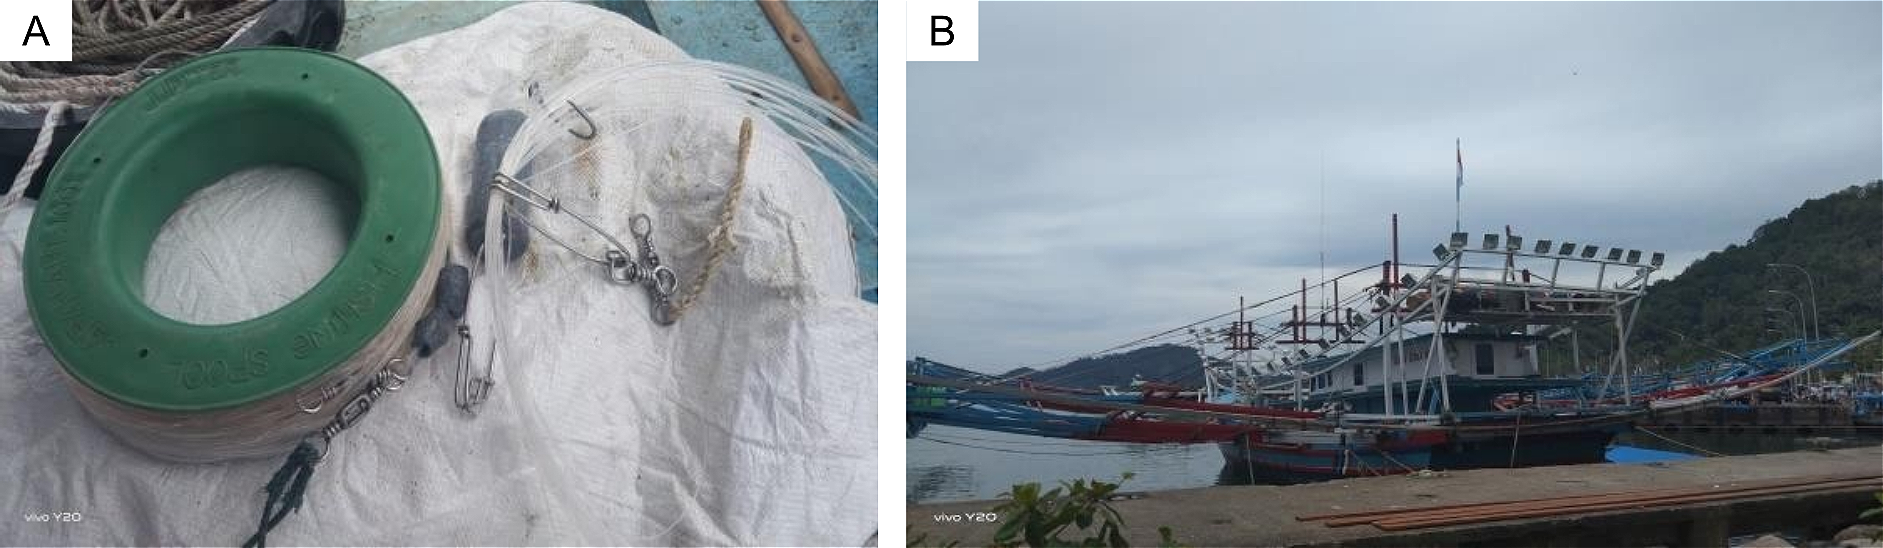
Handline
Handlines are a traditional and environmentally friendly fishing method often used by small-scale fishermen. This fishing gear comprises a fishing line attached to a hook and bait (see Figure 1). It is used in waters ranging from 18 to 75 meters deep and is typically deployed from boats. Handlines are low-impact tools that precisely target fish while minimizing bycatch. It is commonly operated both during the day and night (15).
Lamp Boat Nets
Lamp boat nets, also known as Lift Net, are a passive fishing gear method that uses light to attract pelagic fish exhibiting positive phototaxis. The light draws the fish toward the boat, gathering around the light source. The fish are then captured using nets. This method is predominantly used at night and effectively catches fish that swim near the water's surface. The gear includes nets, bamboo frames, metal pipes, and lighting equipment to attract the fish (13).
Research Method
This research employed a survey method using a quantitative descriptive approach and case study. Collected data were analyzed to describe the condition of fishing activities at the study site, supported by relevant literature. The case study approach was applied to highlight specific aspects of the observed fishing units or fleets in the context of operational and technical performance.
Data Collection
This study utilized secondary data obtained from the logbook of Bungus Oceanic Fishing Port, consisting of time series data on large pelagic fish production from 2015 to 2022. The data analyzed were classified into two main categories: fishing effort and catch yield. Effort variables included the type and number of fishing gears, namely purse seine, handline, tuna longline, trolling line, and boat lift net, as well as the number of fishers as supporting data. Yield data covered catch volumes by gear type and the total production of large pelagic species.
Research Procedure
The research procedure began with obtaining formal permission from the relevant authorities at Bungus Oceanic Fishing Port. The researcher then visited the local Department of Marine Affairs and Fisheries to collect general port information and relevant secondary data. All collected data were subsequently processed using Microsoft Excel.
Data analysis
Trend of Large Pelagic Fish Production
Trend analysis is a prediction technique used to estimate future conditions based on past data observed over a considerable period. This method allows for identifying fluctuations and contributing factors influencing data variations. As defined by several scholars, forecasting is the process of estimating future values based on historical data through specific analytical techniques (16). One commonly used prediction approach is the Least Square Method, which utilizes time series data to predict future trends. This method requires past data to develop a prediction model and applies to even and odd datasets. A key characteristic of this method is parameter X, which must have a total sum of zero regardless of the number of data points. The method is considered effective in generating predictive equations for estimating future values. The linear regression model is expressed by the Eq. 1 (17).
In trend analysis, the value of x or t is often determined using an alternative scoring or coding method. The data are typically grouped into two categories:
Even-numbered data, where the zero point on the x-axis is placed between the two middle years, resulting in a two-year interval. The corresponding t values are:..., -5, -3, -1, 1, 3, 5,...
Odd-numbered data, where the zero point is placed in the middle year, produces a one-year interval on the x scale. The corresponding t values are:..., -3, -2, -1, 0, 1, 2, 3,...
The growth rate of production was then calculated using the Eq. 2.
Standardization of Fishing Gear
In this study, gear standardization is essential due to the use of multiple fishing gear types targeting large pelagic species in the waters of the Bungus Oceanic Fishing Port. Since each gear type has different levels of efficiency and selectivity, standardizing fishing effort is necessary before calculating Catch Per Unit Effort (CPUE). This process aims to convert all fishing efforts into a standard gear unit, ensuring that catches from different gears can be quantitatively compared on an equal basis. The procedure for standardizing fishing gear into a standardized gear unit can be carried out as follows:
The fishing gear with the highest CPUE is designated as the standard gear and is assigned a fishing power index (FPI) value of 1. The FPI for other gear types can be calculated using the formula described in (18, 19).
Catch Unit Per Effort (CPUE)
The value of Catch Per Unit Effort (CPUE) is obtained by dividing the total catch of large pelagic species such as tuna, skipjack, and mackerel by the corresponding fishing effort. Fishing effort is quantified through operational metrics, including the number of hauls conducted, the count of active fishing vessels, or the number of deployed fishing gears.
Maximum Sustainable Yield (MSY)
The concept of total sustainable potential in fisheries resources is referred to as Maximum Sustainable Yield (MSY). According to Maunder (2008), MSY is defined as the maximum quantity of fish biomass that can be harvested from a fish stock within a specified period while allowing the population to maintain its capacity for regeneration (20). The estimation of MSY in fisheries science is commonly conducted using the Schaefer surplus production model, which analyzes the relationship between catch per unit effort (CPUE) and total fishing effort.
The value of MSY is influenced by the magnitude of fishing effort applied under each capture method. MSY is called sustainable catch production and is typically calculated per fish species or fishery resource group. Required statistical data for MSY estimation include species-specific catch volumes, catch per fishing gear type, and the number and type of fishing gear units utilized. Venema and Sparre (1999) stated that the value of Maximum Sustainable Yield (MSY) could be estimated using a regression equation (Eq. 1) based on the Schaefer model, which Schaefer developed (21).
Utilization and Effort Levels
According to Sibagariang et al. (2014), the level of fish resource utilization can be calculated based on the amount of utilization (22). The percentage value of fish resources that have been utilized can be determined using Eq. 3.
Effort level is conducted to determine the fishing effort exerted on large pelagic fish resources, namely tuna, skipjack, and mackerel tuna, in the waters of the Western Sumatra Sea, with a case study at the Bungus Oceanic Fishing Port. Effort level can be calculated using Eq. 4.
Result and Discussion
Description of the Study Area
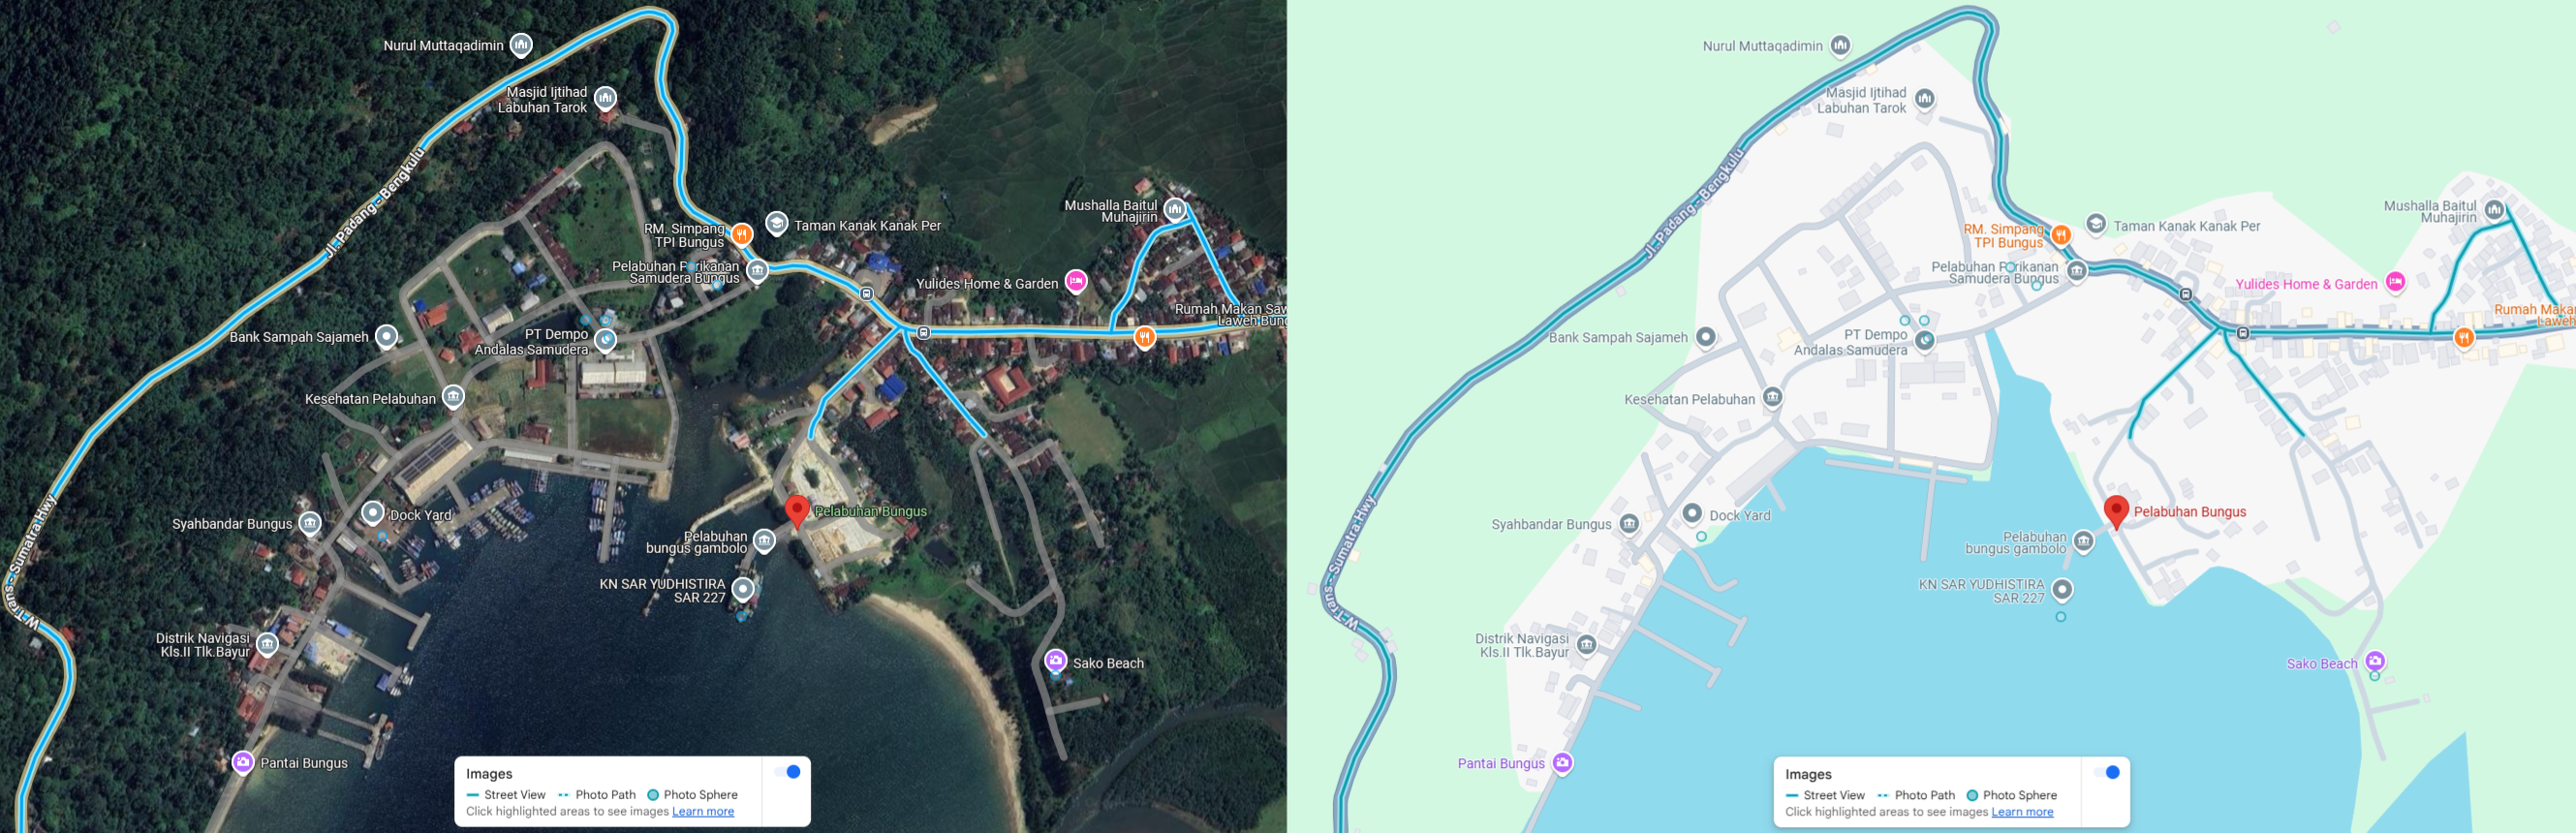
The coastal area of Teluk Bungus, located in the southern part of Padang City (see Figure 2), plays a crucial role not only for West Sumatra Province but also for western Indonesia. The Samudera Bungus Fishing Port (PPS Bungus) is a key fishing industry hub, primarily handling large pelagic fish species such as Tuna (Thunnus sp), Skipjack (K. pelamis), and Bonito (E. affinis), with a smaller proportion of other fish species. As a Type A port, PPS Bungus serves vessels ranging from 51-100 GT and acts as a focal point for fishing activities, offering essential facilities for fishermen. It also functions as a center for developing fishing communities, marketing, fish quality control, data collection, and resource monitoring. With direct access to the Indian Ocean, PPS Bungus holds significant potential for supporting large-scale fisheries in the West Sumatra region.
Production Trends of Large Pelagic Fish
According to statistical data from the Samudera Bungus Fishing Port, the three primary fish commodities landed are tuna, skipjack, and bonito. Tuna has been captured using four main types of fishing gear during the 2015–2022 period: trolling lines (Pole and Line), handlines, tuna longlines, and purse seines. Skipjack and bonito are primarily caught using trolling lines, lift nets (Lift Net), and purse seines. The annual catch volumes of these species have shown notable fluctuations over the years. Multiple factors, including fish availability, fishing effort, and operation effectiveness, influence these variations. A trend analysis using the least square method was employed to forecast future catch trends. This time series-based approach allows the identification of either positive or negative trends by evaluating long-term historical data (see Figure 3).
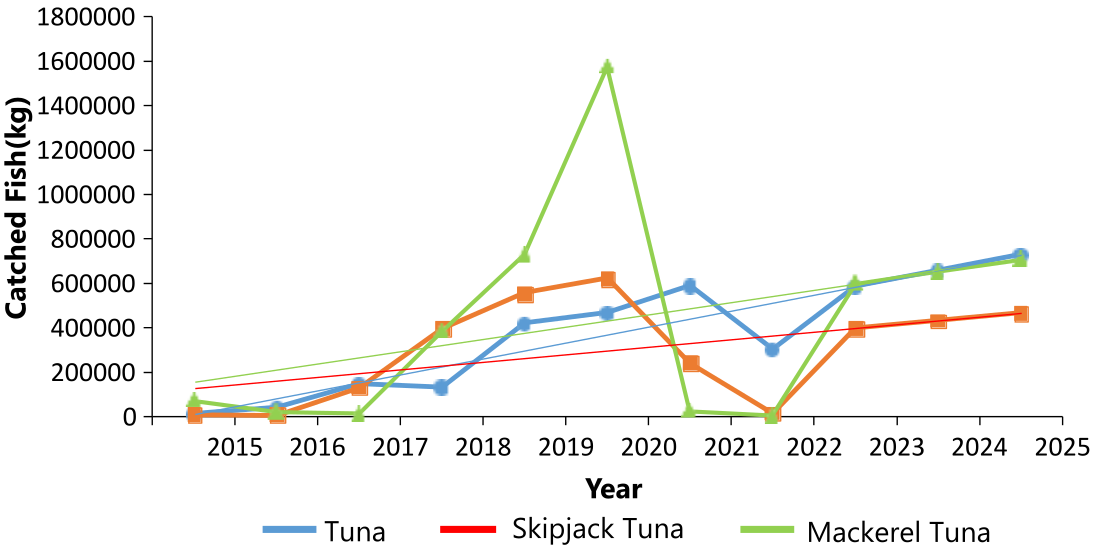
The data analysis in this study, conducted using the least square method, yielded linear equations for each major pelagic species. The linear equation for tuna is Y = 258.940,75 + 35.728,95X, Y = 242.252,75 + 16.919,48X for skipjack tuna, and Y = 351.367,38 + 27.324,98X for mackerel tuna.
The analysis of catch trends for tuna, skipjack, and mackerel landed at Bungus Oceanic Fishing Port from 2015 to 2022 indicates a positive growth trajectory. Based on least square forecasting, the catch is projected to continue increasing through 2025, with predicted tuna landings reaching approximately 580,501.32 kg in 2023, 651,959.23 kg in 2024, and 723,417.13 kg in 2025. For skipjack, the estimated catches are 394,528.04 kg, 428,366.99 kg, and 462,205.94 kg, respectively, while mackerel landings are forecasted at 597,292.21 kg, 651,942.18 kg, and 706,592.14 kg. These projections suggest that the supply of raw materials for processing and domestic consumption can be sustained in the near future. Trend analysis serves as an essential tool to assess the risk of overfishing. A downward trend typically reflects overexploitation, which may hinder the sustainability of fish stocks and reduce economic returns due to premature harvesting. Conversely, an upward trend indicates adequate resource availability. Additionally, integrating external factors such as climatic events (e.g., El Niño, Indian Ocean Dipole) and fisheries management policies (e.g., the 2014 moratorium and vessel re-verification in 2022) would help explain variations in catch volume and fishing effort, offering a more nuanced understanding of sustainability risks (23-26).
Challenges such as undersized catches, declining fish quality, and distant fishing grounds must be addressed through sustainable fisheries management (27, 28). Ensuring selective fishing practices and controlling fishing efforts are vital to maintaining long-term resource viability. This case study highlights the importance of trend forecasting for strategic decision-making among stakeholders to preserve tuna, skipjack, and mackerel resources for export and local demand.
Maximum Sustainable Yield (MSY) and Optimum Effort
The Maximum Sustainable Yield (MSY) represents the highest catch level that can be sustainably harvested from a fishery resource without compromising its long-term viability. As a fundamental reference in fisheries management, MSY allows for exploitation while maintaining fish stocks at a biologically safe level. According to Telussa (2016), MSY refers to the quantity of fish that can be consistently harvested without depleting the resource, while the optimum fishing effort (Fopt) is the level of fishing activity that maximizes yield without harming sustainability (29). In Bungus, tuna fishing primarily occurs in the Mentawai waters. Skipjack and mackerel are caught within a 12-nautical-mile radius off the western coast of Sumatra. This limited fishing area leads to high exploitation intensity, particularly for tuna, increasing the risk of overfishing. Therefore, accurate estimation of sustainable potential is crucial to inform effective management and utilization policies. The graphs illustrating the Maximum Sustainable Yield and optimum fishing effort for Tuna, Skipjack, and Mackerel can be seen in Figure 4.
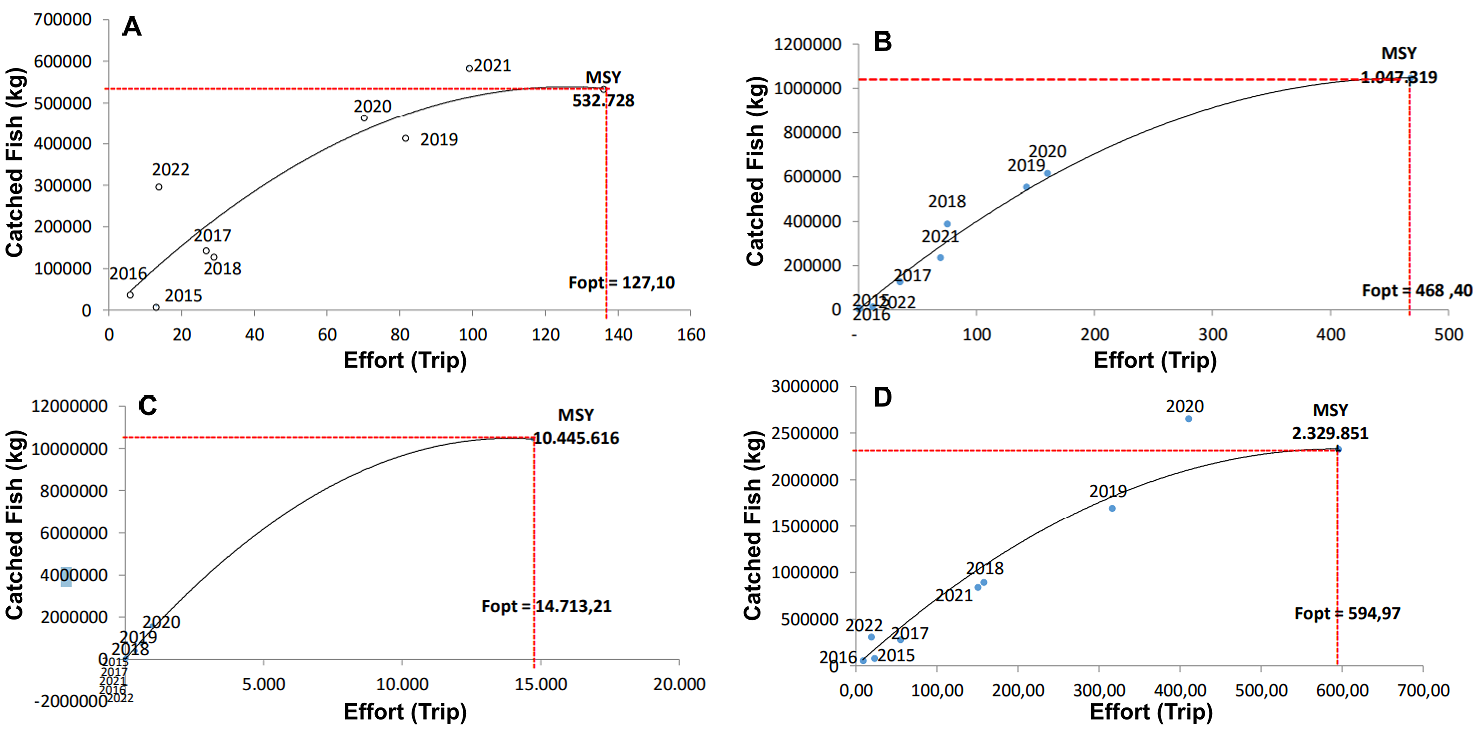
The estimated Maximum Sustainable Yield (MSY) for tuna in the Bungus region is 532,728 kg/year, with an optimum fishing effort of 127.10 trips/year. Analysis of catch data from 2015 to 2022 indicates that tuna catches in all years, except for 2021, remained below the MSY threshold. In 2021, tuna catch exceeded the Maximum Sustainable Yield (MSY), indicating a state of overfishing resulting from fishing efforts that surpassed sustainable limits. For skipjack, the MSY is 1,047,319 kg/year with an optimum effort of 468.40 trips/year, while mackerel scad (Mackerel Tuna) has an MSY of 10, 445, 616 kg/year and an optimum effort of 14,713.21 trips/year. Based on the catch trends, skipjack and mackerel scad catches from 2015 to 2022 have not exceeded MSY, suggesting potential for increased effort within sustainable limits. However, in 2020, the combined catch of all large pelagic species (tuna, skipjack, and mackerel) exceeded their aggregated MSY, coinciding with the highest recorded fishing effort of 410.65 trips. The calculated optimum effort for large pelagic fisheries is 594.97 trips/year.
Based on Figures 4C and D above, from 2015 to 2022, the catch of skipjack tuna (cakalang) and frigate tuna (tongkol) has not yet exceeded the Maximum Sustainable Yield (MSY). Therefore, the catch data indicate no sign of overfishing for skipjack and frigate tuna, meaning that fishing efforts can still be increased to achieve optimal catch results but must not exceed the MSY value. Meanwhile, the catch of large pelagic fish (tuna, skipjack, and frigate tuna) in 2020 exceeded the Maximum Sustainable Yield (MSY), indicating an overfishing condition in that year. This was caused by relatively high fishing efforts, as shown in Table 1, where the fishing effort in 2020 was the highest during the 2015–2022 period, amounting to 410.65 trips. The optimal fishing effort that can be carried out to catch large pelagic fish resources is 594.97 trips. According to Desiani et al. (2019), an optimal effort is the fishing effort to obtain an optimal catch performed by a fishing unit without damaging the sustainability of the fishery resource (16).
| Year | Fishing Gear Productivity (Kg/Trip) | ||||||||||||||
|---|---|---|---|---|---|---|---|---|---|---|---|---|---|---|---|
| Tuna | Skipjack Tuna | Mackerel Tuna | Large Pelagic Fish | ||||||||||||
| Headline | Tuna Longline | Pole and Line | Purse Seine Net | Pole and Line | Purse Seine | Lift Net | Pole and Line | Purse Seine | Lift Net | headline | Tuna Longline | Pole and Line | Purse Seine Net | Lift Net | |
| 2015 | 552.77 | - | - | - | - | 6000.00 | - | - | - | 1574.50 | 552.77 | - | - | 6000.00 | 1574.50 |
| 2016 | - | 2466.47 | - | - | - | - | 1911.00 | - | - | 1560.83 | - | 2466.47 | - | - | 1587.77 |
| 2017 | 1452.83 | 2554.83 | 2644.19 | - | 1243.51 | 4300.00 | 100.00 | 770.77 | - | 383.40 | 1452.83 | 2554.83 | 1375.75 | 4300.00 | 336.17 |
| 2018 | 4168.89 | 2847.17 | 879.96 | - | 1507.51 | 5764.27 | 1769.07 | 663.57 | 485.00 | 1015.08 | 4168.89 | 2847.17 | 1345.14 | 4952.08 | 1172.97 |
| 2019 | 4668.64 | 2279.33 | 3005.55 | - | 1402.96 | 1155.00 | 1227.05 | 677.50 | 1157.77 | 1234.13 | 4668.64 | 2279.33 | 1487.14 | 1157.12 | 1233.62 |
| 2020 | 5140.96 | - | 4506.82 | 925.72 | 1370.61 | 6955.94 | 403.08 | 595.79 | 1721.23 | 1604.24 | 5140.96 | - | 1745.57 | 2205.19 | 1497.26 |
| 2021 | 5936.12 | - | 2392.30 | 1469.00 | 1109.98 | 1550.00 | 1360.29 | 500.00 | 1100.33 | 731.15 | 5936.12 | - | 1430.84 | 1351.00 | 1104.70 |
| 2022 | 23690.08 | - | 3005.75 | - | - | 1046.67 | - | - | - | 2400.00 | 23690.08 | - | 3005.75 | 1046.67 | 2400.00 |
| Total | 45610.29 | 10147.80 | 16434.57 | 2394.72 | 6634.58 | 26751.88 | 6770.49 | 3208.63 | 4464.33 | 10503.34 | 45610.29 | 10147.80 | 10390.18 | 21012.05 | 10906.99 |
| Average | 6515.76 | 2536.95 | 2739.10 | 1197.36 | 1326.92 | 3821.70 | 1128.41 | 641.73 | 116.08 | 1312.92 | 6515.76 | 2536.95 | 1731.70 | 3001.72 | 1363.37 |
| FPI | 1.00 | 0.39 | 0.42 | 0.18 | 0.35 | 1.00 | 0.30 | 0.49 | 0.85 | 1.00 | 1.00 | 0.39 | 0.27 | 0.46 | 0.21 |
Standardization of Fishing Gear
This study utilized time series data on the catch of tuna, skipjack, and mackerel scad (Mackerel Tuna), along with fishing effort data for large pelagic species landed at Bungus Oceanic Fishing Port from 2015 to 2022. Before calculating indicators such as Catch per Unit Effort (CPUE), Maximum Sustainable Yield (MSY), optimum effort (Fopt), utilization rate, and fishing intensity, it was necessary to standardize the fishing gear due to the use of multiple gear types targeting the same species. Five fishing gears were identified during the study period: handline, tuna longline, trolling line (Pole and Line), purse seine, and lift net (Lift Net). Tuna were caught using four types of gear: handline, tuna longline, Pole and Line, and purse seine. Meanwhile, skipjack and mackerel scad were captured using Pole and Line, purse seine, and lift net. To establish a standard gear type, the productivity values of each gear were first assessed.
Differences in catch performance among fishing gears necessitate the standardization of fishing efforts before further analysis. This standardization is achieved by selecting a gear type with the highest productivity as the reference gear based on the dominant catch species. Productivity is measured as the catch volume per unit effort, reflecting a fishing gear's efficiency. According to Syamsuddin et al. (2007), the Fishing Power Index (FPI) is derived from the average productivity of each gear type, with the reference gear assigned an FPI value of 1. The standard effort is then calculated by multiplying the FPI by the number of units for each gear type (30).
Analysis of gear productivity shows that handline is the most effective for tuna, purse seine for skipjack, and lift net (Lift Net) for mackerel scad. Overall, the handline demonstrated the highest productivity in harvesting large pelagic fish, making it the standard gear with the highest catch ratio. In 2022, the productivity of handline gear reached its peak, likely due to favorable fish abundance in the fishing grounds, high gear productivity typically indicates high fish availability, which in turn boosts fishers' incom Catch Unit Per Effort (CPUE).
Catch per Unit Effort (CPUE) serves as a key indicator of fish stock status, reflecting the relative abundance of a resource. To calculate CPUE, standardized effort must first be determined, which involves adjusting fishing effort data based on gear type and catch volume (31). Standardized effort is obtained by multiplying the number of fishing units by their respective Fishing Power Index (FPI), and annual total effort is derived by summing all gear-specific efforts (see Table 2).
| Year | Total Standardized Effort (Trips) | |||
|---|---|---|---|---|
| Tuna | Skipjack Tuna | Mackerel Tuna | Large Pelagic Fish | |
| 2015 | 13.00 | 1.00 | 44.00 | 22.67 |
| 2016 | 5.84 | 0.30 | 12.00 | 8.56 |
| 2017 | 26.74 | 34.93 | 11.35 | 54.88 |
| 2018 | 28.85 | 75.00 | 375.12 | 157.61 |
| 2019 | 81.53 | 142.22 | 587.90 | 316.06 |
| 2020 | 70.11 | 159.99 | 967.20 | 410.65 |
| 2021 | 99.09 | 69.47 | 29.53 | 150.55 |
| 2022 | 13.68 | 12.00 | 1.00 | 18.80 |
Data analysis shows the highest standardized effort for tuna fishing occurred in 2021 (99.09 trips), while the lowest was in 2016 (5.84 trips). For skipjack and mackerel scad, the peak efforts were recorded in 2020, with the lowest for skipjack in 2016 and mackerel scad in 2022. The overall highest fishing effort for large pelagic species was also observed in 2020 (410.65 trips), with the lowest in 2016 (8.56 trips).
In Indonesia, fishing activities are heavily driven by catch results, prompting fishers to increase their effort when yields are low in hopes of compensation or to exploit high yields for greater profit. However, increased effort does not always correlate with higher catches, as external factors such as adverse weather (e.g., high waves and heavy rainfall) may reduce fishing activity (32). Therefore, calculating CPUE is essential before estimating the Maximum Sustainable Yield (MSY) for fishery resources.
CPUE values for tuna, skipjack, and mackerel tuna fluctuated during 2015–2022. These variations are attributed to changes in fishing efforts throughout the years. As shown in Table 3, the highest CPUE for tuna occurred in 2022, reaching 21,657.24 kg/trip, while the lowest was recorded in 2015 at 552.77 kg/trip. For skipjack tuna, the highest CPUE was observed in 2016 at 6,472.15 kg/trip, with the lowest in 2022 at 1,046.67 kg/trip. In the case of mackerel tuna, the highest CPUE was in 2022 at 2,400.00 kg/trip and the lowest in 2021 at 789.46 kg/trip. The highest CPUE for large pelagic fish was recorded in 2022, amounting to 16,556.10 kg/trip.
| Year | Fishing Gear Productivity (Kg/Trip) | |||||||||||
|---|---|---|---|---|---|---|---|---|---|---|---|---|
| Tuna | Skipjack Tuna | Mackerel Tuna | Large Pelagic Fish | |||||||||
| Production (Kg) | Total Effort (Trips) | CPUEs (Kg/Trip) | Production (Kg) | Total Effort (Trips) | CPUEs (Kg/Trip) | Production (Kg) | Total Effort (Trips) | CPUEs (Kg/Trip) | Production (Kg) | Total Effort (Trips) | CPUEs (Kg/Trip) | |
| 2015 | 7186 | 13.00 | 552.77 | 6000 | 1.00 | 6000.00 | 69278 | 44.00 | 1574.50 | 82464 | 22.67 | 3638.01 |
| 2016 | 36997 | 5.84 | 6334.73 | 1911 | 0.30 | 6472.15 | 18730 | 12.00 | 1560.83 | 57638 | 8.56 | 6733.02 |
| 2017 | 142998 | 26.74 | 5347.14 | 125590 | 34.93 | 3595.21 | 11937 | 11.35 | 1051.34 | 280525 | 54.88 | 511.29 |
| 2018 | 127851 | 28.85 | 4430.95 | 389035 | 75.00 | 5186.87 | 381196 | 375.12 | 1061.19 | 898082 | 157.61 | 5698.26 |
| 2019 | 413636 | 81.53 | 5073.60 | 553040 | 142.22 | 3888.67 | 729708 | 587.90 | 1241.21 | 1696384 | 316.06 | 5367.35 |
| 2020 | 462969 | 70.11 | 6603.26 | 615279 | 159.99 | 3845.69 | 1574379 | 967.20 | 1627.77 | 2652627 | 410.65 | 6459.63 |
| 2021 | 583585 | 9909 | 5889.29 | 234607 | 69.47 | 3377.22 | 23311 | 29.53 | 789.46 | 841503 | 150.55 | 5589.65 |
| 2022 | 296304 | 13.68 | 21657.24 | 12560 | 12.00 | 1046.67 | 2400 | 1.00 | 2400.00 | 311264 | 18.80 | 16556.10 |
| Total | 2017526 | 338.85 | 55888.98 | 1938022 | 494.91 | 33412.47 | 2810939 | 2008.10 | 11261.31 | 6820487 | 1140 | 55153.31 |
| Average | 258940 | 42.36 | 6986.12 | 242253 | 61.86 | 4176.56 | 351367 | 253.51 | 1407.66 | 852561 | 142 | 6894.16 |
Generally, higher CPUE values indicate greater catches obtained with relatively lower fishing effort, while lower CPUE values suggest smaller catches despite increased fishing effort. This discrepancy may be due to various factors, including the lack of proportional increases in fish stock availability and changes in environmental conditions such as high waves and strong winds. The negative correlation between CPUE and fishing effort implies that increasing fishing effort tends to result in lower CPUE values, thereby indicating a decline in gear productivity (33). Consequently, CPUE can indicate the efficiency level of fishing practices and effort application. CPUE is influenced by the intensity and frequency of fishing efforts carried out during the year to obtain fish catches.
The calculation results indicate a linear equation between the CPUE and fishing effort for tuna (see Figure 5A), expressed as CPUE = 8383 – 32.978x. Using the Schaefer model, the estimated parameters are the intercept (a) at 8383 and the slope (b) at –32.978, indicating a negative relationship between tuna production and fishing effort. Based on this equation, it can be interpreted that for every additional unit of fishing effort (trip), the CPUE of tuna decreases by 32.978 kg/trip. The natural potential CPUE is estimated to be 8383 kg/trip if no fishing effort is applied.
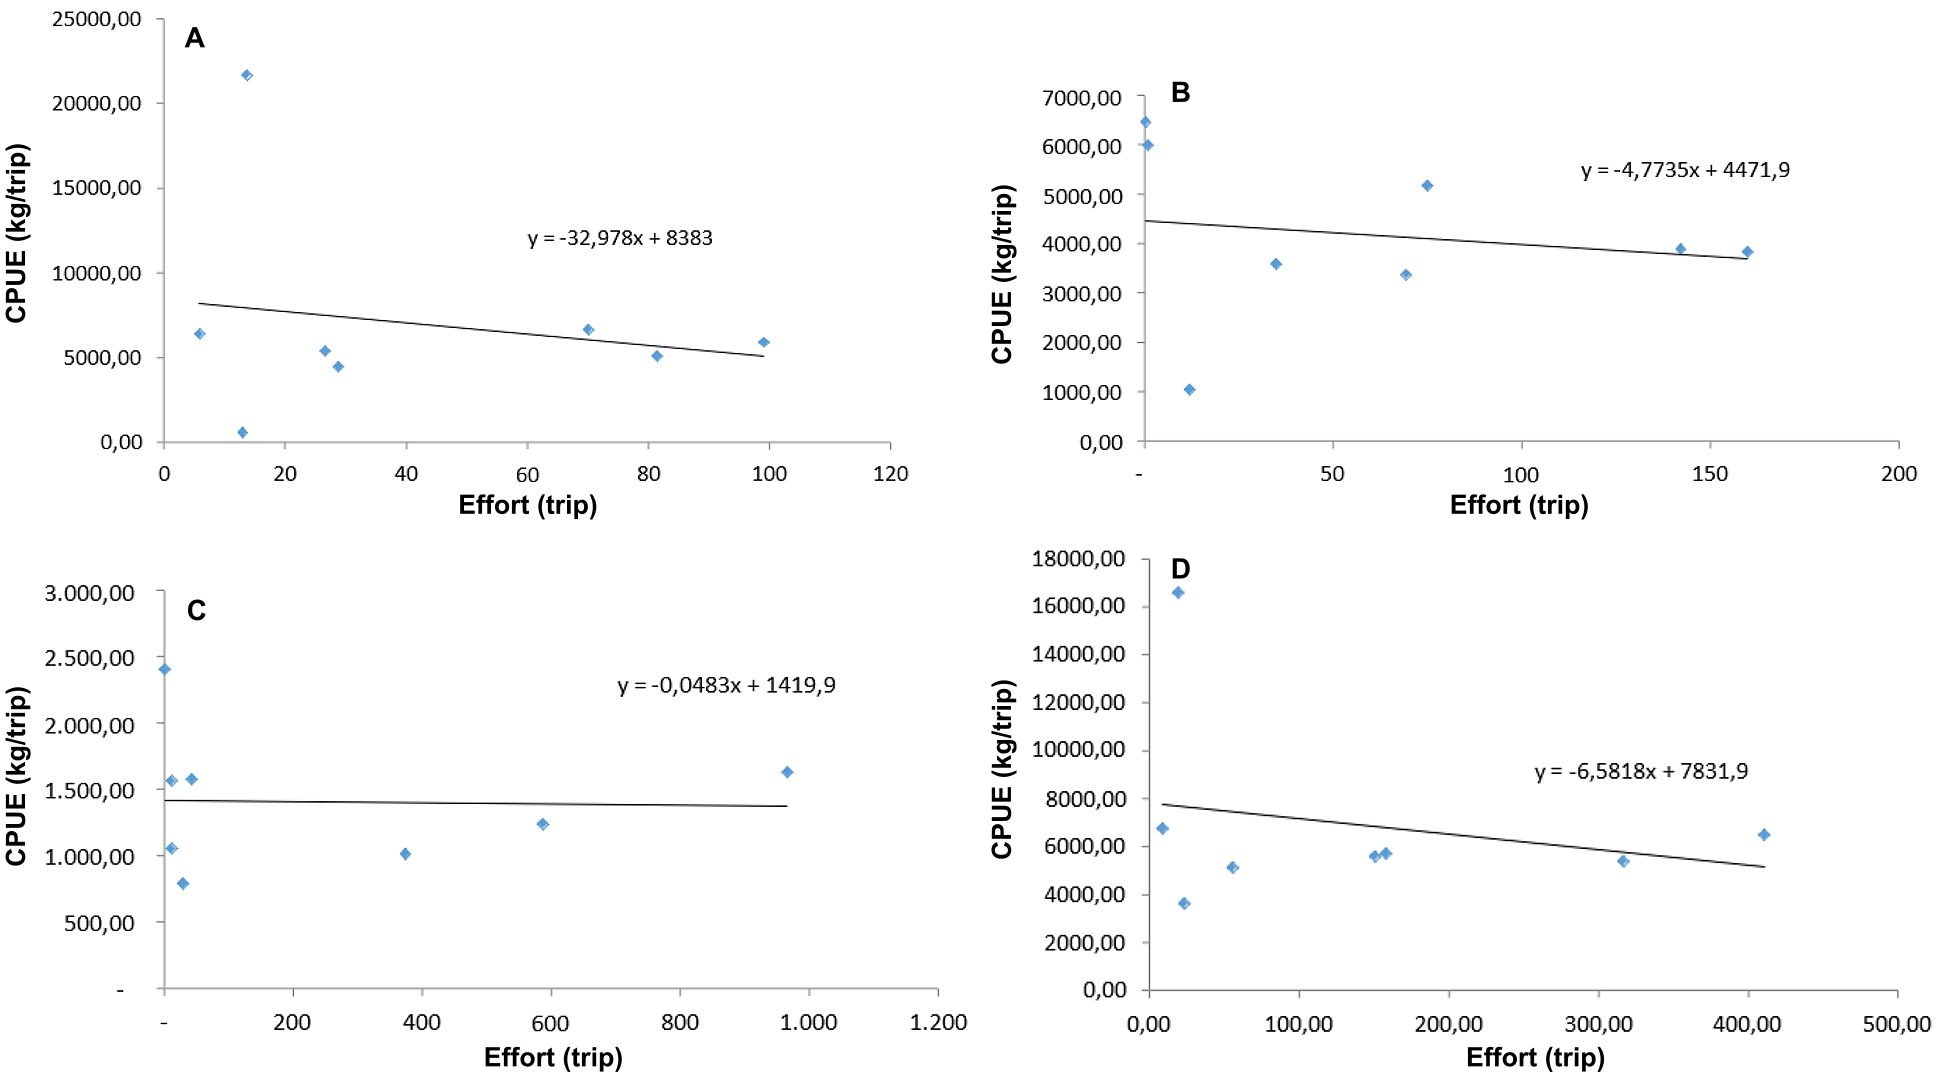
The linear equation for skipjack tuna (cakalang) CPUE is given by CPUE = 4471.9 – 4.7735x, where the intercept (a) is 4471.9, and the regression coefficient (b) is 4.7735 (see Figure 5B). This indicates a negative relationship between CPUE and fishing effort. According to the equation, each additional unit of fishing effort decreases skipjack tuna CPUE by 4.7735 kg/trip. Without fishing effort, skipjack tuna's estimated natural CPUE potential is 4471.9 kg/trip.
The linear equation for the CPUE of the mackerel tuna is given by CPUE = 1419.9 - 0.0483x, where the constant (a) is 1419.9 and the regression coefficient (b) is -0.0483 (see Figure 5C). This indicates that for each additional unit of fishing effort (trip), the CPUE for mackerel tuna decreases by 0.0483 kg/trip. Without fishing effort, the potential for mackerel tuna remains at 1419.9 kg/trip.
The linear equation for the CPUE of large pelagic fish is represented as CPUE = 7831.9 - 6.5818x. The constant (a) is 7831.9, and the regression coefficient (b) is -6.5818 (see Figure 5D). This implies that for every additional unit of fishing effort (trip), the CPUE for large pelagic fish decreases by 6.5818 kg/trip. Without fishing effort, the potential for large pelagic fish remains at 7831.9 kg/trip. The CPUE trends for tuna, mackerel, and skipjack indicate a decline due to the increase in fishing effort, suggesting a decrease in fish abundance in the respective waters. The rising CPUE trend indicates that fish resource exploitation is still in the developmental stage, while a stable CPUE trend suggests nearing exploitation saturation (34). A declining CPUE trend signals the onset of overfishing if it continues. A negative regression coefficient (b) is essential in the Schaefer model, as it shows that increased fishing effort leads to reduced CPUE. If a positive coefficient is found, it suggests that increasing effort still leads to higher catches, and thus, further calculations for potential and optimum effort are unnecessary. Nabunome (2007) states that CPUE is inversely related to effort, where increased effort results in decreased catch per unit of effort due to the depletion of resources (35).
Total Allowable Catch (TAC)
Imron (2000) stated that the allowable catch (TAC) for fish resources is set at 80% of the available stock potential (34). This regulation not only controls the catch of large pelagic fish, such as tuna, mackerel, and skipjack but also helps manage the exploitation rate of fisheries resources. Combining JTB with a defined quota allocation facilitates sustainable resource management by limiting overfishing.
Exceeding 80% of the available fish resource potential indicates overfishing if sustained over time. Data from the Samudera Bungus Fishery Port shows that tuna catches in 2020 and 2021 exceeded the allowable catch limit, while mackerel and skipjack catches over the past eight years have remained within the permissible limit, suggesting potential for optimization without surpassing the MSY (see Table 4). Overall, the large pelagic fish catch in 2020 exceeded the allowable catch and MSY limits, indicating overfishing. Establishing permissible catch limits (JTB) is a critical management tool to ensure sustainable fisheries and resource renewal.
| Year | Tuna | Skipjack Tuna | Mackerel Tuna | Large Pelagic Fish | ||||
| Production (Kg) | TAC | Production (Kg) | TAC | Production (Kg) | TAC | Production (Kg) | TAC | |
| 2015 | 7,186 | 426,183 | 6,000 | 837,855 | 69,278 | 8,356,493 | 82,464 | 1,863,881 |
| 2016 | 36,997 | 1,911 | 18,730 | 57,638 | ||||
| 2017 | 142,998 | 125,590 | 11,937 | 280,525 | ||||
| 2018 | 127,851 | 389,035 | 381,196 | 898,082 | ||||
| 2019 | 413,636 | 553,040 | 729,708 | 1,696,384 | ||||
| 2020 | 462,969 | 615,279 | 1574,379 | 2,652,627 | ||||
| 2021 | 583, 585 | 234,607 | 23,311 | 841,503 | ||||
| 2022 | 296,304 | 12,560 | 2,400 | 311,264 | ||||
Utilization and Exploitation Rates
The calculation of utilization and effort rates aims to determine the percentage of fish resources utilized in a specific area, particularly in the western part of the Sumatra Sea. Utilization exceeding the maximum sustainable yield (MSY) threatens the sustainability of fish resources, disrupting availability and causing stock depletion. Various factors contribute to utilization, with decreased catches often linked to population decline due to overfishing. Utilization rates are calculated by dividing the catch in a given year by the MSY. In contrast, effort rates are obtained by dividing the production by the optimum effort (Fopt), expressed as a percentage. These calculations help determine the proportion of fishing effort applied.
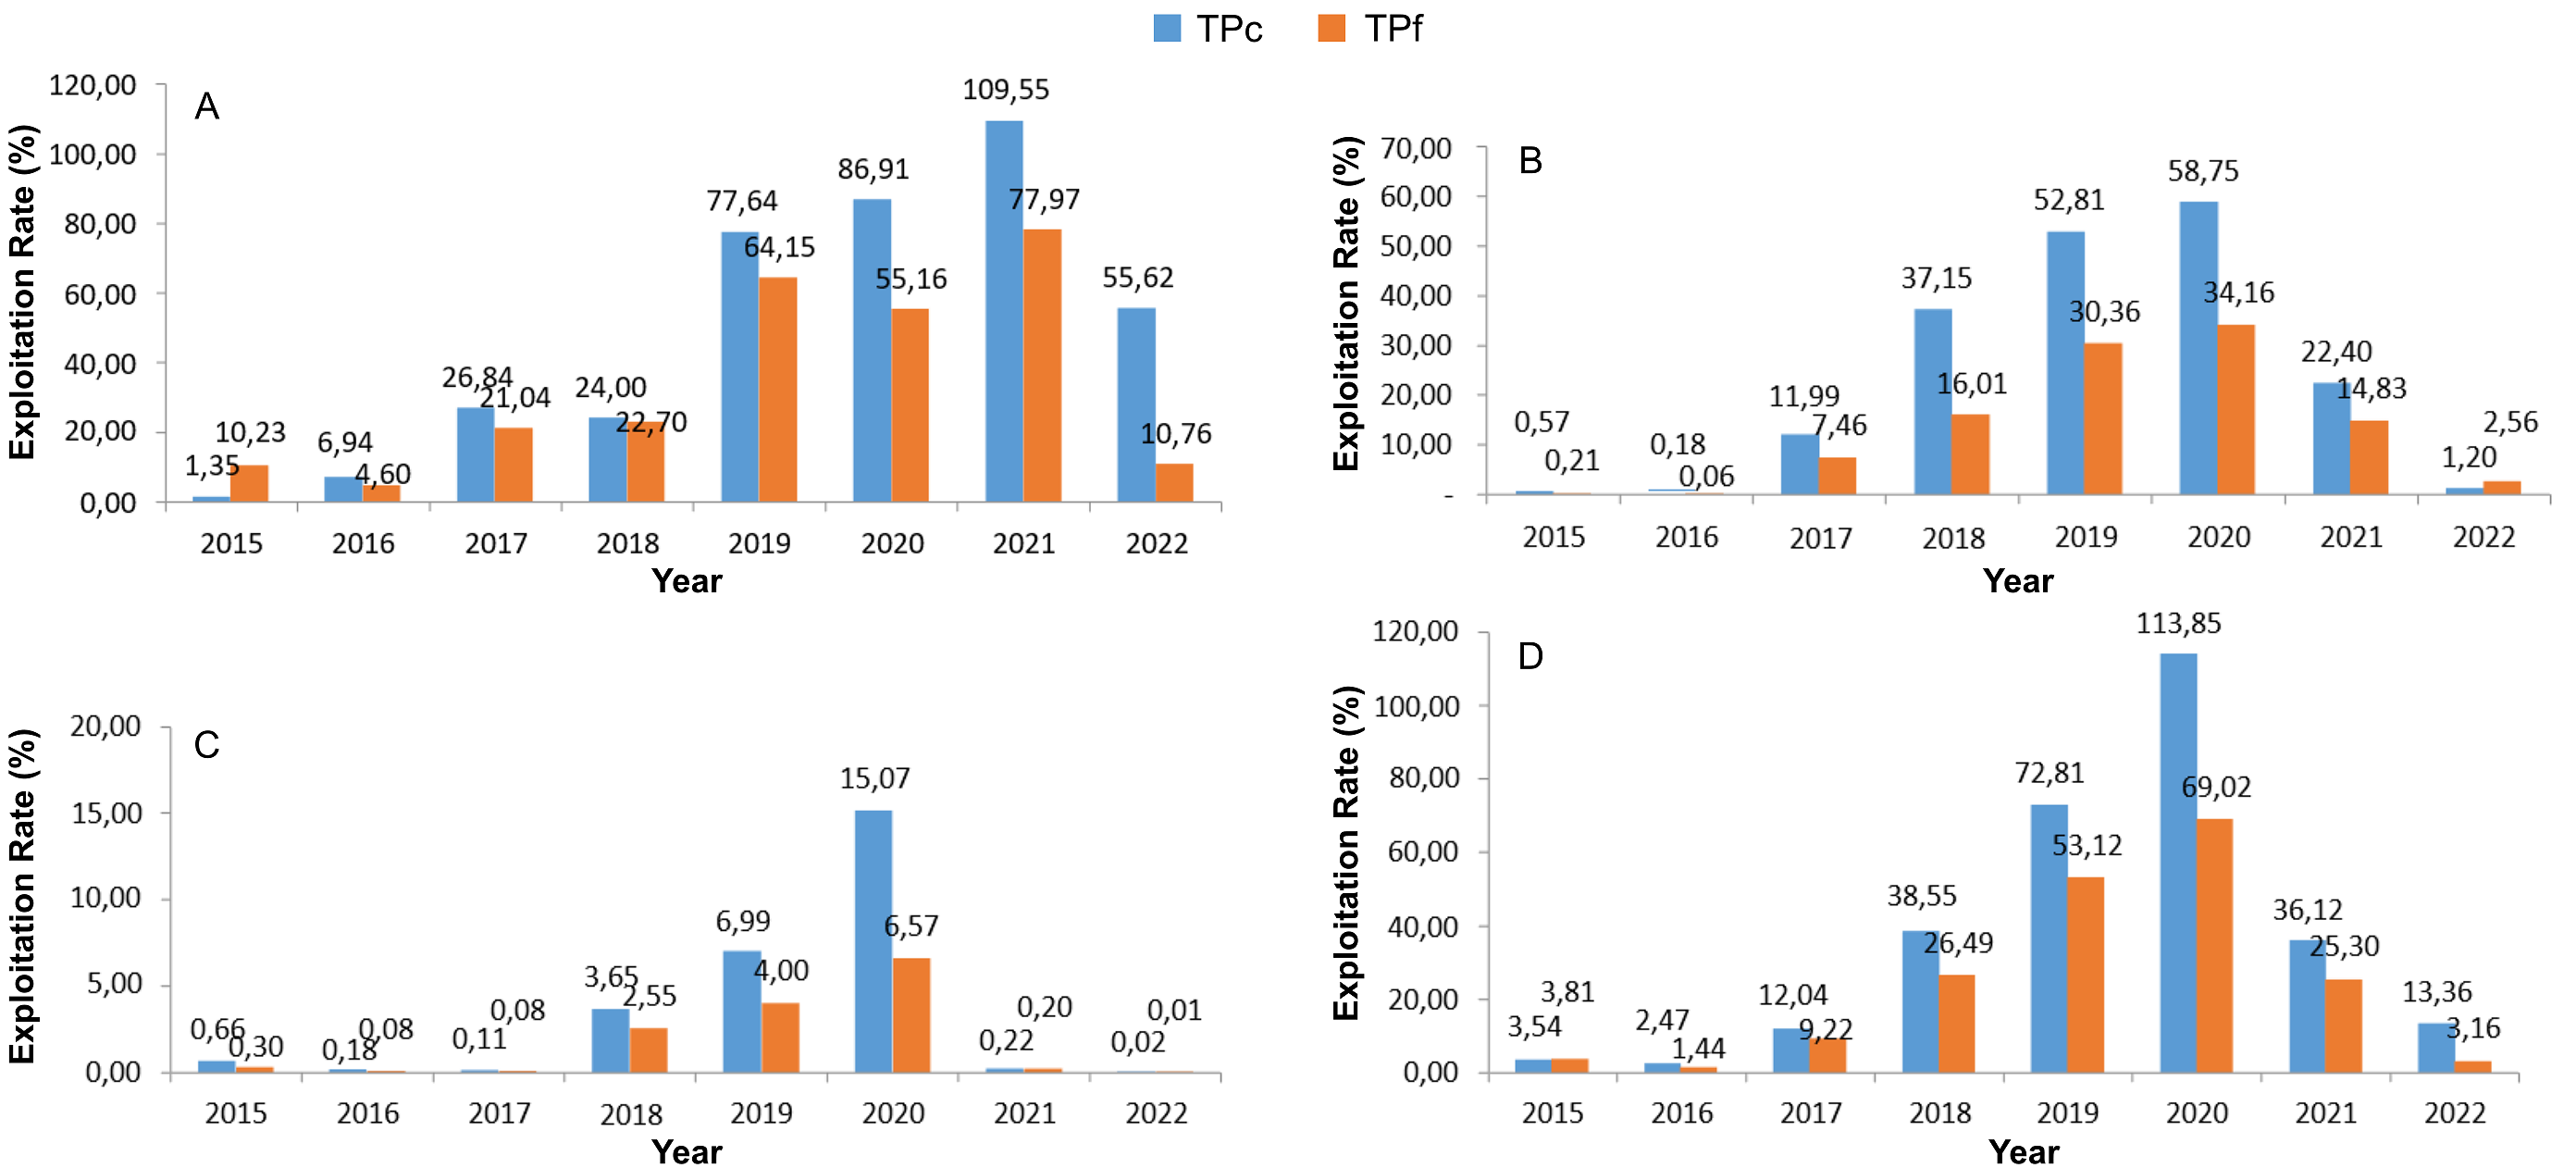
Based on Figure 6A, the utilization rate of tuna at Bungus Oceanic Fisheries Port fluctuated from 2015 to 2022. In 2015, the utilization rate was 1.35% with an effort rate of 10.23%, increasing to 6.94% and 4.60% in 2016 and reaching 26.84% and 21.04% in 2017. In 2018, the utilization rate was 24%, with 22.70% effort. In 2019, the utilization rate surged to 77.64% with 64.15% effort and increased in 2020 to 86.91% utilization with 55.16% effort. In 2021, the utilization rate exceeded the sustainable yield, reaching 109.55% with an effort rate of 77.97%, indicating overfishing. However, in 2022, utilization dropped to 55.62%, with 10.76% effort, signaling a decrease in exploitation.
The utilization rate in 2021 indicated overfishing, which could disrupt the sustainability of tuna stocks. This was evidenced by the decrease in utilization in 2022. Over the eight years (2015-2022), the average utilization rate for tuna was 48.61%, with an average effort rate of 33.33%. This suggests a moderate utilization level, meaning that the catch is still within the sustainable potential, and further increases in effort could still boost the tuna catch.
As shown in Figure 6B, the utilization rate of skipjack tuna (Skipjack Tuna) at Samudera Bungus fishing port varied from 2015 to 2022. In 2015, the utilization rate was 0.57%, with an effort rate of 0.21%. This decreased in 2016 to 0.18% utilization and 0.06% effort. In 2017, utilization increased to 11.99% with an effort rate of 7.46% and further rose to 37.15% utilization with 16.01% effort in 2018. In 2019, the utilization rate reached 52.81% with 30.36% effort and continued to rise in 2020 to 58.75% utilization with 34.16% effort. However, in 2021 and 2022, utilization dropped to 22.40% and 1.20%, with effort rates of 14.83% and 2.56%, respectively. The maximum utilization of skipjack tuna occurred in 2020 (58.75%), while the effort did not exceed the optimal level (30.36%), indicating that the fishery may still be underfished.
The average utilization rate for skipjack tuna from 2015 to 2022 was 23.13%, with an average effort rate of 13.21%. These figures suggest that the exploitation of skipjack tuna during this period remained low, meaning the catches were still only a small proportion of the sustainable yield, and efforts to increase catch levels are still required.
As depicted in Figure 6C, the utilization rate of mackerel (Mackerel Tuna) from 2015 to 2022 at Samudera Bungus fishing port varied, with the highest utilization occurring in 2020 at 15.07%. In 2015, the utilization rate was 0.66%, rising to 0.18% in 2016 and 0.11% in 2017. In 2018, the rate increased to 3.65%, followed by 6.99% in 2019 and 15.07% in 2020. However, the utilization rate dropped again in 2021 and 2022 to 0.22% and 0.02%, respectively. The maximum utilization observed during this period (15.07%) was still classified as low, and the effort rate in 2020 (6.57%) did not exceed the optimal level, indicating that the fishery is still underfished.
The average utilization rate for mackerel between 2015 and 2022 was 3.36%, with an average effort rate of 1.72%. This indicates that the exploitation of mackerel remains low, with the catch still representing a small proportion of the sustainable yield. Therefore, there is still potential for increasing mackerel catch levels by improving fishing efficiency and effectiveness.
Based on Figure 6D, the average utilization rate of large pelagic fish resources is 37%, which falls into the moderate category, indicating that further increases in fishing efforts could still maximize catch yields. The utilization rate of pelagic fish resources between 2015 and 2022 exhibited fluctuations, which can be attributed to various factors. A decline in catch is often linked to decreased population size due to high fishing efforts in previous years. In contrast, an increase in catch may result from population growth following reduced fishing efforts in preceding years (36).
Management of fishery resources is crucial to prevent overexploitation that may lead to resource depletion. It is essential to encourage effective and selective fishing practices using environmentally friendly fishing gear to ensure the sustainability of fish stocks (37). Proper management of fishery resources is necessary to maintain their long-term viability. Continuous overfishing can endanger the sustainability of these resources and may eventually lead to their depletion.
The Catch of Large Pelagic Fish at the Bungus Oceanic Fishing Port in 2015–2022
The western waters of Sumatra are among Indonesia’s productive fishing grounds, particularly for capture fisheries. Increasing human demand has driven intensified exploitation of large pelagic fish such as tuna (Thunnus sp.), skipjack (K. pelamis), and mackerel tuna (E. affinis), which are key target species landed at the Bungus Oceanic Fishing Port. Catch data from 2015 to 2022 show fluctuating trends (see Figure 7A).
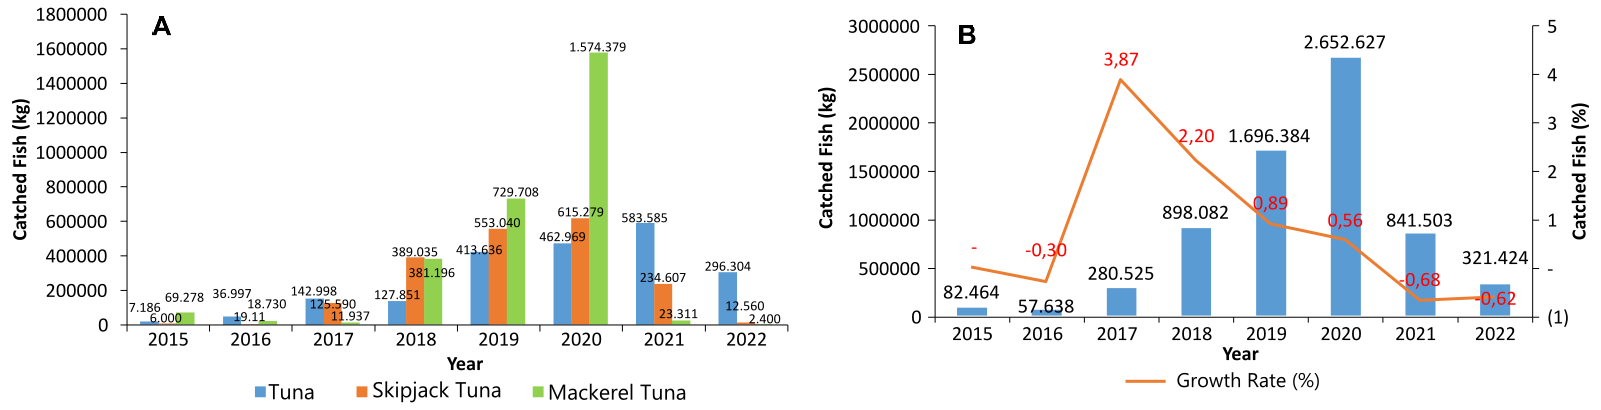
Tuna catches rose significantly from 7,186 kg in 2015 to a peak of 583,585 kg in 2021 before declining to 296,304 kg in 2022. Skipjack tuna followed a similar pattern, increasing from a low of 1,911 kg in 2016 to 615,279 kg in 2020, then decreasing sharply in 2022 to 12,560 kg. The lowest catches for both species were recorded in 2015, likely due to the 2014 moratorium under Ministerial Regulation No. 56/PERMEN-KP/2014, which temporarily halted fishing license issuance and impacted subsequent catches.
Mackerel tuna catches peaked at 1,574,379 kg in 2020 after declining between 2015 and 2017. However, the lowest catch was recorded in 2022 at only 2,400 kg, a decline reportedly linked to the re-verification of registered lift-net vessels at the Bungus port, which may have affected fishing operations.
Growth Trends in the Catch of Large Pelagic Fish from 2015 to 2022
The intensification of fishing activities has led to an increase in the production of large pelagic fish resources. This growth can be further enhanced by expanding the fishing fleet, extending fishing areas, and adopting advanced technologies (36). The waters off West Sumatra are considered one of Indonesia’s productive fishing grounds, with tuna, skipjack, and mackerel tuna serving as the primary catch commodities.
As illustrated in Figure 7B, the catch of large pelagic fish showed a fluctuating trend between 2015 and 2022. While catch volumes increased from 82,464 kg in 2015 to 280,525 kg in 2017, subsequent years saw a decline, with catches recorded at 898,082 kg in 2018, peaking at 2,652,627 kg in 2020, before dropping to 321,424 kg in 2022. The highest catch growth occurred in 2017 (3.87%), while the lowest was in 2016 (−0.30%). Fish production levels are influenced by the availability of target species and are shaped by internal factors (biological and ecological processes) and external factors (marine environment and fishing effort).
Conclusion
Large pelagic fisheries at Bungus Oceanic Fishing Port show positive growth and remain within sustainable limits, with average utilization at 37% and effort at 24%. While tuna exceeded its MSY in 2021, overall exploitation levels are moderate, leaving room for controlled increases in fishing effort. Future management should use longer-term data, consider external factors, and apply modern technology to maintain sustainability and support local livelihoods.
Declarations
Conflict of Interest
The authors declare no conflicting interest.
Data Availability
The unpublished data is available upon request to the corresponding author.
Ethics Statement
Not applicable.
Funding Information
The author(s) declare that no financial support was received for the research, authorship, and/or publication of this article.
References
- Jaya I, Satria F, Wudianto, Nugroho D, Sadiyah L, Buchary EA, et al. “Are the working principles of fisheries management at work in Indonesia?” Mar Policy. 2022 Jun;140:105047.
- Fauzi AI, Azizah N, Yati E, Atmojo AT, Rohman A, Putra R, et al. Potential Loss of Ecosystem Service Value Due to Vessel Activity Expansion in Indonesian Marine Protected Areas. ISPRS Int J Geoinf. 2023 Feb 18;12(2):75.
- Pramoda R, Shafitri N, Indahyanti B V, Zulham A, Koeshendrajana S, Yuliaty C, et al. Utilization of fish resources in the Indonesia’s Exclusive Economic Zone within the Fishery Management Area of 573: Case study in Rote Ndao Regency. IOP Conf Ser Earth Environ Sci. 2021 Nov 1;869(1):012018.
- Harisa Fakhrunnisa K, Triarso I, Anggi Setyawan H, Soedarto JH, Tembalang S. Analysis of Operational Characteristics of Purse Seine Vessels Based In PPS Nizam Zachman using Vessel Monitoring System Data (Case Study at WPP 572). Indonesian Journal of Fisheries Science and Technology Available. 2021;17(3):188.
- Ahmed Q, Yousuf F, Sarfraz M, Mohammad Ali Q, Balkhour M, Safi SZ, et al. Euthynnus affinis (little tuna): fishery, bionomics, seasonal elemental variations, health risk assessment and conservational management. Front Life Sci. 2015 Jan 2;8(1):71–96.
- Arnenda GL, Rochman F. Characteristics of Tuna, Small Tuna and Skipjack (TTS) Fishery in Kutaraja Ocean Fishing Port, Aceh. Saintek Perikanan : Indonesian Journal of Fisheries Science and Technology. 2021 Aug 28;17(2):90–8.
- Bimas Saputra E, Maharani A, Saputra F. Dynamic Model of Tuna Logistics System in Padang City. Siber Journal of Transportation and Logistics. 2023 Apr 10;1(1):38–50.
- Kittinger JN, Rotjan RD, Hanich Q, Pasisi B, Rambourg C. Balancing protection and production in ocean conservation. npj Ocean Sustainability. 2024 Apr 15;3(1):24.
- Canales CM, Olea G, Jurado V, Espíondola M. Management Strategies Evaluation (MSE) in a mixed and multi-specific fishery based on indicator species: An example of small pelagic fish in Ecuador. Mar Policy. 2024 Apr;162:106044.
- Hilborn R, Fulton EA, Green BS, Hartmann K, Tracey SR, Watson RA. When is a fishery sustainable? Canadian Journal of Fisheries and Aquatic Sciences. 2015 Sep;72(9):1433–41.
- Hilborn R, Amoroso RO, Anderson CM, Baum JK, Branch TA, Costello C, et al. Effective fisheries management instrumental in improving fish stock status. Proceedings of the National Academy of Sciences. 2020 Jan 28;117(4):2218–24.
- Wada M. Smart Fisheries for Sustainable Fisheries in Indonesia: A Study of Sardine Fishery in the Bali Strait. 2022.
- Fajriah F, Mustafa A, Rais M, Anadi L, Isamu KT, Iswandi M, et al. UFLPlus: An Underwater Fish Lamp Technology as an Innovation of Fish-Luring Aids on Boat Lift Net. Jurnal Ilmiah Perikanan dan Kelautan. 2022 Feb 27;14(1):93–104.
- Gillett R. Pole-and-Line Tuna Fishing in the World: Status and Trends. 2016.
- Semin ST. The Correlation Analysis of Sea-Food Supply Chain and The Formation of National Fishery Fleet Doddy Widodo Laksono 09211750077010. 2019;
- Wada M. Smart Fisheries for Sustainable Fisheries in Indonesia: A Study of Sardine Fishery in the Bali Strait. 2022.
- Rohman Hariri F. Metode Least Square untuk Prediksi Penjualan Sari Kedelai Rosi. Jurnal SIMETRIS. 2016;7(2).
- Saimona T, Kurniawan, Supratman O. Analisis Potensi dan Tingkat Permanfaatan Sumberdaya Ikan di Perairan Kabupaten Belitung. Jurnal Sumberdaya Perairan. 2021;15.
- Tangke U. Analisis potensi dan tingkat pemanfaatan sumberdaya ikan kuwe (Carangidae sp) di perairan Laut Flores Propinsi Sulawesi Selatan. Agrikan: Jurnal Agribisnis Perikanan. 2010 Oct 15;3(2):31–8.
- Latuconsina H. Pendugaan potensi dan tingkat pemanfaatan ikan layang ( Decapterus spp) di perairan Laut Flores Sulawesi Selatan. Agrikan: Jurnal Agribisnis Perikanan. 2010 Oct 17;3(2):47–54.
- Murniati. Potensi dan Tingkat Pemanfaatan Ikan Terbang (Exocoetidae) di Perairan Majene, Kabupaten Majene Provinsi Sulawesi Barat. [Makassar]: Universitas Hasanuddin Makassar; 2011.
- Jupitar J, Susiana S, Lestari F. Tingkat Pemanfaatan Ikan Kaci-Kaci (Diagramma pictum) Pada Perairan Mapur yang didaratkan di Desa Kelong, Kabupaten Bintan, Indonesia. Jurnal Akuakultur. 2020 May;4(1).
- Napitupulu L, Tanaya Sitanggang S, Ayostina I, Andesta I, Fitriana R, Ayunda D, et al. Trends in Marine Resources and Fisheries Management in Indonesia: A Review. World Resources Institute. 2022 Dec;
- Syaukat Y, Kusumastanto T. Economic impact of moratorium of foreign fishing vessel policy in Arafura Sea, Indonesia [Internet]. 2019.
- Wang X, Wang C. Different impacts of various El Niño events on the Indian Ocean Dipole. Clim Dyn. 2014 Feb 5;42(3–4):991–1005.
- Huang Z, Zhang W, Liu C, Stuecker MF. Extreme Indian Ocean dipole events associated with El Niño and Madden–Julian oscillation. Clim Dyn. 2022;59(7–8).
- Sumaila UR, Bellmann C, Tipping A. Fishing for the future: An overview of challenges and opportunities. Mar Policy. 2016 Jul;69:173–80.
- Kenny AJ, Campbell N, Koen-Alonso M, Pepin P, Diz D. Delivering sustainable fisheries through adoption of a risk-based framework as part of an ecosystem approach to fisheries management. Mar Policy. 2018 Jul;93:232–40.
- Zahra ANA, Susiana S, Kurniawan D. The sustainable potential and utilization rate of Yellowtail scad fish ( Atule mate ) landed on Kelong Village, Bintan Regency, Indonesia. Akuatikisle: Jurnal Akuakultur, Pesisir dan Pulau-Pulau Kecil. 2019 Nov 10;3(2):57–63.
- Jamal M, Sondita MFA, Haluan J, Wiryawan B. Pemanfaatan Data Biologi Ikan Cakalang (Katsuwonus pelamis) dalam Rangka Pengelolaan Perikanan Bertanggung Jawab di Perairan Teluk Bone. 2011;
- Listiani A, Wijayanto D, Budi B, Program J, Pemanfaatan S, Perikanan S, et al. Analisis CPUE (Catch Per Unit Effort) dan Tingkat Pemanfaatan Sumberdaya Perikanan Lemuru (Sardinella lemuru) di Perairan Selat Bali. Jurnal Perikanan Tangkap : Indonesian Journal of Capture Fisheries. 2017 Jun 5;1(01).
- Annida SB, Baihaqi F. Fishing season estimation for tuna troll line fishing fleet at Palabuhanratu Nusantara Fishing Port, Sukabumi, Indonesia. Omni-Akuatika. 2024 Dec 26;20(2):100.
- Anas P, Jubaedah I, Danapraja S. Analisis Potensi Sumberdaya Ikan Pelagis di Pantai Ciparage Jaya Kabupaten Karawang. Jurnal Penyuluhan Perikanan dan Kelautan. 2010 Jul 29;4(1):43–52.
- Irhamsyah O:, Azizah N, Aulia H. Utilization Rate and Maximum Sustainable Yield of Squids in Tanah Bumbu Regency, South Kalimantan Province. 2013.
- Keo AS, Halim S, Wisudo SH. Level of Utilization of Cakalang Fisheries with Pole and Line Catching Equipment in Kupang. International Journal of Life Sciences & Earth Sciences. 2021;4(1):30–7.
- Sangaji MB, Tangke U, Namsa D. Potensi dan tingkat pemanfaatan ikan layang (Decapterus sp) di perairan Pulau Ternate. Agrikan: Jurnal Agribisnis Perikanan. 2016 Oct 19;9(2):1–10.
- Yanto F, Susiana, Muzammil W. Tingkat Pemanfaatan Ikan Umela (Lutjanus vitta) di Perairan Mapur yang didaratkan di Desa Kelong Kecamatan Bintan Pesisir Kabupaten Bintan. Journal of Tropical Fisheries Management. 2020 Oct 18;4(2):1–9.