RESEARCH ARTICLE
Phytochemical Characterization and Evaluation of Antioxidant Activity in Sorghum bicolor Leaves Extracts
Sciences of Phytochemistry|Vol. 5, Issue 1, pp. 31-42 (2026)
CC BY 4.0-2026 Authors
Views
Downloads
Shares
Received
Sep 26, 2025Revised
Dec 24, 2025Accepted
Jan 7, 2026Published
Feb 17, 2026
Abstract
This study investigated the phytochemical composition and in-vitro antioxidant potential of leaves extracts from Sorghum bicolor, which were obtained through sequential maceration with solvents of different polarities (n-hexane and methanol). The extraction yields revealed a predominance of polar compounds, with methanol extract (12.5% w/w) significantly higher than the n-hexane extract (1.7% w/w). Gas chromatography–mass spectrometry (GC–MS) profiling, using NIST library matching (similarity scores > 80%) without reference standards, showed distinct patterns based on solvent use: the n-hexane extract contained nine primarily lipophilic compounds, mainly consisting of Z-2-octadecen-1-ol and octadecenoic acid derivatives, whereas the methanol extract yielded fifteen characterized by polar fatty acids and oxygenated derivatives. Identifications were tentative; those with lower match scores or inconsistent retention times required confirmation through alternative methods. Antioxidant capacity was evaluated via 2, 2-diphenyl-1-picrylhydrazyl (DPPH) radical scavenging, hydroxyl radical inhibitory activity (HRIA), and ferric reducing antioxidant power (FRAP) assays. The methanol extract demonstrated concentration-dependent DPPH scavenging (IC₅₀ = 0.1402 mg/L), comparable to vitamin C (0.1369 mg/L) in this assay, while the n-hexane extract showed weaker activity (IC₅₀ 3.22 mg/L). In HRIA and FRAP assays, vitamin C consistently showed greater activity than either extract, with n-hexane IC50 estimates constrained by poor curve fits (R2< 0.9). Overall, the methanol extract surpassed the n-hexane extract across all assays but did not match the effectiveness of vitamin C. These in-vitro results suggest that S. bicolor leaves contain polar phytochemicals that merit further fractionation, compound-level characterization, and evaluation in biologically relevant models to elucidate their potential as sources of natural antioxidants.
Introduction
Oxidative stress occurs when the generation of reactive oxygen species (ROS) exceeds the neutralizing capacity of the body’s antioxidant defense systems, leading to oxidative damage of lipids, proteins, and nucleic acids. This imbalance plays a critical role in the onset and progression of chronic diseases, including cardiovascular disorders, diabetes mellitus, cancer, and neurodegenerative conditions (1). Although synthetic antioxidants such as butylated hydroxyanisole (BHA) and butylated hydroxytoluene (BHT) are effective in mitigating oxidative damage, their long-term use is associated with safety and toxicological concerns. Consequently, growing attention has been directed toward plant-derived antioxidants, which are generally regarded as safer and offer broader health benefits (2).
Plants serve as rich sources of natural antioxidants, particularly secondary metabolites such as flavonoids, phenolic acids, and tannins. The antioxidant efficacy of these compounds is governed not only by their concentration but also by their structural features, substitution patterns, and interactions within complex extract matrices. Accordingly, the mere presence of phytochemicals does not necessarily translate into functional antioxidant effectiveness, underscoring the need for structure-informed chemical–activity correlations. As a result, comprehensive chemical characterization combined with biological evaluation is essential for establishing meaningful relationships between phytochemical composition and functional antioxidant capacity (3).
Sorghum bicolor (L. ) Moench (family Poaceae) is the fifth most cultivated cereal crop worldwide and constitutes a staple food for more than half a billion people (4). While extensive research has explored the nutritional and functional attributes of sorghum grains, the phytochemical composition and antioxidant potential of sorghum leaves remain comparatively under-investigated (5). Available studies confirm the presence of phenolics and flavonoids in sorghum leaves (6); however, many rely on crude or poorly defined extraction protocols. Such approaches limit understanding of how solvent polarity influences compound recovery, phytochemical diversity, and structure–activity relationships.
Recent authoritative reviews confirm that research on Sorghum bicolor phytochemicals remains predominantly focused on grain antioxidants, with leaves comparatively under-investigated (5). When studies do target leaves, they often employ non-sequential extraction with a single solvent, such as the use of a chloroform-methanol mixture for fatty acid analysis (3), or rely on LC-MS to profile polar phenolic compounds in methanolic extracts (7). This conventional approach provides valuable but fragmented data, failing to systematically separate the full spectrum of metabolites by polarity or to correlate the distinct chemical profiles of different fractions with their bioactivity. Consequently, there is a lack of integrated chemical-functional analysis for sorghum leaves. Specifically, the application of sequential solvent extraction coupled with GC-MS profiling remains unexplored, leaving a gap in the characterization of volatile and semi-volatile lipophilic constituents that may contribute to the plant’s overall antioxidant mechanism.
Sequential extraction using solvents of increasing polarity, such as n-hexane and methanol, provides a systematic strategy for separating non-polar constituents (e.g. , fatty acids and terpenoids) from polar phenolic-rich fractions. This methodology enhances both chemical resolution and functional assessment of plant matrices (8). In this context, n-hexane preferentially solubilizes lipophilic metabolites, whereas methanol efficiently extracts polyphenols known for strong free radical scavenging activity. Coupling this extraction strategy with gas chromatography–mass spectrometry (GC–MS) enables high-resolution profiling of volatile and semi-volatile compounds relevant to biological function (8).
Based on this methodological framework, this study tests the hypothesis that sequential extraction of Sorghum bicolor leaves using n-hexane followed by methanol yields chemically distinct fractions with differential antioxidant activities. Specifically, it is proposed that the methanolic extract, enriched in polar phenolics and oxygenated phytochemicals, will exhibit stronger in-vitro antioxidant activity than the n-hexane extract. A second hypothesis posits that GC–MS profiling will reveal solvent-dependent enrichment of metabolite classes, with fatty acids and terpenoid derivatives predominating in the n-hexane fraction, and more polar oxygen-containing compounds dominating the methanol fraction. This approach enables correlation of specific chemical constituents with antioxidant assay outcomes, facilitating the identification of potential bioactive markers for further investigation (9).
Given the limited comparative analyses of sorghum leaves extracts prepared using solvents of differing polarity, and the absence of integrated chemical–functional profiling for this plant material, the present study seeks to address this gap. Accordingly, the phytochemical composition of Sorghum bicolor leaves extracts obtained via sequential maceration in n-hexane and methanol was characterized using GC–MS, and the resulting chemical profiles were correlated with in-vitro antioxidant assays. This integrated approach aims to elucidate solvent-dependent variations in composition and chemical antioxidant capacity, providing a foundation for future work to identify and validate specific bioactive constituents.
Materials And Methods
Chemicals and Reagents
Analytical‑grade 2, 2‑diphenyl‑1‑picrylhydrazyl (DPPH) was used for the free radical scavenging assay. The working reagent for the ferric reducing antioxidant power (FRAP) was prepared from iron (III) chloride hexahydrate (FeCl₃·6H₂O) and 2, 4, 6‑tripyridyl‑s‑triazine (TPTZ) in acetate buffer (pH 3.6), and iron (II) sulfate heptahydrate (FeSO₄·7H₂O) was used to create the Fe²⁺ calibration curve. Reagents for the hydroxyl radical inhibitory assay included hydrogen peroxide (H₂O₂), iron (III) chloride (FeCl₃), 1, 10‑phenanthroline, and phosphate buffer components. The reducing power reagents consisted of potassium ferricyanide, trichloroacetic acid, and iron (III) chloride in phosphate buffer. L‑ascorbic acid (vitamin C) served as the reference antioxidant across all assays. Analytical grade solvents such as n-hexane, methanol, ethanol, and distilled water (all analytical grade) were used for extraction, dilution, and reagent preparation. Helium (99.999% purity) was used as the carrier gas for GC–MS analysis. All chemicals and solvents were of analytical grade and sourced from commercial suppliers (e.g. , Sigma‑Aldrich/Merck KGaA, Darmstadt, Germany; Linde Gas, Munich, Germany).
Plant Material
Fresh leaves of Sorghum bicolor (L. ) Moench were collected from agricultural fields in Boher, Nasarawa State, Nigeria (08°32′N, 08°32′E) during the early dry season (January 2025). The plant was taxonomically identified and authenticated by a qualified plant taxonomist at the Department of Botany, University of Calabar, Nigeria, and a voucher specimen was prepared and deposited in the institutional Herbarium under the accession number 2025/CAL/HRB 76. Authentication details, including the taxonomic authority and locality, were recorded in the herbarium database to enable future reference and reproducibility. The leaves were thoroughly rinsed with distilled water to remove dust and surface contaminants, then shade-dried at ambient laboratory temperature (25 ± 2 °C) with adequate ventilation for three weeks until constant weight was achieved. The dried material was pulverized into a fine powder using a mechanical grinder (Thomas Wiley Mini-Mill, Model 3383-L10), passed through a 40-mesh sieve, and stored in airtight, light-protected containers at room temperature until extraction.
Extraction Method
The extraction was carried out using a slightly modified approach from Jack et al. (6) and Clark et al. (10). A total of 500 g of dried, powdered Sorghum bicolor leaves was first defatted by maceration in 2.0 L of n-hexane (analytical grade; solvent-to-solid ratio 4: 1 v/w) at room temperature (25 ± 2 °C) for 24 h with intermittent agitation every 12 h in a stoppered flask. The mixture was then filtered through Whatman No. 1 filter paper under vacuum, and the residue was re-extracted twice with fresh n-hexane (2.0 L each) for an additional 24 h per cycle under identical conditions to ensure thorough removal of non-polar components (for a total of three maceration cycles, cumulative contact time of 72 h). The combined n-hexane filtrates were set aside for separate analysis, while the defatted residue was air-dried at room temperature in a fume hood to eliminate any residual solvent. Subsequently the defatted plant material underwent maceration in 2.0 L of 95% methanol (solvent-to-solid ratio 4: 1 v/w) at room temperature (25 ± 2 °C) for 72 h with intermittent agitation every 12 h. This mixture was filtered as above, and the residue was re-extracted three more times with fresh methanol (2.0 L each) for 24 h per cycle, resulting in four methanolic extraction cycles (cumulative contact time 144 h). All methanolic filtrates were pooled, filtered, and concentrated under reduced pressure at 40 °C using a rotary evaporator (Heidolph Laborota 4002) to obtain the crude methanolic extract. Extract yields (w/w %) were calculated relative to the initial dry plant mass to facilitate comparison with other studies (11).
Phytochemical Screening Tests
Qualitative phytochemical screening of S. bicolor extracts was conducted according to established procedures (8, 11-12). Stock solutions (10 mg/mL) of each extract were prepared in their respective extraction solvents and freshly used on the day of analysis. The tests included Mayer’s and Wagner’s reagents for alkaloids, lead acetate and NaOH tests for flavonoids, Liebermann–Burchard reaction for terpenoids, ferric chloride test for tannins, frothing test for saponins, and the Keller–Killiani test for cardiac glycosides. Appropriate positive controls (reference standards for each class) and solvent blanks were run in parallel, with observations recorded within 5 min. Results were assessed qualitatively as present (+) or absent (–) based on characteristic colour changes or precipitate formation
Gas Chromatography-Mass Spectrometry (GC-MS)
The chemical profiles of S. bicolorn-hexane and methanolic extracts were analysed using an Agilent GC–MS system (GC 7890A coupled to MSD 5975C) equipped with an HP‑5MS capillary column (30 m × 250 μm i. d. × 0.25 μm film thickness). Extracts were diluted to 1% (w/v) in n-hexane or methanol as appropriate, filtered through 0.45 μm PTFE syringe filters, stored at 4 °C, and analysed within 24 h to minimize degradation. Helium (99.995% purity) served as the carrier gas at a constant flow of 1.0 mL/min. The injection volume was 1 μL in splitless mode, with the injector temperature set at 280 °C and a solvent delay of 3 min. The oven temperature program was: initial 50 °C (2 min), ramp at 3 °C/min to 150 °C (hold 10 min), then ramp at 10 °C/min to 300 °C (hold 10 min), giving a total run time of 63.3 min. The MS was operated in electron ionization (EI) mode at 70 eV, scanning m/z 40–500, with ion source and quadrupole temperatures of 230 °C and 150 °C, respectively.
Blank solvent injections and system suitability standards were run at regular intervals to monitor carryover, column bleed, and background contamination. Each extract was analysed in triplicate on separate days to assess reproducibility, and only peaks consistently present in all replicates were considered. Peaks were initially identified by matching mass spectra against the NIST library (NIST 11) with a minimum similarity index of ≥80%. For major peaks (relative area > 1%), only matches with similarity factors ≥90% and visually acceptable fragmentation patterns were accepted. Where available, experimental retention indices (RIs) were calculated by co-injecting a homologous series of n‑alkane standards (C8-C30) and compared with literature RI values for candidate compounds on similar stationary phases to increase confidence in identifications. Selected key constituents (e.g. , common fatty acids and sterols) were further confirmed by comparison with authentic analytical standards (retention time and mass spectra). Compounds with chemically implausible structures for higher plants, such as fatty acyl chlorides and brominated alkaloids, were treated with caution. Such hits were either excluded from the final compound list or reported as tentative if they showed low match factors, inconsistent RIs, or were absent in replicate injections and blanks, thereby minimizing artefacts and misassignments. Only peaks with areas > 1000 counts, signal-to-noise ratios ≥3: 1 (for identification) and ≥10: 1 (for relative quantification), and peak widths of 0.05-0.5 min were integrated. Relative abundances were calculated by peak-area normalization (% total ion chromatogram), and data were processed using Agilent MassHunter with manual inspection and adjustment of integrations for overlapping peaks. Negative or inverted peaks attributable to baseline instabilities or detector polarity artefacts were not considered in quantitative analysis; chromatograms exhibiting such issues were reprocessed after baseline.
Antioxidant Assays
Hydroxyl Radical Inhibitory Activity
Hydroxyl radical inhibitory activity was evaluated using the Fe2+/H2O2/1, 10-phenanthroline system described by Ndukwe et al. [12], with slight modifications. Briefly, 1.0 mL of phosphate buffer (0.2 M, pH 7.2), 1.0 mL of test solution (extract or vitamin C), 0.02 mL of FeCl₃ (0.02 M), and 0.05 mL of 1, 10-phenanthroline (0.04 M) were added to a test tube. The reaction was initiated by adding 0.05 mL of H₂O₂ (7 mM), and the mixture was incubated at room temperature (25 °C) for 5 min. Absorbance was measured at 560 nm against a reagent blank using a UV–Vis spectrophotometer.
Test solutions were prepared over a concentration range of 0.25–2.00 mg/L for extracts and 0.25–2.00 mg/L for vitamin C, selected based on preliminary experiments that ensured 10–90% inhibition and established a sigmoidal concentration–response relationship suitable for IC₅₀ estimation.
Preliminary tests confirmed the linearity of the absorbance response with respect to radical inhibition within this range, ensuring the assay was performed under optimized conditions. The percentage scavenging was calculated in Eq. 1, and the resulting inhibition values were used for concentration–response analysis and subsequent IC₅₀ determination.
All measurements were performed in triplicate, and results were expressed as mean ± standard deviation. Control reactions containing all reagents except the test sample were included in each experimental run to account for background absorbance and spontaneous radical generation. The assay conditions, including incubation time, reagent concentrations, and wavelength of measurement, were maintained constant across all samples to ensure comparability of results. This standardized approach minimized analytical variability and allowed reliable comparison of hydroxyl radical inhibitory activity between extracts and the reference antioxidant.
DPPH Radical Scavenging Activity
DPPH radical scavenging activity was determined according to Jack et al. [8], with modifications to optimize sensitivity and linearity. A fresh solution of methanolic DPPH at a concentration of 0.15% (w/v) was prepared and adjusted to an initial absorbance between 0.90 and 1.00 at 515 nm. For each test point, 1.0 mL of DPPH solution was mixed with 3.0 mL of sample solution (extract or vitamin C in methanol) and allowed to incubated in the dark at room temperature for 30 min before measuring absorbance at 515 nm against a methanol blank. Extracts were tested within a concentration range (e.g. , 0.25–2.00 mg/L) established through preliminary trials to produce a broad inhibition spectrum (10–90%) while maintaining proportionality between concentration and response in the central region of the curve. Preliminary tests confirmed the linearity of the absorbance decrease with inhibitor concentration within this range, ensuring the assay was performed under optimized conditions. Percentage inhibition was calculated in Eq. 1.
Ferric Reducing Antioxidant Power (FRAP) Activity
The ferric reducing power was evaluated following the method of Jack et al. [8]. Briefly, 0.5 mL of test sample (extract or vitamin C) was mixed with 0.5 mL of phosphate buffer (0.2 M, pH 6.6) and 0.5 mL of potassium ferricyanide (1%). The mixture was incubated at 50 °C for 20 min, then 0.5 mL of trichloroacetic acid (10%) was added, and the mixture was centrifuged at 3000 rpm for 10 min. A 0.5 mL aliquot of the supernatant was mixed with 0.5 mL of distilled water and 0.1 mL of FeCl3 (0.1%). Absorbance readings were taken at 700 nm after allowing it to sit for 10 min at room temperature. Test samples were analyzed across a concentration range determined through preliminary experiments that ensured a consistent increase in absorbance within a 10–90% response window and to remain within the linear dynamic range of the spectrophotometer, with adequate signal-to-noise for reliable detection at all tested levels. Preliminary tests confirmed the linearity of the absorbance increase with concentration within this range, ensuring the assay was performed under optimized conditions.
Statistical Analysis and IC50 estimation
All experiments were conducted in triplicate (n = 3), with data presented as mean ± standard deviation (SD). For antioxidant assays, concentration–response data were analyzed using a four-parameter logistic (4PL) model in GraphPad Prism version 10 (GraphPad Software, San Diego, CA, USA) as shown in Eq. 2.
Eq. 2 | Y = percentage inhibition, X = log10 concentration, Bottom and Top = the lower and upper asymptotes, HillSlope = curve steepness.
Model fit quality was assessed using the coefficient of determination (R²) and visual inspection of residual plots to verify the appropriateness of the sigmoidal model. IC50 values were reported with their 95% confidence intervals derived from the nonlinear regression, and comparisons between extracts and vitamin C were based on non-overlapping confidence intervals. Where necessary, data were log-transformed to satisfy model assumptions of homoscedasticity IC50 values are reported as estimates with their corresponding 95% confidence intervals (95% Cl) derived from the nonlinear regression, comparisons between extracts and vitamin C were based on non-overlapping confidence intervals. Where necessary, data were log-transformed to satisfy model assumptions of homoscedasticity and improve symmetry of residuals. Nonlinear regression analyses used constraints, and well-fitted models were used for comparison.
Result and Discussion
This study analyzed the qualitative and quantitative phytochemical components of Sorghum bicolor leaves using complementary analytical approaches to provide an integrated chemical profile of the extracts. The biological activities of the n-hexane and methanol extracts were also evaluated, with particular emphasis on their in vitro antioxidant potential as determined by multiple radical scavenging and reducing power assays. Differences in extraction yield, phytochemical composition, and antioxidant responses between the non-polar and polar fractions were examined to elucidate the influence of solvent polarity on chemical composition and functional activity. The results of these analyses are presented in Table 1 to 10 and Figure 1 to 8, which collectively summarize the phytochemical characteristics and antioxidant performance of the extracts in comparison with the reference antioxidant.
| Extract | Crude mass (g) | % Yield (w/w) |
|---|---|---|
| n-Hexane fraction | 8.5 | 1.7% |
| Methanol fraction | 62.5 | 12.5% |
Extraction Yields and Preliminary Phytochemistry
The extraction of Sorghum bicolor leaves yielded two distinct fractions: a small amount of n-hexane extract (8.5 g; 1.7% w/w) and a significantly larger methanolic fraction (62.5 g; 12.5% w/w) from 500 g of dried leaves powder. The low yield from n-hexane indicates that the leaves contain minimal waxes or other lipophilic constituents, consistent with reports of generally low non-polar fractions in leaves matrices (8). Conversely, the methanolic fraction comprised most of the extractable material, aligning with the 10-15% range commonly seen for polar extracts of cereal leaves. Qualitative phytochemical screening confirmed this polarity-based separation: flavonoids and saponins were detected only in the methanol extract, while alkaloids and terpenoids were present in both (Table 2).
| Phytochemicals | n-Hexane Extract | Methanol Extract |
|---|---|---|
| Saponin | - | + |
| Flavonoids | - | + |
| Tannins | - | - |
| Alkaloids | + | + |
| Cardiac Glycoside | + | + |
| Terpenoids | + | + |
| Note: Key: + Present - Not present | ||
GC –MS Characterization of Bioactive Compounds
Gas chromatography–mass spectrometry (GC–MS) analysis of the n-hexane extract from Sorghum bicolor leaves showed a mainly lipophilic chemical profile, identifying nine major chromatographic peaks through matching with NIST14 library (Figure 1; Table 3). These components collectively represented about 94.65% of the total relative peak area. However, this figure should be considered as semi-quantitative due to the inherent variability in response-factors in GC-MS and the application of area normalization without individual response-factor correction (13). The identified compounds were broadly categorized into fatty alcohols (46.22%), fatty acid esters (28.83%), fatty acyl derivatives (20.28%), and trace levels of free fatty acids based on spectral similarity and chemical functionality. The extract was primarily characterized by peaks tentatively identified as (Z)-2-octadecen-1-ol (46.14%), 9-octadecenoic acid (Z)-, 2-hydroxy-1-(hydroxymethyl) ethyl ester (28.72%), and 9, 12-octadecadienoyl chloride (Z, Z) (20.28%). Major constituents exhibited fair-to-good library match scores (78-90), which supports provisional structural assignments; however, without authentic reference standards, all identifications remain tentative. Minor components with match scores below 70 should be interpreted with increased caution.
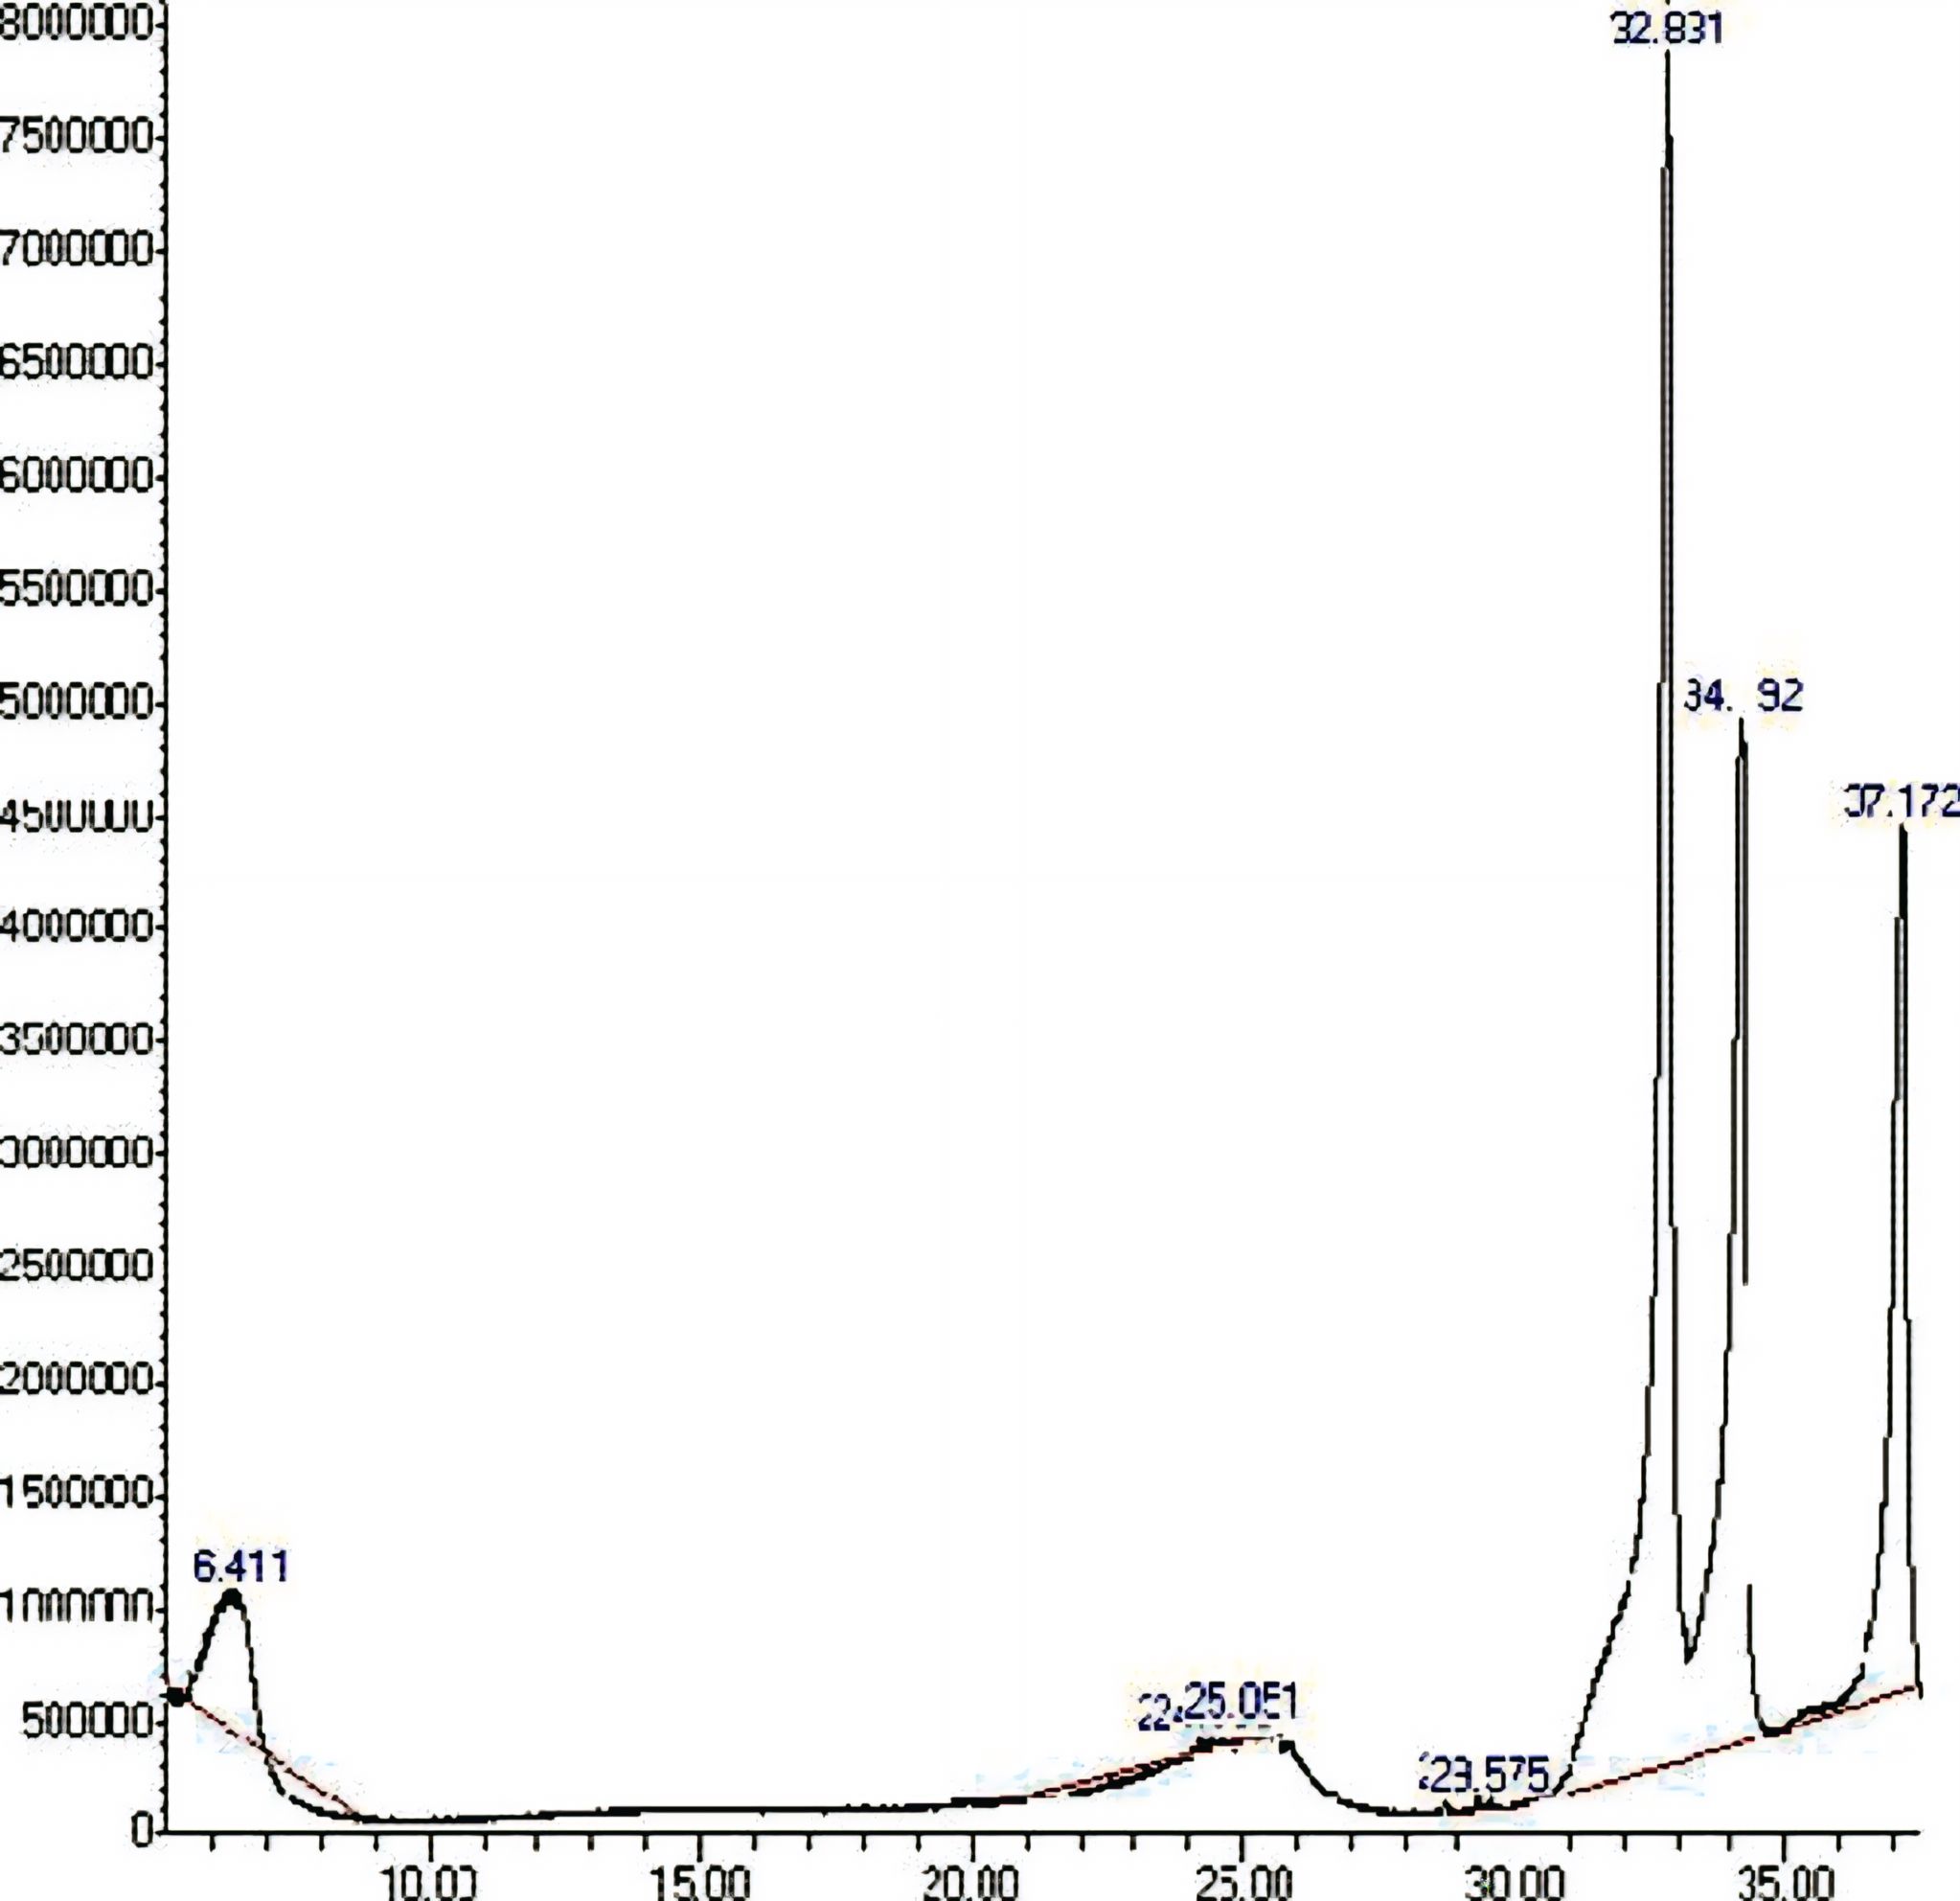
| S. NO | Name of Compound | RT (retention time) | Peak area (%) | Molecular formula | Molecular weight | Class of Compound |
|---|---|---|---|---|---|---|
| 1 | 1-Tridecene | 6.14 | 0.411 | C₁₃H₂₆ | 182.35 | Alkene (Long-chain Hydrocarbon) |
| 2 | Oleic Acid | 24.154 | -1.64* | C₁₈H₃₄O₂ | 282.46 | Fatty Acid (Monounsaturated) |
| 3 | 9-Octadecenoic acid | 24.389 | 0.07 | C₁₈H₃₄O₂ | 282.46 | Fatty Acid (Monounsaturated) |
| 4 | Oleic Acid | 25.051 | 0.11 | C₁₈H₃₄O₂ | 282.46 | Fatty Acid (Monounsaturated) |
| 5 | trans-13-Octadecenoic acid, methyl ester | 29.366 | 0.11 | C₁₉H₃₆O₂ | 296.49 | Fatty Acid Ester |
| 6 | Phytol | 29.575 | 0.08 | C₂₀H₄₀O | 296.53 | Diterpene Alcohol |
| 7 | Z-2-Octadecen-1-ol | 32.831 | 46.14 | C₁₈H₃₆O | 268.48 | Fatty Alcohol (Monounsaturated) |
| 8 | 9-Octadecenoic acid (Z)-, 2-hydroxy-1-(hydroxymethyl)ethyl ester | 34.192 | 28.72 | C₂₁H₄₀O₄ | 356.54 | Fatty Acid Ester (Glycerol Derivative) |
| 9 | 9, 12-Octadecadienoyl chloride, (Z, Z)- | 37.172 | 20.28 | C₁₈H₃₁ClO | 298.89 | Fatty Acyl Chloride |
The lipid profile of the n-hexane leaves extract differs significantly contrasts with reported compositions of Sorghum seed oils, which are typically enriched in storage lipids such as oleic and linoleic acids (14). In comparison, the leaves extract was characterized by long-chain alcohols and esterified fatty acids, with comparatively low levels of free fatty acids. This difference aligns with tissue-specific lipid metabolism since leaves lipids are primarily structural and protective, associated with cuticular waxes, surface coatings, and membrane assemblies, rather than serving as energy storage (14).
The prevalence of (Z)-2-octadecen-1-ol indicates that long-chain fatty alcohols makes up a substantial portion of the non-polar leaves metabolome. These compounds are well-known constituents of plant cuticular waxes, contributing to hydrophobic barrier formation, transpiration regulation, and resistance to abiotic stress according to reports suggesting that leaves cuticles are enriched in very-long-chain alcohols and esters that form the primary barrier against non-stomatal water-loss (15). While some plant systems have linked fatty alcohols to antimicrobial properties, any specific functional role of for S. bicolor leaves remains speculative and cannot be definitively concluded based solely on GC-MS profiling.
Phytol was detected at low relative abundance (0.08%) but is significant due to its biochemical importance. As a diterpene alcohol derived from chlorophyll degradation, phytol act as a biosynthetic precursor for tocopherols and phylloquinone and has been reported to exhibit antioxidant and anti-inflammatory activities (16). Nevertheless, due to its very low concentration in this extract, phytol is better viewed as a biochemical marker for chlorophyll turnover rather than as a key contributor to the overall chemical or biological profile.
The detection of 9, 12-octadecadienoyl chloride requires careful consideration. Fatty acyl chlorides are rarely documented as native plant metabolites; they may result from thermal rearrangements or column-induced reactions, or could reflect misassignment of during GC–MS analysis involving closely related fatty acid derivatives. Therefore, this peak should be regarded as a potential acyl derivative until confirmed by complementary methods. Additional fatty acid esters and minor hydrocarbons such as 1-tridecene, were present at low levels; these may indicate secondary lipid metabolism or trace volatile components but given their low intensities and moderate match scoresthey should be described without linking them to specific biological functions unless further evidence is provided.
The GC–MS analysis of the methanolic extract of Sorghum bicolor showed a chemically diverse mixture with fifteen constituents tentatively identified, including fatty acids, fatty alcohols, esters, and some minor high-molecular-weight aromatic derivatives (Figure 2; Table 4). The assignment of these compounds relied on matching with the NIST14 spectral library and should be considered in light of varying match quality. The Primary constituents displayed moderate to good similarity indices (60-86), while several low-abundance peaks had poor spectral matches (< 50) and are thus regarded as tentative identifications that require further validation (13).
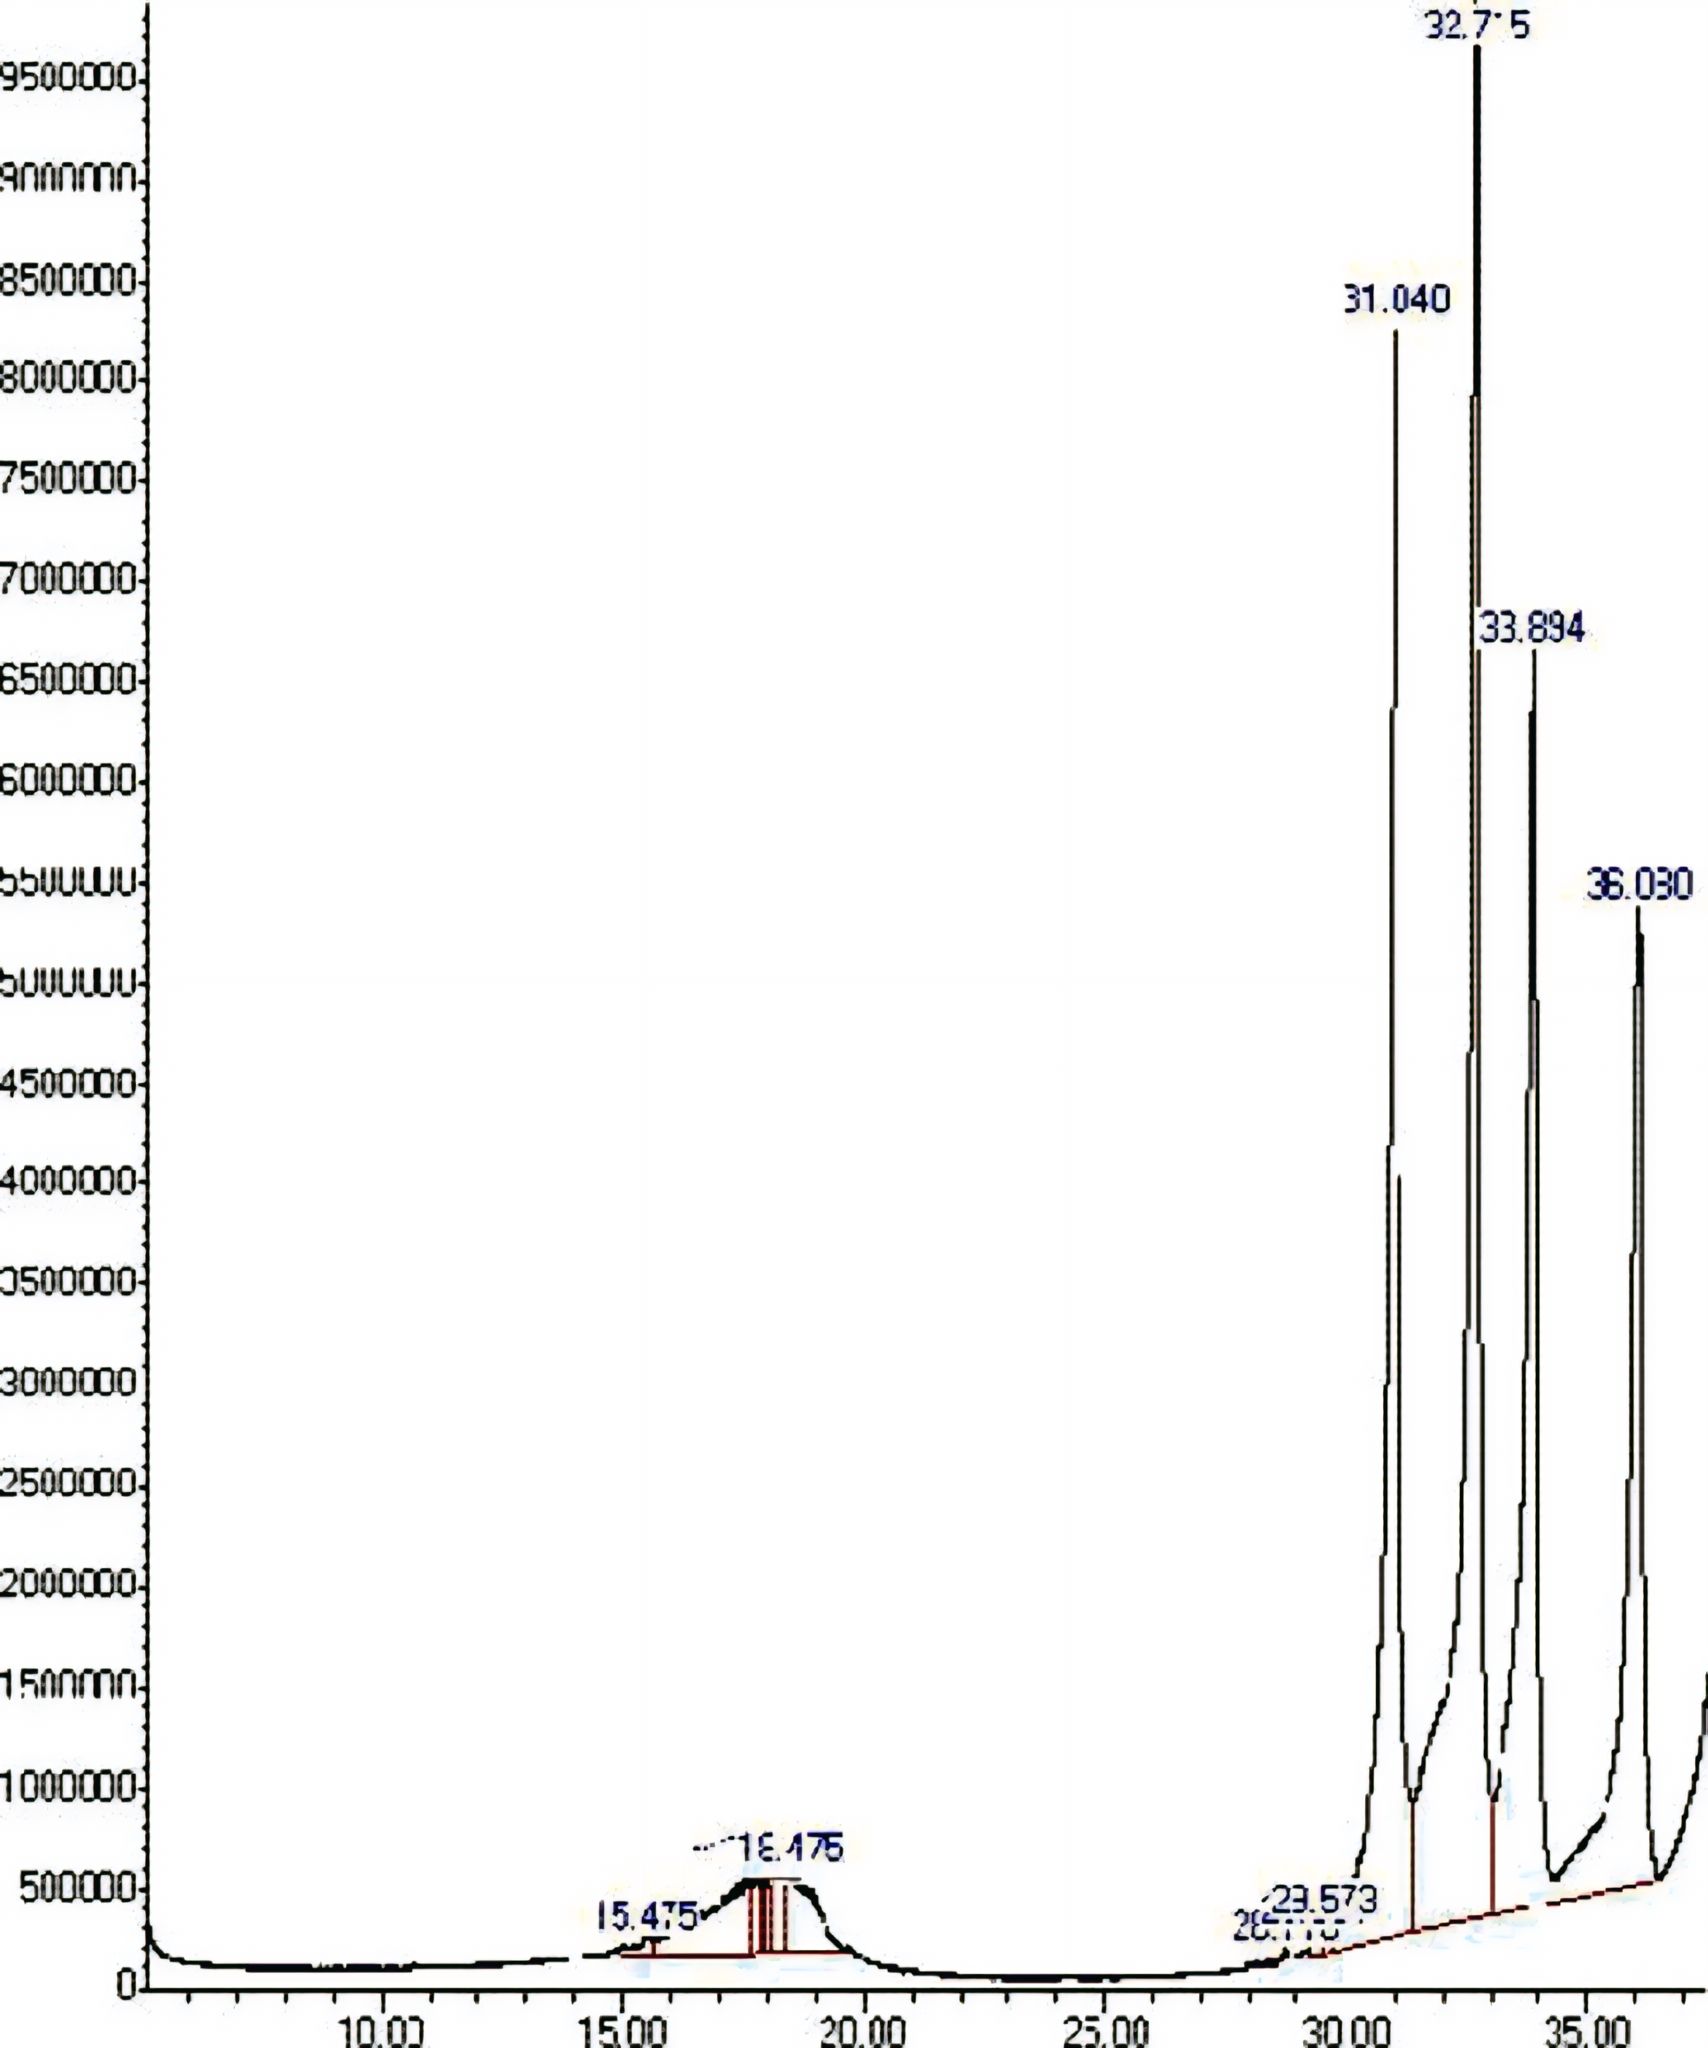
| S. NO | Name of Compound | RT (retention time) | Peak area (%) | Molecular formula | Molecular weight | Class of Compound |
|---|---|---|---|---|---|---|
| 1 | 3, 11-Tetradecadien-1-ol | 15.475 | 0.39 | C₁₄H₂₆O | 210.36 | Fatty Alcohol (Aliphatic Alcohol) |
| 2 | 1, 1-Dodecanediol, diacetate | 17.572 | 3.69 | C₁₆H₃₀O₄ | 286.41 | Ester (Acetate Ester of Diol) |
| 3 | 2-Piperidinone, N-[4-bromo-n-butyl]- | 17.717 | 0.64 | C₉H₁₇BrNO | 234.14 | Alkaloid (Piperidine Derivative) |
| 4 | Kaempferol oleate | 17.888 | 0.28 | C₃₃H₄₄O₇ | 564.70 | Flavonoid Fatty Acid Ester |
| 5 | Myricetin palmitate | 18.001 | 0.38 | C₃₁H₄₂O₈ | 554.66 | Flavonoid Fatty Acid Ester |
| 6 | Epicatechin laurate | 18.051 | 0.35 | C₂₇H₃₆O₇ | 472.57 | Flavonoid Fatty Acid Ester |
| 7 | Diosmetin oleate | 18.306 | 0.85 | C₃₄H₄₆O₇ | 578.73 | Flavonoid Fatty Acid Ester |
| 8 | 9, 12-Octadecadienal | 18.475 | 2.50 | C₁₈H₃₂O | 264.45 | Fatty Aldehyde (Polyunsaturated) |
| 9 | E, E-10, 12-Hexadecadien-1-ol acetate | 28.718 | 0.09 | C₁₈H₃₂O₂ | 280.45 | Fatty Alcohol Acetate (Ester) |
| 10 | 5-Eicosene, (E)- | 29.364 | 0.22 | C₂₀H₄₀ | 280.53 | Alkene (Long-chain Hydrocarbon) |
| 11 | Cycloeicosane | 29.573 | 0.21 | C₂₀H₄₀ | 280.53 | Cycloalkane (Saturated Hydrocarbon) |
| 12 | cis-13-Octadecenoic acid | 31.040 | 23.70 | C₁₈H₃₄O₂ | 282.46 | Fatty Acid (Monounsaturated) |
| 13 | 1, 3-Propanediol, 2-dodecyl | 32.715 | 30.52 | C₁₅H₃₂O₂ | 244.42 | Fatty Alcohol Derivative (Diol) |
| 14 | E-2-Octadecadecen-1-ol | 33.894 | 19.35 | C₁₈H₃₆O | 268.48 | Fatty Alcohol (Monounsaturated) |
| 15 | 9-Octadecenoic acid (Z)-, 2-hydroxy-1-(hydroxymethyl)ethylester | 36.080 | 16.83 | C₂₁H₄₀O₄ | 356.54 | Fatty Acid Ester (Glycerol Derivative) |
Fatty acids and their derivatives made up the majority of the chromatographic profile. Key assignments included cis-13-octadecenoic acid (23.70%, quality score 84) and 9-octadecenoic acid (Z)-, 2-hydroxy-1-(hydroxymethyl) ethyl ester (16.83%, quality score 87). The dominance of monounsaturated C₁₈ lipid species aligns with the known lipid composition found in cereal leaves, which may indicate partial co-extraction of membrane-associated components during methanolic extraction (18). Although octadecenoic acid derivatives have been linked to anti-inflammatory and redox-modulating activities in other plant systems (19), such functional attributions here remain speculative and cannot be conclusively drawn from GC–MS data alone. A few low-intensity peaks were tentatively identified as flavonoid–fatty acid conjugates, suggesting structures resembling kaempferol oleate, myricetin palmitate, epicatechin laurate, and diosmetin oleate (combined abundance 1.86%). These identifications carry a high degree of uncertainty. Flavonoids are non-volatile, thermally unstable polyphenols that cannot be reliably characterized by GC–MS without prior derivatization (20). The low similarity indices (< 50) along with the trace abundance of these peaks strongly indicate possible library misassignments or the detection of thermal degradation products instead of intact flavonoid esters. Therefore, these signals should be viewed as indirect indicators of potential polyphenol–lipid interactions that warrant confirmation through LC–MS or NMR-based methods (21). Additional minor components, including 1, 1-dodecanediol diacetate (3.69%) and 9, 12-octadecadienal (2.50%), were detected with low spectral confidence (quality score ~25). While aldehydic lipid derivatives have been associated with plant stress signaling and oxidative pathways (18), the low match quality and potential for co-elution or artefact formation limits any definitive structural or functional conclusions.
Concentration-Dependent Antioxidant Activity of Sorghum bicolor Extracts
The findings presented in Figure 3 and Table 5 show that both the methanol extract and vitamin C demonstrated a clear dose-dependent increase in DPPH radical scavenging activity, while the n-hexane extract exhibited an inconsistent pattern. The methanol extract increased progressively from 31.00 ± 0.010 % at 0.25 mg/L to 44.00 ± 0.020 % at 2.00 mg/L, which supports a previous studies indicating that polar solvents like methanol are more effective at extracting phenolic compounds and flavonoids that significantly contribute to antioxidant activity (22, 23). This trend is similar to that of vitamin C, the positive control, which showed the highest activity overall activity and a strong correlation coefficient (R² = 0.8953), reinforcing its established role as a potent water-soluble antioxidant (23).
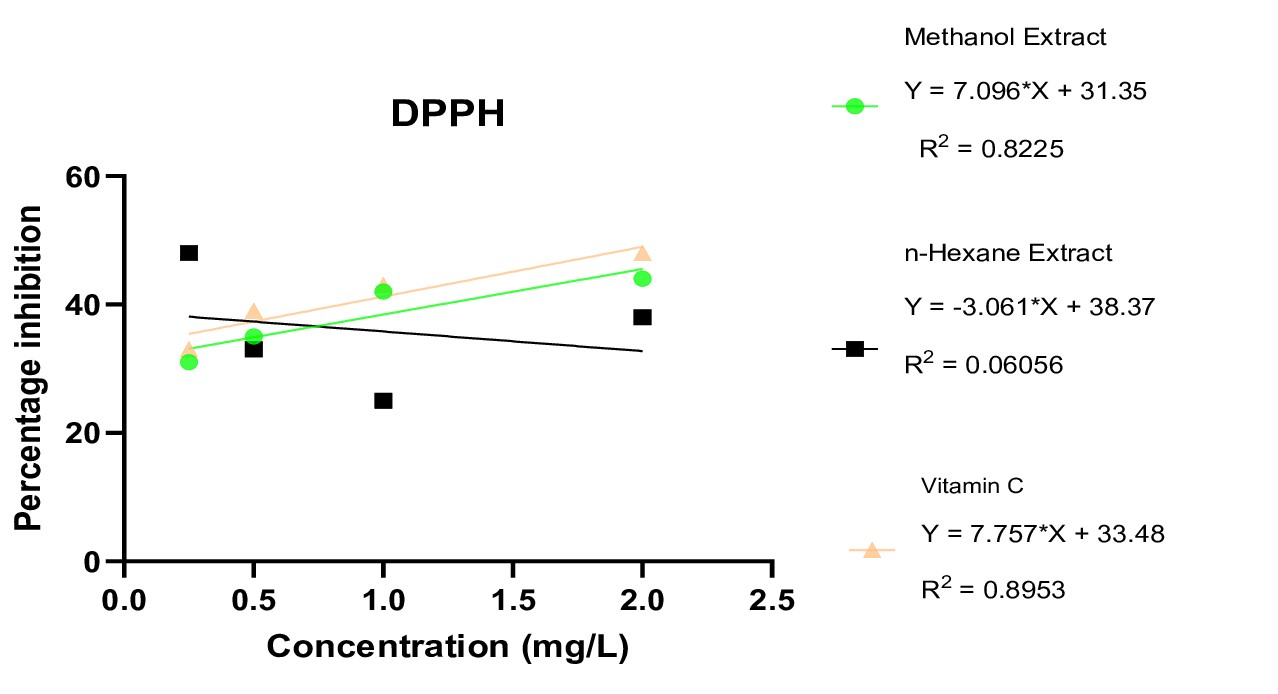
| Concentration (mg/L) | Methanol Extract | n-Hexane Extract | Vitamin C |
|---|---|---|---|
| 0.25 | 31.00 ± 0.010 | 48.00 ± 0.090 | 33.00 ± 0.007 |
| 0.50 | 35.00 ± 0.006 | 33.00 ± 0.011 | 39.00 ± 0.020 |
| 1.00 | 42.00 ± 0.010 | 25.00 ± 0.040 | 43.00 ± 0.005 |
| 2.00 | 44.00 ± 0.020 | 38.00 ± 0.090 | 48.00 ± 0.007 |
The consistent high performance of vitamin C confirms the reliability of the assay methodology and bolsters confidence in the results obtained from the methanol extract. Comparable observations have been reported for Sorghum bicolor leaves and other plant materials rich in phenolic, where methanol extracts consistently outperform non-polar extracts in DPPH assays due to the efficient solubilization of hydrophilic antioxidant constituents (24).
In contrast, the n-hexane extract exhibited a non-linear response, with relatively high activity at low concentration (48.00 ± 0.090 % at 0.25 mg/L) followed by a decline to 25.00 ± 0.040 % at 1.00 mg/L and partial recovery at the highest concentration. This trend, coupled with its lower correlation coefficient (R² = 0.6056), suggests that the non-polar components extracted by n-hexane possess limited radical scavenging capacity or are less compatible with the DPPH assay medium. Previous studies have similarly reported that non-polar extracts from plant leaves often yield weaker antioxidant activity due to the predominance of lipophilic compounds, which may have different mechanisms of antioxidant action not effectively detected in the DPPH system (24).
The DPPH radical scavenging assay (515 nm) demonstrated a clear concentration-dependent antioxidant response for the methanol extract, n-hexane extract, and vitamin C within the tested range of 0.25–2.00 mg/L (Figure 4; Table 6). Among the samples, vitamin C exhibited the most consistent and predictable scavenging behaviour, reflected by a high goodness of fit (R² = 0.989), a shallow Hill slope (0.50), and a low IC₅₀ value of 0.137 mg/L. Inhibition increased steadily from 0.039% to 50.18%, in agreement with extensive literature describing ascorbic acid as an efficient hydrogen atom donor in DPPH-based assays (25).
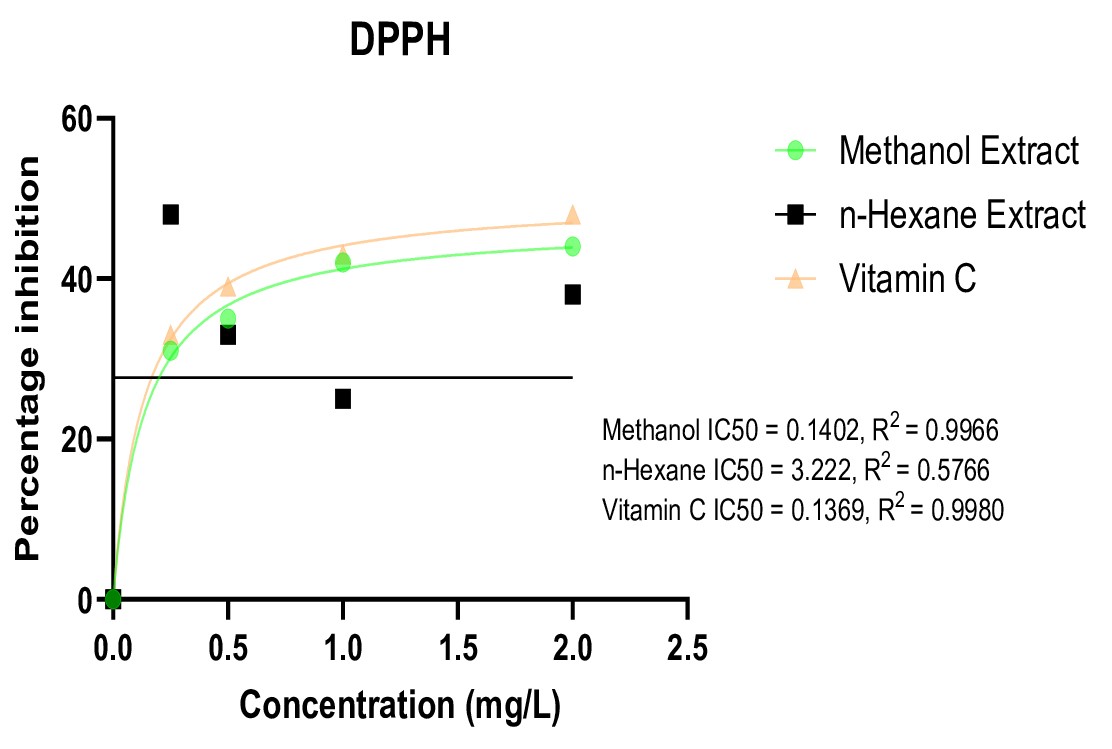
| Extract | Bottom (%) | Top (%) | IC50 (mg/L) | Hill Slope | R² | Curve Type |
|---|---|---|---|---|---|---|
| Methanol Extract | 44.99 | 0.0436 | 0.1402 | -3.36 | 0.996 | Very Steep Sigmoidal |
| n-Hexane Extract | 27.65 | 4.981 | 3.222* | -5.00 | 0.5766 | extremely steep |
| Vitamin C | 50.18 | 0.039 | 0.137 | -0.50 | 0.989 | Gentle slope |
The methanol extract displayed comparable antioxidant potency, with a similarly low IC₅₀ (0.1402 mg/L) and an excellent model fit (R² = 0.996). However, its markedly steeper sigmoidal response (Hill slope = 3.36) indicates a more cooperative or threshold-dependent scavenging behaviour relative to vitamin C. Inhibition increased from 0.0436% at the lower asymptote to 44.99% at the upper asymptote, consistent with extracts rich in phenolic compounds that exhibit rapid radical quenching once a critical concentration is reached (26). Within the constraints of this chemical assay, these results strongly suggest that polar phenolic constituents, such as free flavonoid aglycones and other hydrophilic antioxidants, are the principal contributors to the DPPH scavenging activity of the methanol extract, in line with previous reports on solvent polarity and phenolic extraction efficiency (22).
In contrast, the n-hexane extract exhibited substantially weaker antioxidant performance, characterized by a low model fit (R² = 0.5766) and an extremely steep Hill slope (5.00). The poor model fit and biphasic response pattern indicate that the standard dose-response model is inappropriate for this sample. Therefore, the calculated IC₅₀ value (3.222 mg/L) is statistically unreliable and should not be compared directly with IC₅₀ values derived from well-fitted curves. Consistent trends were observed in the FRAP assay. The methanol extract demonstrated a linear relationship between concentration and ferric reducing activity.Figure 5 and Table 7 present the hydrogen radical inhibitory activity (HRIA) of Sorghum bicolor leaves extracts, highlighting clear differences between the polar (methanol) and non-polar (n-hexane) fractions, with vitamin C included as a positive control. The methanol extract exhibited a pronounced concentration-dependent increase in inhibition, rising from 28.00 ± 0.040% at 0.25 mg/L to 43.00 ± 0.040% at 2.00 mg/L. This response was supported by an excellent linear correlation (R² = 0.9780) and a steep slope (8.174), indicative of strong hydrogen radical scavenging efficiency. Within the limitations of this chemical assay, the observed activity is consistent with the presence of polar phenolic and flavonoid constituents, which are well known for their hydrogen-donating capacity (27).
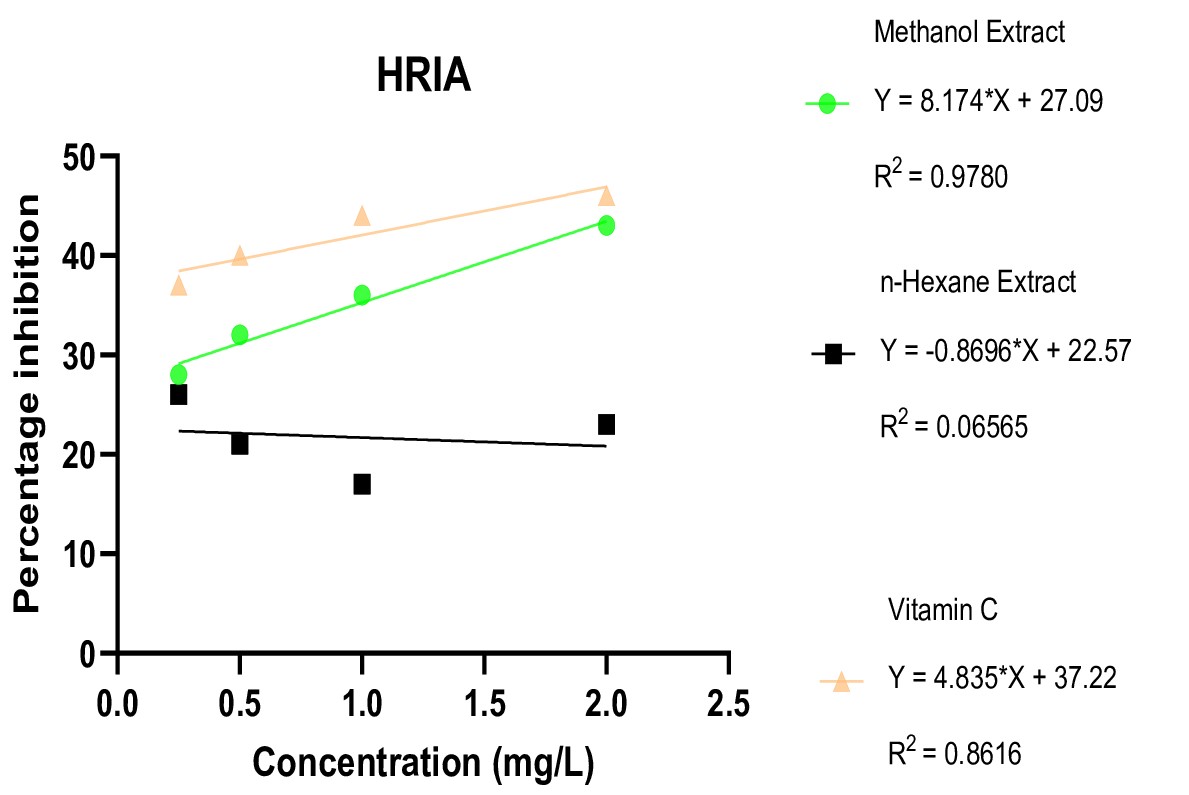
| Concentration (mg/L) | Methanol Extract | n-Hexane Extract | Vitamin C |
|---|---|---|---|
| 0.25 | 28.00 ± 0.040 | 26.00 ± 0.070 | 37.00 ± 0.005 |
| 0.50 | 32.00 ± 0.002 | 21.00 ± 0.032 | 40.00 ± 0.021 |
| 1.00 | 36.00 ± 0.030 | 17.00 ± 0.010 | 44.00 ± 0.015 |
| 2.00 | 43.00 ± 0.040 | 23.00 ±0.060 | 46.00 ± 0.005 |
Vitamin C consistently produced the highest HRIA values across the tested concentration range, increasing from 37.00 ± 0.005% to 46.00 ± 0.005%, with a moderate linear fit (R² = 0.8616) and a slope of 4.835. Its reproducible and concentration-responsive behaviour confirms the validity and sensitivity of the assay under the experimental conditions employed (28).
In contrast, the n-hexane extract demonstrated weak and irregular HRIA, with inhibition values fluctuating from 26.00 ± 0.070% at 0.25 mg/L to 23.00 ± 0.060% at 2.00 mg/L. The absence of a monotonic trend, together with a negligible coefficient of determination (R² = 0.06565) and a negative slope, indicates that a simple dose–response relationship is not applicable to this fraction. These findings suggest that non-polar constituents extracted by n-hexane contribute minimally to hydrogen radical scavenging and may exert inconsistent or assay-interfering effects rather than true antioxidant activity (29).
Collectively, the HRIA results reinforce the conclusion that the principal antioxidant constituents of Sorghum bicolor leaves are predominantly polar, with methanol-soluble compounds exhibiting activity that approaches, but does not mechanistically replicate, that of vitamin C. Importantly, the apparent numerical similarity between the methanol extract and vitamin C is based on mass-based concentrations; equimolar comparisons and kinetic parameters were not controlled in the present study. Consequently, the methanol extract cannot be regarded as functionally equivalent to vitamin C, and its antioxidant behaviour should be interpreted as a composite effect of multiple phenolic constituents rather than a single, well-defined redox mechanism.
Figure 6 and Table 8 summarise the dose–response parameters, revealing distinct antioxidant behaviours among the tested samples. Both the methanol extract and vitamin C exhibited Hill slopes close to unity (≈1.0), consistent with classical sigmoidal dose-response curves and non-cooperative radical scavenging behaviour. Such slopes are characteristic of systems in which individual antioxidant molecules act independently, without evidence of synergistic or antagonistic interactions within the tested concentration range.
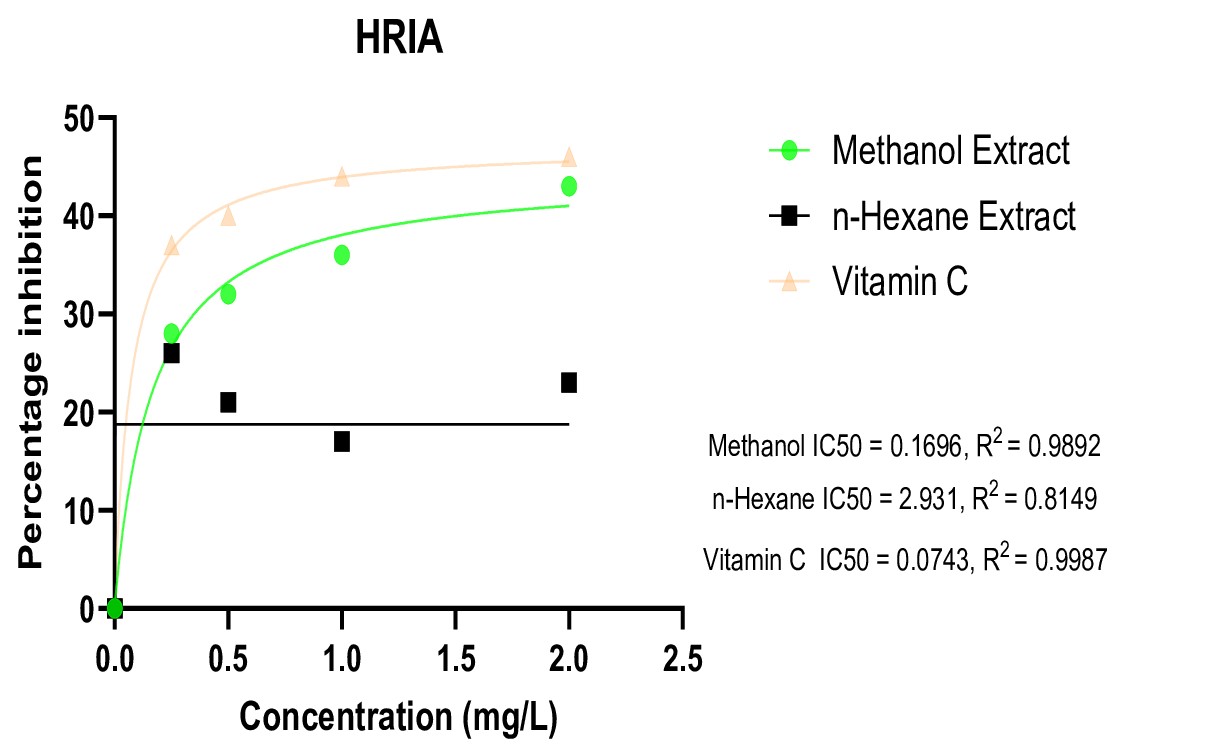
| Extract | Bottom (%) | Top (%) | IC50 (mg/L) | Hill Slope | R² | Curve Type |
|---|---|---|---|---|---|---|
| Methanol Extract | 0.1249 | 44.49 | 0.169 | 1.00 | 0.9892 | Sigmoidal (Standard) |
| n-Hexane Extract | -1.315 | 18.78 | 2.931 | 0.100 | 0.8149 | Sigmoidal (shallow) |
| Vitamin C | 0.0135 | 47.21 | 0.074 | 1.00 | 0.9987 | Sigmoidal (Standard) |
In contrast, the n-hexane extract displayed an extremely shallow Hill slope (0.10), indicative of a poorly defined dose–response relationship. Rather than reflecting true negative cooperativity, this behaviour is more plausibly attributed to the chemically heterogeneous nature of the extract, comprising multiple lipophilic constituents with differing and generally weak antioxidant capacities. Accordingly, extreme Hill slope values observed for the n-hexane fraction, whether very steep or very shallow, are best interpreted as descriptors of non-ideal assay performanc]and mixture effects, underscoring the limitations of applying a standard Hill model to complex, non-polar extracts.
Potency analysis further distinguishes the samples, with vitamin C exhibiting the strongest activity (IC₅₀ = 0.074 mg/L), followed by the methanol extract (IC₅₀ = 0.170 mg/L). In contrast, the n-hexane extract was markedly less potent (IC₅₀ = 2.93 mg/L), requiring approximately 17-fold higher concentration than the methanol extract to achieve comparable inhibition. Maximum inhibition values support this ranking: vitamin C (47.2%) and the methanol extract (44.5%) achieved similar upper plateaus, whereas the n-hexane extract reached only 18.8% inhibition and exhibited indications of irregular or potentially pro-oxidant behaviour at low concentrations.
These potency comparisons should, however, be interpreted in the context of curve quality. IC₅₀ values derived for vitamin C and the methanol extract are supported by high goodness-of-fit values and well-behaved sigmoidal responses, whereas those calculated for the n-hexane extract are inherently less reliable due to shallow, irregular curves and should therefore be regarded as approximate. Furthermore, because concentrations were expressed on a mass basis, comparisons with vitamin C provide qualitative insight into relative antioxidant performance under identical assay conditions rather than strict equimolar or kinetic equivalence.
The reducing power assay revealed pronounced solvent-dependent differences in the antioxidant behaviour of Sorghum bicolor leaves extracts (Figure 7; Table 9). The methanol extract exhibited a clear concentration-dependent increase in reducing capacity, rising from 31.00 ± 0.040 at 0.25 mg/L to a plateau of 48.00 ± 0.003 at 1.00–2.00 mg/L. The attainment of a plateau at higher concentrations suggests saturation of the extractable electron-donating constituents under the assay conditions, a pattern commonly observed for phenolic-rich extracts (27).
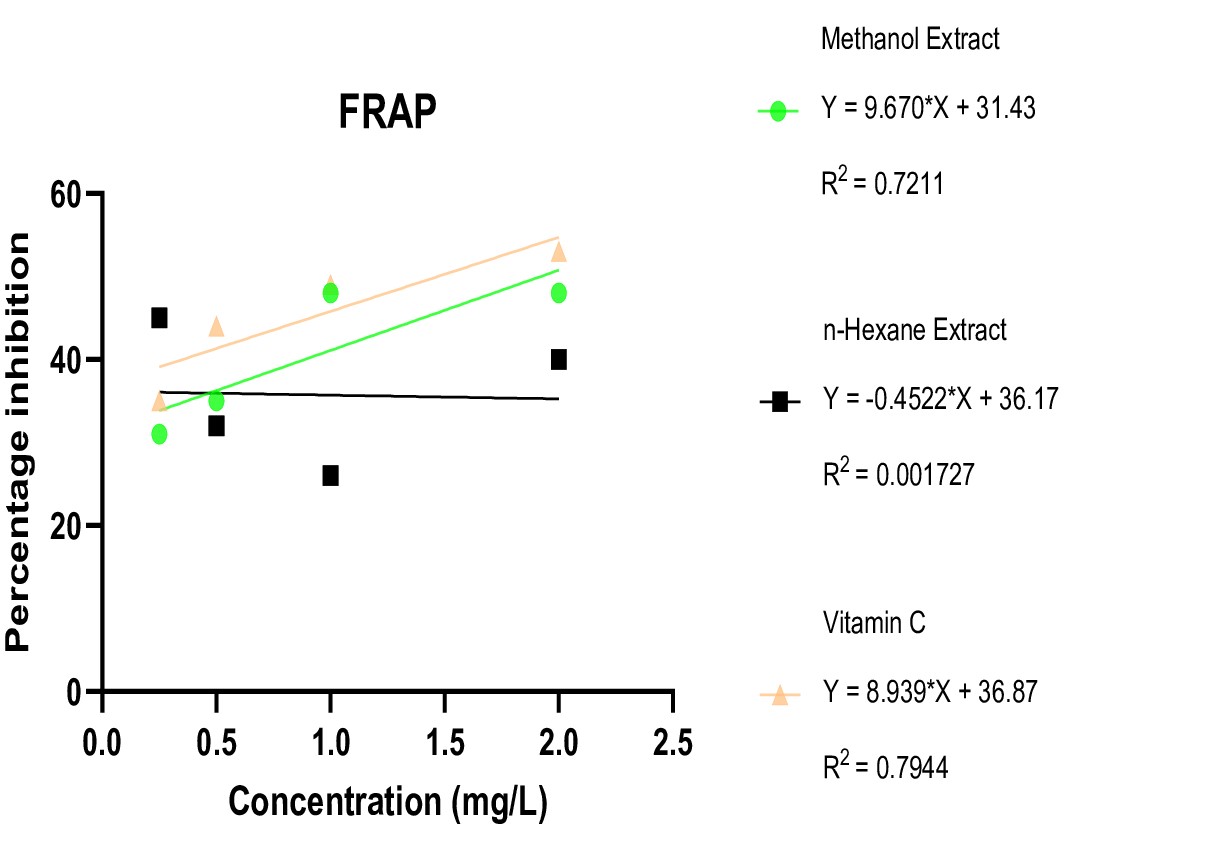
| Concentration (mg/L) | Methanol Extract | n-Hexane Extract | Vitamin C |
|---|---|---|---|
| 0.25 | 31.00 ± 0.040 | 45.00 ± 0.020 | 35.00 ± 0.001 |
| 0.50 | 35.00 ± 0.020 | 32.00 ± 0.000 | 44.00 ± 0.003 |
| 1.00 | 48.00 ± 0.030 | 26.00 ± 0.006 | 49.00 ± 0.005 |
| 2.00 | 48.00 ± 0.003 | 40.00 ± 0.030 | 53.00 ± 0.010 |
In contrast, the n-hexane extract displayed a non-monotonic and irregular response, with relatively high apparent reducing power at the lowest concentration (45.00 ± 0.020 at 0.25 mg/L), a sharp decline at 1.00 mg/L (26.00 ± 0.006), and partial recovery at 2.00 mg/L (40.00 ± 0.030). Such behaviour is inconsistent with a true dose-dependent redox response and more likely reflects assay interference arising from the poor aqueous solubility of non-polar constituents, as well as physical effects such as turbidity, aggregation, or phase separation (29). Consequently, the reducing power values for the n-hexane fraction should be interpreted qualitatively, and simple dose–response modelling is not appropriate for this extract.
Vitamin C showed a steady and predictable increase in reducing power (35.00 ± 0.001 to 53.00 ± 0.010), serving as a reliable positive control that confirms assay sensitivity and establishes an upper reference range for a well-characterised antioxidant. At higher concentrations, the methanol extract approached the reducing capacity of vitamin C, whereas the n-hexane extract generally underperformed, except at the lowest tested dose. Importantly, vitamin C is included here primarily to validate assay performance and provide contextual comparison, rather than to imply strict equimolar or mechanistic equivalence with the complex plant extracts.
Consistent trends were observed in the FRAP assay. The methanol extract demonstrated a reasonably strong linear relationship between concentration and ferric reducing capacity (R² = 0.7211), with activity increasing from approximately 30% to 50%, closely paralleling the behaviour of vitamin C (slope 9.670 versus 8.939). In contrast, the n-hexane extract showed no meaningful concentration dependence (R² = 0.001727) and a negative slope, further confirming its weak and inconsistent redox activity in aqueous electron-transfer assays. Taken together, the reducing power and FRAP results reinforce the conclusion that the antioxidant potential of Sorghum bicolor leaves resides predominantly in polar, methanol-soluble phytochemicals, most plausibly phenolics and flavonoids (22). Nevertheless, this conclusion is confined to the specific in-vitro redox assays employed (DPPH, HRIA, and FRAP) and should not be extrapolated directly to in-vivo biological efficacy. Non-polar constituents may still exert biologically relevant effects through alternative mechanisms, such as membrane interactions or signalling modulation, that are not captured by these chemical assays. The strong agreement across multiple assays, combined with low standard errors, underscores the reproducibility of the findings and highlights methanol as a more efficient solvent for extracting redox-active antioxidants from S. bicolor leaves.
The FRAP assay results (Figure 8; Table 10) clearly demonstrate solvent-dependent differences in the antioxidant capacity of Sorghum bicolor leaves extracts relative to vitamin C. The methanol extract exhibited strong ferric reducing ability, characterised by a steep and well-defined dose–response relationship (Hill slope = 6.67; R² = 0.9846), a low IC₅₀ value of 0.20 mg/L, and a high maximal response (Top = 54.16%). These parameters closely approximate those of vitamin C (IC₅₀ = 0.15 mg/L; Hill slope = 6.93; R² = 0.9998; Top = 57.0%), indicating that the methanol extract contains highly effective polar antioxidants. Within the constraints of this in-vitro redox assay, the similarity in both potency and maximal response suggests that methanol-soluble constituents, most plausibly phenolics and flavonoids, dominate the ferric reducing activity.
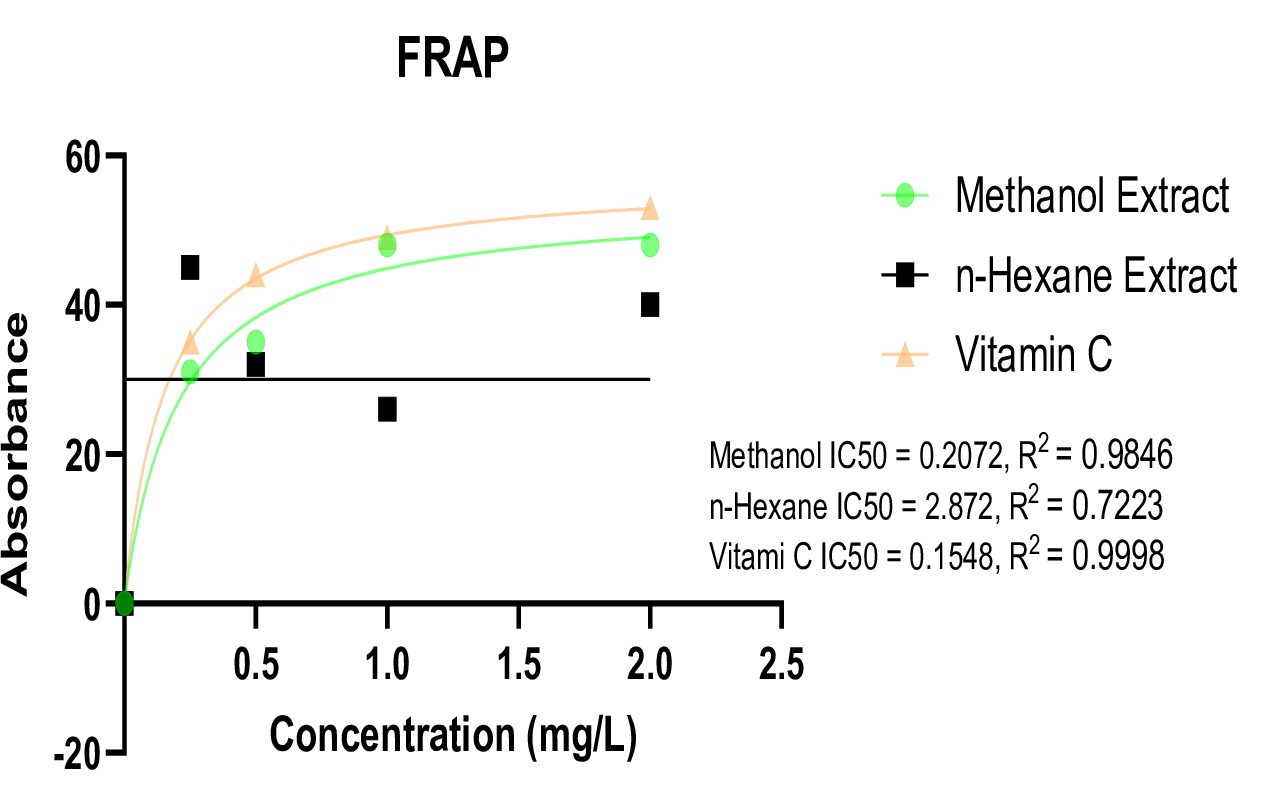
| Extract | Bottom (%) | Top (%) | IC50 (mg/L) | Hill Slope | R² | Curve Type |
|---|---|---|---|---|---|---|
| Methanol Extract | 0.075 | 54.16 | 0.20 | 6.67 | 09846 | Sigmoidal (Steep) |
| n-Hexane Extract | 1.81 | 30.0 | 2.87* | -1.67 | 0.7223 | Biphasic/Irregular |
| Vitamin C | -0.009 | 57.0 | 0.15 | 6.93 | 0.9998 | Sigmoidal (Steep) |
Importantly, the apparent similarity between the methanol extract and vitamin C reflects performance under identical mass-based assay conditions and should not be interpreted as evidence of equivalent molar antioxidant capacity or reaction kinetics. The extract represents a complex mixture of compounds whose combined redox behaviour differs fundamentally from that of a single, well-defined reference antioxidant.
In contrast, the n-hexane extract showed markedly weaker and irregular FRAP responses, with a substantially higher IC₅₀ (2.87 mg/L), a lower maximal response (Top = 30.0%), and a negative Hill slope (−1.67). The moderate goodness of fit (R² = 0.7223) and non-sigmoidal response pattern indicate that the standard Hill model does not adequately describe the behaviour of this fraction. Rather than reflecting meaningful negative cooperativity, the negative slope is more plausibly attributed to the chemically heterogeneous nature of the non-polar extract and potential assay interference from lipophilic constituents (29).
The dose–response curves (Figure 8) corroborate these interpretations: both the methanol extract and vitamin C display smooth, well-correlated sigmoidal trends, whereas the n-hexane extract exhibits shallow, scattered responses lacking clear concentration dependence. Collectively, these findings support the conservative conclusion that polar, methanol-soluble constituents are primarily responsible for the measurable in-vitro ferric reducing activity of S. bicolor leaves, while non-polar components contribute minimally and are poorly described by conventional dose–response modelling under the conditions employed (22).
Conclusion
The results indicate that the in vitro antioxidant responses of Sorghum bicolor leaves are predominantly associated with the polar, methanol-soluble fraction, which showed more consistent and better-modelled activity than the n-hexane extract across chemical assays. These findings reflect chemical redox capacity only and do not imply biological efficacy or health relevance. GC–MS analysis revealed solvent-dependent differences in detectable metabolites; however, compound assignments remain tentative, and antioxidant activity cannot be attributed to specific constituents or phytochemical classes. Variability in assay responses and limitations in mixture modelling further constrain mechanistic interpretation. Future studies should focus on definitive metabolite identification, isolation of active compounds, and validation in biologically relevant systems to establish meaningful structure–activity relationships.
Declarations
Conflict of Interest
The authors declare that they have no conflict of interest regarding the publication of this manuscript.
Data Availability
All data generated or analyzed during this study are included in this published article.
Ethics Statement
Ethical approval was not required for this study.
Funding Information
The author(s) declare that no financial support was received for the research, authorship, and/or publication of this article.
References
- Sies H, Jones DP. Reactive oxygen species (ROS) as pleiotropic physiological signalling agents. Nat Rev Mol Cell Biol. 2020;21:363-383.
- Tungmunnithum D, Thongboonyou A, Pholboon A, Yangsabai A. Flavonoids and other phenolic compounds from medicinal plants for pharmaceutical and medical aspects: an overview. Medicines. 2018;5(3):93.
- Pontieri P, Pepe G, Campiglia P, Merciai F, Basilicata MG, Smolensky D, Calcagnile M, Troisi J, Romano R, Del Giudice F, Aletta M, Guida M, Alifano P, Del Giudice L. Comparison of content in phenolic compounds and antioxidant capacity in grains of white, red, and black sorghum varieties grown in the Mediterranean area. ACS Food Sci Technol. 2021;1(6):1046-1054.
- Espitia-Hernández P, Chávez González ML, Ascacio-Valdés JA, Dávila-Medina D, Flores-Naveda A, Silva T, et al. Sorghum (Sorghum bicolor L.) as a potential source of bioactive substances and their biological properties. Crit Rev Food Sci Nutr. 2021;61(16):2658-2670.
- Xiong Y, Zhang P, Warner RD, Fang Z. Sorghum grain: From genotype, nutrition, and phenolic profile to its health benefits and food applications. Compr Rev Food Sci Food Saf. 2019;18(6):2025-2046.
- Pontieri P, Troisi J, Di Fiore R, Bean SR, Rooney LW, Del Giudice L. Mineral content and phenolic compounds in sorghum grains: A comparison between white and red varieties. Int Food Res J. 2013;20(5):2639-2644.
- Wu L, Huang Z, Qin P, Ren G. Effects of processing on phytochemical profiles and biological activities for production of sorghum tea. Food Res Int. 2014;53(2):678-685.
- Jack IR, Clark PD, Ndukwe GI. Evaluation of phytochemical, antimicrobial and antioxidant capacities of Pennisetum purpureum (Schumach) extracts. Chem Sci Int J. 2020;29(4):1-12.
- Olasehinde OR, Afolabi OB, Owolabi OV, Akawa AB, Omiyale OB. GC–MS analysis of phytochemical constituents of methanolic fraction of Annona muricata leaf and its inhibition against two key enzymes linked to type II diabetes. Sci Afr. 2022;16:e01178.
- Kumar A, Nirmal P, Kumar M, Jose A, Tomer V, Oz E, Proestos C, Zeng M, Elobeid T, K S, Oz F. Major phytochemicals: Recent advances in health benefits and extraction method. Molecules. 2023;28(2):887.
- Clark PD, Ekpekpo LD. Maceration-based extraction and spectroscopic characterisation of Sorghum bicolor leaves extract as a natural dye on cotton fabric. J Chem Soc Niger. 2025;50(4):775-786.
- Clark PD, Otutu JO, Asiagwu AK, Ndukwe GI. Exploring the potential of Dacryodes edulis leaf extract as natural colourant on polyamide fabrics: extraction, characterization and application. Substantia. 2024;8(2):103-118.
- Vinaixa M, Schymanski EL, Neumann S, Navarro M, Salex RM, Yanes O. Mass spectral databases for LC/MS- and GC/MS-based metabolomics: State of the field and future prospects. TrAC Trends Anal Chem. 2016;78:23-35.
- Lee S, Choi YM, Shin MJ, Yoon H, Wang X, Lee Y, Yi J, Jeon Y, Desta KT. Exploring the potentials of sorghum genotypes: A comprehensive study on nutritional qualities, functional metabolites, and antioxidant capacities. Front Nutr. 2023;10:1238729.
- Ikeh GO, Ani NI, Ude VU, Onyia JK, Diovu CC, Okpoto RC. Molecular spectroscopic (FTIR and UV-Vis) and hyphenated chromatographic (GC–MS) characterization of bioactive compounds present in different solvent fractions of extract of leaf of Cola hispida Brenan & Keay (Sterculiaceae). South Asian Res J Nat Prod. 2025;8(2):229-252.
- Doolabh K, Naidoo Y, Dewir YH, El-Hendawy S, Alshahrani TS, Mujib A. Phytochemical composition and potential antibacterial activity of the tropical spiderwort (Commelina benghalensis L.). Appl Ecol Environ Res. 2024;23(1):1257-1279.
- Lee SB, Suh MC. Cuticular wax biosynthesis is up-regulated by the MYB94 transcription factor in Arabidopsis. Plant Cell Physiol. 2015;56(1):48-60.
- Ouandaogo HS, Diallo S, Odari E, Kinyua J. Phytochemical screening and GC-MS analysis of methanolic and aqueous extracts of Ocimum kilimandscharicum leaves. ACS Omega. 2023;8(50):47560-47572.
- Revol-Cavalier J, Quaranta A, Newman JW, Brash AR, Hamberg M, Wheelock CE. The octadecanoids: Synthesis and bioactivity of 18-carbon oxygenated fatty acids in mammals, bacteria, and fungi. Chem Rev. 2025;125(1):1-90.
- Nolvachai Y, Marriott PJ. GC for flavonoids analysis: past, current, and prospective trends. J Sep Sci. 2013;36(1):20-36.
- Alseekh S, Aharoni A, Brotman Y, Contrepois K, D'Auria J, Ewald J, et al. Mass spectrometry-based metabolomics: a guide for annotation, quantification and best reporting practices. Nat Methods. 2021;18(7):747-756.
- Do QD, Angkawijaya AE, Tran-Nguyen PL, Huynh LH, Soetaredjo FE, Ismadji S, Ju YH. Effect of extraction solvent on total phenol content, total flavonoid content, and antioxidant activity of Limnophila aromatica. J Food Drug Anal. 2014;22(3):296-302.
- Baliyan S, Mukherjee R, Priyadarshini A, Vibhuti A, Gupta A, Pandey RP, Chang CM. Determination of antioxidants by DPPH radical scavenging activity and quantitative phytochemical analysis of Ficus religiosa. Molecules. 2022;27(4):1326.
- Ndukwe GI, Clark PD, Jack IR. In vitro antioxidant and antimicrobial potentials of three extracts of Amaranthus hybridus L. leaf and their phytochemicals. Eur Chem Bull. 2020;9(7):164-173.
- Munteanu IG, Apetrei C. Analytical methods used in determining antioxidant activity: a review. Int J Mol Sci. 2021;22(7):3380.
- Dawidowicz AL, Olszowy Tomczyk M. The importance of solvent type in estimating antioxidant activity of phenolic compounds by ABTS assay. Eur Food Res Technol. 2021;247(10):2509-2520.
- Platzer M, Kiese S, Herfellner T, Schweiggert Weisz U, Miesbauer O, Eisner P. How does the phenol structure influence the results of the Folin–Ciocalteu assay? Antioxidants. 2021;10(5):811.
- Munteanu IG, Apetrei C. Analytical methods used in determining antioxidant activity: a review. Int J Mol Sci. 2021;22(7):3380.
- Alam MN, Bristi NJ, Rafiquzzaman M. Review on in-vivo and in vitro methods evaluation of antioxidant activity. Saudi Pharm J. 2013;21(2):143-152.