RESEARCH ARTICLE
Anticonvulsant Activities of Asperphenamate and Nepetaefuran Isolated from Leucas martinicensis (Jacq.) Ait. f.
Academic Editor: Pra Panca Bayu Chandra
Sciences of Phytochemistry|Vol. 5, Issue 1, pp. 97-104 (2026)
Views
Downloads
Shares
Received
Dec 6, 2025Revised
Feb 24, 2026Accepted
Mar 30, 2026Published
Apr 29, 2026
Abstract
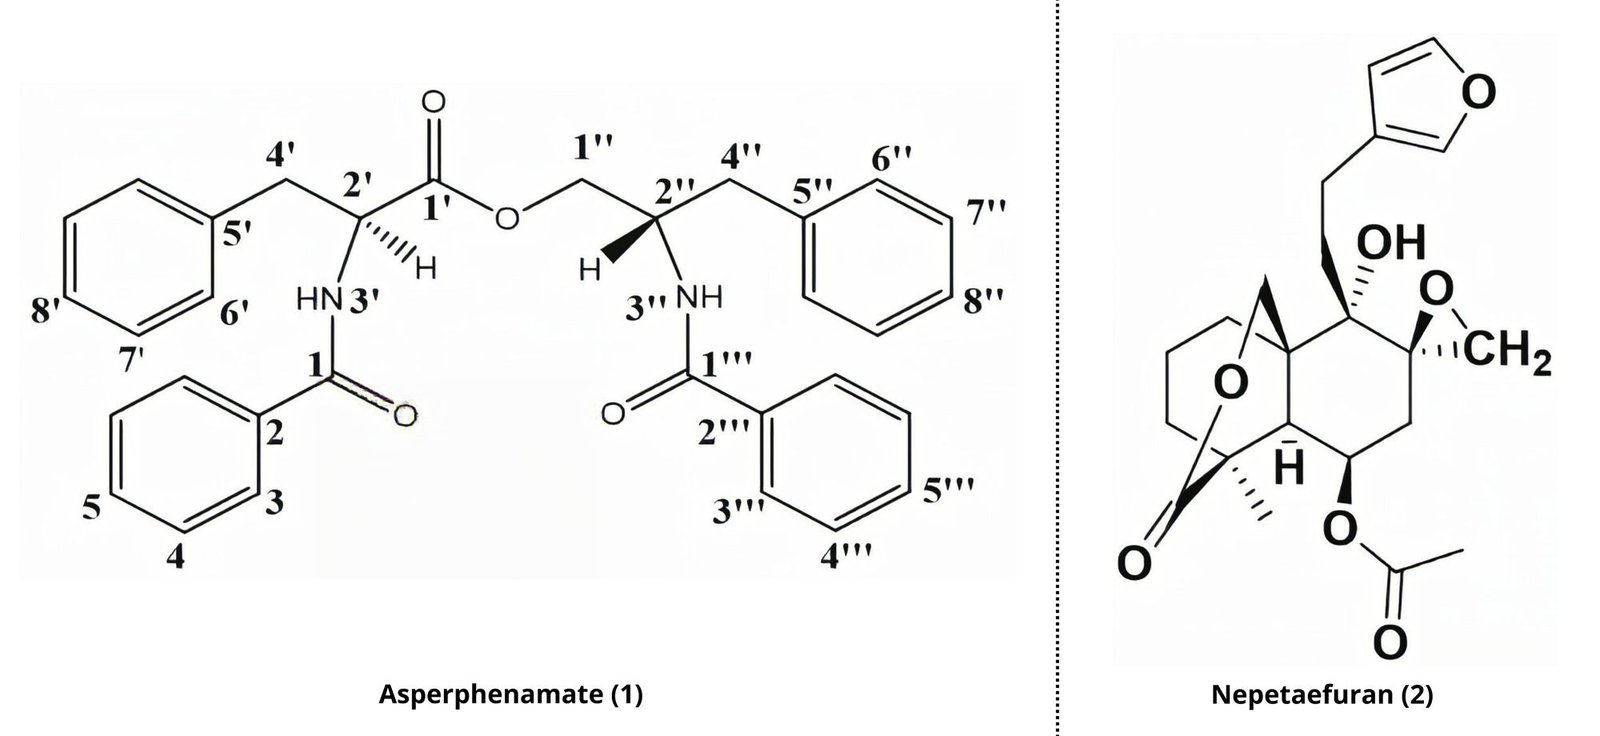
A known peptide, Asperphenamate (1) and a labdane diterpenoid, Nepetaefuran (2) were isolated for the first time from the aerial parts of Leucas martinicensis (Jacq.) Ait. f. (Lamiaceae) together with five known compounds: ß-sitosterol-3-O-ß-D-glucopyranoside and β-sitosterol, oleanolic acid and ursolic acid and Apegenin-7-O-glycoside. The structures of these compounds were established on the basis of mass spectrometry, NMR data and by the comparison with literature data. The dichloromethane-methanol (1:1, v/v) (LM) extract, the peptide and the labdane diterpenoid compounds were evaluated for their anticonvulsant effects on pentylenetetrazol, picrotoxin or bicuculine induced convulsions in mice. All the tested treatments showed anticonvulsant effects on experimental models of epileptic seizures chemically induced in mice. Asperphenamate (1) (JW514) showed up to 100% protection of animals against convulsions, Nepetaefuran (2) (JW512) and the dichloromethane-methanol (1:1, v/v) (LM) extract showed a maximum of 83.33% protection against pentylenetetrazol induced convulsions.
Introduction
Many Aboriginal societies in the whole world have a long history of using plants for medicinal purposes, to treat a variety of illnesses such as Epilepsy. Epilepsy is a chronic neurological disorder characterized by recurrent and unprovoked seizures resulting from abnormal neuronal discharges in the brain. It affects more than 50 million people worldwide and remains a major public health concern, particularly in low-and middle-income countries where access to treatment is limited (1, 2). Although several synthetic antiepileptic drugs (AEDs) are available, nearly one-third of patients remain refractory to current therapies, and many experience adverse effects including sedation, cognitive impairment, hepatotoxicity, and drug interactions (3). These limitations justify the continuous search for safer and more effective anticonvulsant agents, especially from natural sources. In Africa, traditional medicine remains a primary healthcare resource, and numerous plants are used in the management of epilepsy and convulsive disorders. Among these, Leucas martinicensis (Jacq.) R.Br. (Lamiaceae) is widely distributed in tropical regions and is traditionally employed for the treatment of inflammatory conditions, malaria, gastrointestinal disorders, leprosy, diarrhoea, dysentery and neurological complaints (4, 5). Previous phytochemical investigations have revealed that the plant contains flavonoids, terpenoids, alkaloids saponins, glycosides, and other bioactive secondary metabolites that may contribute to its pharmacological activities (6-8).
We describe herein the isolation and structure elucidation of compounds from L. martinicensis (Jacq.) Ait. f. Some of the isolated compounds from the species were tested for anticonvulsant activities.
Methodology
Plant Material Collection
The aerial parts of L. martinicensis (Jacq.) Ait. f. (Lamiaceae) were collected from 400 Place Pitoire in the
Far-North Region of Cameroon, in November 2018. It was identified at the Cameroon National Herbarium (HNC) in Yaounde
by the botanist Tadjouteu Fulbert. The voucher specimen N° 49080/HNC was deposited at the same herbarium. After
collection, the plant materials were thoroughly cleaned, shade-dried at room temperature, and subsequently ground into
a fine powder for extraction.
Extraction and Isolation of Compounds
The aerial parts of L. martinicensis were milled into fine powder (1916.1 g) which was extracted with 10 L
of dichloromethane-methanol (1:1, v/v) at room temperature for 72 h. The plant extract was filtered with cotton and
the brown filtrate was concentrated to dryness using a rotary evaporator. The process was repeated three times
yielding 206.3 g of crude extract. 205.3 g of this crude extract was subjected to column chromatography (CC) over
silica gel (1026.5 g) and eluted with n-hexane, a mixture of n-hexane/ethyl acetate with increasing polarity and
finally with methanol. A total of 84 fractions of 300 mL each were collected and combined in four sub-fractions (Fr-A,
Fr-B, Fr-C and Fr-D) based on TLC analysis. Sub-fraction Fr-A was subjected to CC on silica gel (60.0 g) eluted with
n-hexane, a mixture of n-hexane/EtOAc and EtOAc/MeOH gradients. Five compounds were obtained following this
fractionation, which are among others: compound 3 (11.2 mg, β-sitosterol white powder, obtained from Fraction 13–17
n-hexane/EtOAc 10%); compound 1 (7.0 mg, Asperphenamate white powder, obtained from Fraction 29–32 n-hexane/EtOAc
40%); compound 2 (6.0 mg, Nepetaefuran beige powder, obtained from Fraction 36–37 n-hexane/EtOAc 50%) and compound 4
(10.2 mg, ß-sitosterol-3-O-ß-D-glucopyranoside white powder, obtained from Fraction 68–84 EtOAc/MeOH 5%). Sub-fraction
Fr-B was also subjected to CC on silica gel (60.0 g) eluted with a mixture of n-hexane/CH₂Cl₂
and
CH₂Cl₂/MeOH gradients. One compound was obtained: compound 5 (6.0 mg, oleanolic acid white powder, obtained from
Fraction 22–24 n-hexane/CH₂Cl₂ 20%). Sub-fraction Fr-C was also subjected to CC on silica gel (170.0 g) eluted with a
mixture of n-hexane/CH₂Cl₂ and
CH₂Cl₂/MeOH gradients. Four compounds were obtained: compound 6 (8.4 mg, ursolic acid white powder, obtained from
sous-Fraction 39–41 n-hexane/CH₂Cl₂ 20%); compound 7 (6.0 mg, Apegenin-7-O-glycoside Yellow powder,
obtained from sous-Fraction 122–124
CH₂Cl₂/MeOH 5%).
Apparatus
High-resolution mass spectra were obtained with an ESI source-equipped TOF spectrometer (Bruker, South Africa). Using sodium formate as a calibrant, the spectrometer was run in both positive and negative modes (mass range: 50-1500, scan rate: 1.00 Hz) with automatic gain control to get highly accurate mass readings within 1 ppm deviance. For the experiments, a capillary temperature of 200 °C and a spray voltage of 4.5 kV were employed, with nitrogen serving as the sheath gas at a rate of 4 L/min. Bruker Bio Spin GmbH was used to record the 1D NMR spectra (¹H NMR, 500 MHz and 600 MHz; ¹³C NMR 126 MHz and 150.9 MHz) and 2D NMR spectra (COSY, HSQC HMBC and NOESY) in deuterated solvents (CDCl3, methanol-d4, and DMSO-d6). Tetramethylsilane (TMS) (Sigma Aldrich) was used as an internal standard for reporting chemical shifts in δ (ppm), and coupling constants (J) were measured. Column chromatography (CC) were carried out on silica gel (0.040-0.063 mm). Thin layer chromatography (TLC) were performed on Merck precoated silica gel 60F250 aluminum. The revelation of the spots was done in several ways: Use of a SPECTROLINE model CC-80 UV lamp with wavelengths of 264 (green) and 365 nm (purple); Spraying the plates with 25% diluted sulfuric acid in water followed by heating on a hot plate.
Biological screening was carried out in the collaborating Zoology and Animal Physiology Laboratories of the Department of Zoology and Animal Physiology, Faculty of Science, University of Buea. Albino Swiss mice of either sex (18-22 g) was obtained from the Animal Centre, University of Buea, Cameroon and were kept in plastic cages at room temperature. They were fed with balanced rodent pellet diet and water ad libitum and were acclimatized for one week before using them for experiments. The procedures used in the study were in compliance with the ethical guidelines of the University of Buea and National Institutes of Health guide for the Care and Use of Laboratory Animals for experimental investigations. The following drugs were used: picrotoxin, PCT (Sigma-Aldrich, St. Louis, USA), pentylenetetrazole, PTZ (Sigma-Aldrich, St. Louis, USA), Clonazepam, CLZ (Roche, France).
Procedure: Antiepileptic Assay
Picrotoxin (PCT)-induced Convulsion Test
Mice were divided into fourteen groups of six mice each, and received the dichloromethane-methanol (1:1, v/v) (LM) extract (5, 10, 15 or 20 mg/kg; i.p.), compounds 1 (JW 514) (5, 10, 15 or 20 mg/kg; i.p.), 2 (JW 512) (5, 10, 15 or 20 mg/kg; i.p.) clonazepam (1 mg/kg, i.p.) or vehicle (10 mL/kg p.o.). One hour later, clonic-tonic seizures were induced in mice by intraperitoneal (i.p.) injection of 7.5 mg/kg PCT. The mice were observed for 15 min and the protective effects of the different treatments were recorded. Animals that did not convulse within the 15 min of observation were qualified as protected (9).
Pentylenetetrazole (PTZ)-induced Convulsion Test
Fourteen groups of six mice were treated as discussed previously. However, the positive control group received 0.1 mg/kg clonazepam i.p. Clonic-tonic seizures were induced in mice by the i.p. injection of 70 mg/kg PTZ. The protective effect of the different treatments given 1 h before PTZ injection was recorded. Animals that did not convulse within the 10 min of observation were qualified as protected (9).
Statistical Analysis
The data were expressed as mean ± S.E.M. The data were analyzed with Graph Pad Prism Software version 4.03. Statistical analysis of data was done by One-way ANOVA, followed by Dennett’s post-hoc test. A level of p < 0.05 was considered as statistically significant.
Results and Discussion
Identification of Compounds
The dichloromethane-methanol (1:1, v/v) (LM) extract from the aerial parts of species L. martinicensis (Jacq.) Ait. f. was subjected to repeated column chromatography on silica gel and seven known compounds were isolated: Asperphenamate (1) (10), Nepetaefuran (2) (11),ß-sitosterol-3-O-ß-D-glucopyranoside) (4) (12), β-sitosterol (3) (13), oleanolic acid (5) (14), ursolic acid (6) (14), Apegenin-7-O-glycoside (7) (15,16). The chemical structures of the main compounds (1) and (2) are shown in Figure 1.
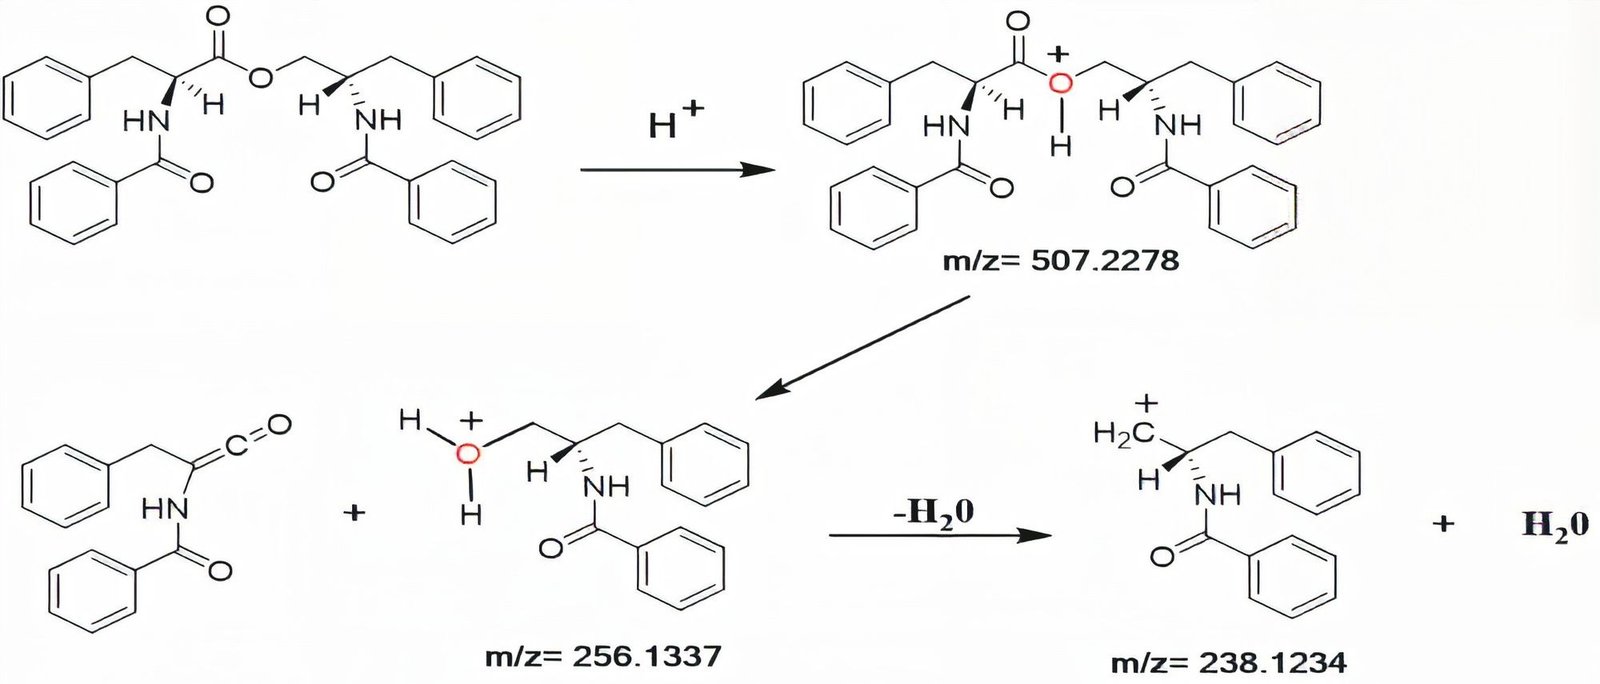
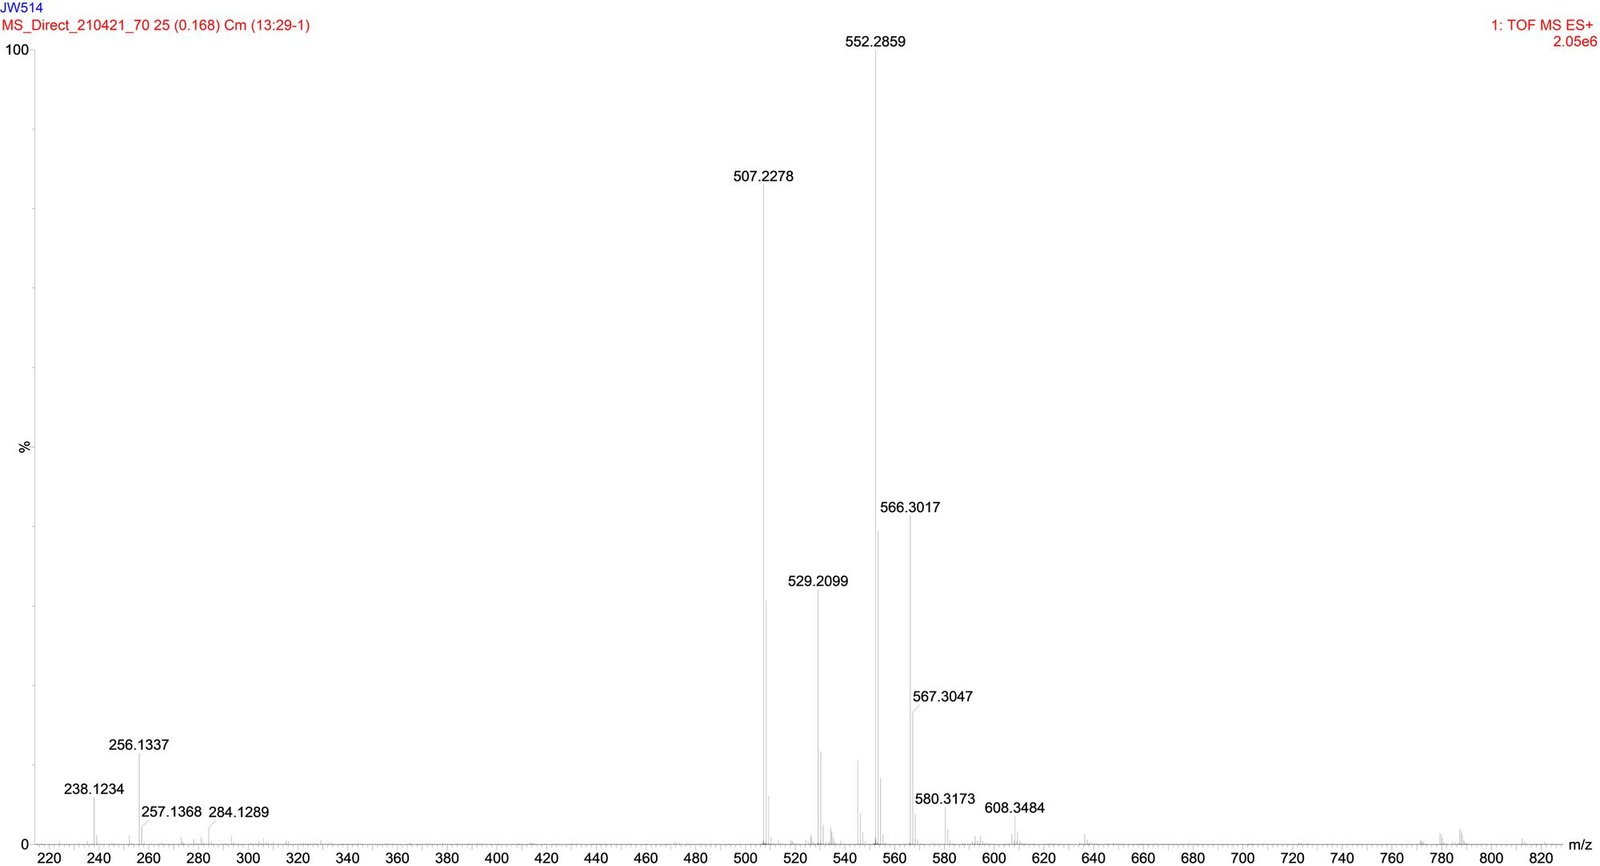
Compound 1 (JW514), Asperphenamate white powder, was obtained from Fraction 29-32 n-hexane/EtOAc 40%). It is soluble in chloroform. Its molecular formula was assigned as C₃₂H₃₀N₂O₄ with the aid of its High Resolution TOF-ESI-MS (Figure 3) which showed the pseudo-molecular ion peak [M+H]+ at m/z 507.2278 (calculated 507.2278 for C₃₂H₃₁N₂O₄), containing nineteen degrees of unsaturation. This mass spectrum, combined with the ¹H, ¹³C, DEPT 135, HSQC NMR spectra and with that of the literature review by Subko et al., (2021), allowed us to identify the basic skeleton of Asperphenamate. The detailed NMR data are summarized in Table 1. We observed in the ¹H-NMR spectrum signals at δ 7.72 (2H, d, J = 7.3 Hz, H-3), 7.68 (2H, d, J = 7.3 Hz, H-3’’’), 7.53 (¹H, t, J = 7.4 Hz, ¹H-5’’’), 7.44 (¹H, t, J = 7.5, 1.1, H-5), 7.36 – 7.30 (8H, m, H-4; H-4’’’; H-7’; H-7’’) and at δ 7.28 – 7.22 (6H, m, H-6’; H-8’; H-6’’; H-8’’) which correspond to the aromatic protons and all attributable to the four monosubstituted phenyls. We observed among others two signals at δ 6.68 (¹H, d, J = 8.4 Hz, H-3’’) and at δ 6.60 (¹H, d, J = 6.5 Hz, H-3’) attributable to secondary amino groups. This spectrum also shows six proton signals at δ 4.56 (¹H, dd, J = 11.3, 3.3 Hz, H-1’’a), 4.06 (¹H, dd, J = 11.3, 4.3 Hz, H-1’’b), 3.32 (¹H, dd, J = 13.9, 6.5 Hz, H-4’a), 3.24 (¹H, dd, J = 13.9, 7.0 Hz, H-4’b), 3.02 (¹H, dd, J = 13.7, 6.5 Hz, H-4’’a), and at δ 2.91 (¹H, dd, J = 13.7, 8.3 Hz, H-4’’b) attributable to three diastereotopic methylene groups. Finally we observe two signals at δ 4.94 (¹H, q, J = 6.7 Hz, H-2’) and at δ 4.65 (¹H, ddq, J = 12.1, 8.2, 4.0 Hz, H-2’’) corresponding to the methine groups. The TOF-ESI mass spectrum shows two major fragment ions, each of which contains two monosubstituted phenyls at m/z = 256.1337 and m/z = 238.1234. This corresponds to a cleavage of the ester bond to yield a protonated N-benzoylphenylalaninol ion [C₁₆H₁₈NO₂]+, followed by a loss of water on the same fragment to yield [C₁₆H₁₆NO]+, see Figure 2 and the TOF-ESI mass spectrum Figure 3. The fully decoupled ¹³C-NMR spectrum showed 24 signals corresponding to at least 24 types of carbon. This spectrum, combined with the DEPT 135 and HSQC spectra, allowed us to identify the different carbon families. There are 7 quaternary carbon signals, 3 of which belong to carbonyl groups (at δ 171.9 (C-1’), 167.4 (C-1), 167.2 (C-1’’’)) and 4 attributable to aromatic carbons (at δ 137.2 (C-5’’), 135.8 (C-5’), 134.3 (C-2’’’), 133.4 (C-2)), 14 tertiary carbon signals, 12 of which are attributable to the four monosubstituted phenyls (at δ 126.8 (C-3’’’), 127.0 (C-3), 127.1 (C-4), 127.4 (C-8’’), 128.4 (C-7’’), 128.6 (C-4’’’), 128.7 (C-8’), 128.8 (C-7’), 129.2 (C-6’), 129.3 (C-6’’), 131.4 (C-5), 132.0 (C-5’’’)) and two others corresponding to the methine groups (at δ 50.3 (C-2’’), 54.5 (C-2’)) and 3 secondary carbon signals at δ 37.3 (C-4’’), 37.6 (C-4’), 65.5 (C-1’’) attributable to the methylene group. In the HMBC spectrum, 3JH-C correlations are observed between the diastereotopic protons at δ 4.56 (H-1’’a) / 4.06 (H-1’’b) and at δ 3.32 (H-4’a)/ 3.24 (H-4’b) with the ester carbonyl at δ 171.9 (C-1’), which allowed us to link the two substructures each comprising two monosubstituted phenyls. We also observe the 3JH-C correlations between the diastereotopic protons at δ 4.56 (H-1’’a)/ 4.06 (H-1’’b) with the carbon at δ 37.3 (C-4’’) and the diastereotopic protons at δ 3.02 (H-4’’a), 2.91 (H-4’’b) with the carbon at δ 65.5 (C-1’’). In 2JH-C, correlations of amino protons at δ 6.60 (¹H, d, J = 6.5 Hz, H-3’) with the carbonyl of amides at δ 167.4 (C-1) and at δ 6.68 (¹H, d, J = 8.4 Hz, H-3’’) with carbonyl of amides at δ 167.2 (C-1’’’) are observed. In 3JH-C, correlations with protons at δ 7.68 (2H, d, J = 7.3 Hz, H-3''') and 7.72 (2H, d, J = 7.3 H-3 Hz) with carbonyls of amides at δ 167.2 (C-1’’’) and at δ 167.4 (C-1) are observed, respectively. Similarly, in 3JH-C we observe correlations between the protons at δ 7.28 – 7.22 (4H, m, H-6’’; H-6’) with the carbons at δ 37.3 (C-4’’) and at δ 37.6 (C-4’) respectively. In the COSY Spectrum, we observe in 3JH-H the scalar correlations between the protons at δ: 4.65 (¹H, ddq, J = 12.1, 8.2, 4.0 Hz, H-2’’) and 6.68 (¹H, d, J = 8.4 Hz, H-3’’); 4.65 (¹H, ddq, J = 12.1, 8.2, 4.0 Hz, H-2’’) and 6.60 (¹H, d, J = 6.5 Hz, H-3’); 3.32 (¹H, dd, J = 13.9, 6.5 Hz, H-4’) and 4.94 (¹H, q, J = 6.7 Hz, H-2’) and in 2JH-H a scalar correlation with the diastereotopic protons at δ 4.56 (¹H, dd, J = 11.3, 3.3 Hz, H-1’’a) and at δ 4.06 (¹H, dd, J = 11.3, 4.3 Hz, H-1’’b). The relative and absolute stereochemistry at the C-2’ and C-2’’ chiral centers was established based on the H-2’ proton coupling constant at δ 4.94 (J = 6.7 Hz), identical to that proposed by Subko et al., (2021). Moreover, we do not observe any spatial correlation between the H-2’ and H-2’’ protons in the NOESY spectrum, thus justifying their different orientations. From all the above, the compound 1 (JW514) was identified as Asperphenamate, isolated for the first time from the species.
| Position | Compound (1) JW514 | Asperphenamate (10) | ||
|---|---|---|---|---|
| δC (ppm) | δH (ppm) (nH, m, J) | δC (ppm) | δH (ppm) (nH, m, J) | |
| 1 | 167.4 | - | 167.7 | - |
| 2 | 133.4 | - | 133.4 | - |
| 3 | 127.0 | 7.72 (2H, d, J = 7.3 Hz) | 127.0 | 7.70 (2H, d, J=8.3, 1.1Hz) |
| 4 | 127.1 | 7.36 – 7.30 (2H, m) | 128.6 | 7.39 (2H, m) |
| 5 | 131.4 | 7.44 (¹H, t, J = 7.5, 1.1 Hz) | 131.9 | 7.50 (¹H, t, J=7.5, 1.1Hz) |
| 1’ | 171.9 | - | 172.2 | - |
| 2’ | 54.5 | 4.94 (¹H, q, J = 6.7 Hz) | 54.4 | 4.92 (¹H, q, J= 6.6 Hz) |
| 3’NH | - | 6.60 (¹H, d, J = 6.5 Hz) | - | 6.58 (¹H, d, J= 6.6 Hz) |
| 4’ | 37.6 | 3.32 (¹H, dd, J = 13.9, 6.5 Hz) 3.24 (¹H, dd, J = 13.9, 7.0 Hz) | 37.5 | 3.29 (¹H, dd, J=14.0, 6.6Hz) 3.21 (¹H, dd, J=14.0, 7.0Hz) |
| 5’ | 135.8 | - | 135.7 | - |
| 6’ | 129.2 | 7.28 – 7.22 (2H, m) | 129.1 | 7.21 (2H, m) |
| 7’ | 128.8 | 7.36 – 7.30 (2H, m) | 128.8 | 7.29 (2H, m) |
| 8’ | 128.7 | 7.28 – 7.22 (2H, m) | 126.7 | 7.24 (2H, m) |
| 1’’ | 65.5 | 4.56 (¹H, dd, J = 11.3, 3.3 Hz) 4.06 (¹H, dd, J = 11.3, 4.3 Hz) | 65.3 | 4.54 (¹H, dd, J=11.4, 3.4 Hz) 4.04 (¹H, dd, J=11.4, 4.4 Hz) |
| 2’’ | 50.3 | 4.65 (¹H, dd, J = 12.1, 8.2, 4.0 Hz) | 50.2 | 4.62 (¹H, m) |
| 3’’NH | 6.68 (¹H, d, J = 8.4 Hz) | 6.67 d (¹H, d, J=8.4Hz) | ||
| 4’’ | 37.3 | 3.02 (¹H, dd, J = 13.7, 6.5 Hz) 2.91 (¹H, dd, J = 13.7, 8.3 Hz) | 37.2 | 3.00 (¹H, dd, J=13.7, 6.4Hz) 2.89 (¹H, dd, J=13.8, 8.5Hz) |
| 5’’ | 137.2 | - | 137.1 | - |
| 6’’ | 129.3 | 7.28 – 7.22 (2H, m) | 129.2 | 7.23 (2H, m) |
| 7’’ | 128.4 | 7.36 – 7.30 (2H, m) | 128.3 | 7.32 (2H, m) |
| 8’’ | 127.4 | 7.28 – 7.22 (¹H, m) | 127.3 | 7.25 (¹H, m) |
| 1’’’ | 167.2 | - | 167.1 | - |
| 2’’’ | 134.3 | - | 134.1 | - |
| 3’’’ | 126.8 | 7.68 (2H, d, J = 7.3 Hz) | 126.9 | 7.65 (2H, d, J= 8.3, 1.1Hz) |
| 4’’’ | 128.6 | 7.36 – 7.30 (2H, m) | 128.6 | 7.31 (2H, m) |
| 5’’’ | 132.0 | 7.53 (¹H, t, J = 7.4 Hz) | 131.3 | 7.43 (¹H, t, J=7.5, 1.1 Hz) |
Anticonvulsant Activity
The anticonvulsant effects of the compounds (1) and (2) (20 mg/kg each), the dichloromethane-methanol (1:1, v/v) (LM) extract (5, 10, 15 and 20 mg/kg each) were assessed based on their abilities to prevent, or delay the onset of tonic-clonic seizures (convulsions) induced by pentylenetetrazole (PTZ) and picrotoxin (PCT) chemoconvulsant agents (70 and 7.5 mg/kg, respectively) in mice (9).
This assessment serves as a critical diagnostic tool in neuropharmacology, as PTZ and PCT act by antagonizing
GABAergic neurotransmission, which is the primary inhibitory pathway in the brain. Measuring the delay or prevention
of these seizures provides vital data on whether the tested compounds can stabilize neuronal membranes or enhance
inhibitory signaling. Ultimately, these findings are essential for identifying novel, plant-derived therapeutic
candidates that could offer more effective management for epilepsy and other seizure-related disorders, potentially
reducing the side-effect profile often associated with conventional synthetic anticonvulsants.
Effect of the Compound (1) on PTZ-induced Convulsion
The effects of intraperitoneal (i.p) injection of compound (1) (20 mg/kg) on convulsions induced by PTZ (70 mg/kg, i.p) in mice are shown in Table 2. compounds (1) (20 mg/kg) protected 100% of mice against convulsions induced by PTZ just as the reference drug, clonazepam (1 mg/kg) offered 100% protection against convulsions, as none of the animals exhibited tonic-clonic seizures induced by PTZ in mice. The effective dose needed for compound (1) to protect 50% of the animals (ED50) was about 10 mg/kg. Statistical analysis showed that compound (1) (20 mg/kg) significantly increased the latency to the tonic-clonic components of PTZ induced seizures in the unprotected mice (Table 2).
| Treatment | Dose (mg/kg) | Latency to the seizure (min) [mean ± SEM] | % Protection |
|---|---|---|---|
| Control (DW) | - | 3.47 ± 0.89 | 0 |
| compound (1) | 20 | 7.88 ± 0.57 | 100 |
| compound (2) | 20 | 9.12 ± 0.00 | 83.33 |
| Clonaz | 1 | No convulsion | 100 |
| Note: Values represent the mean ± S.E.M for 6 animals per group. p < 0.05, compared to control group (ANOVA followed by Dunnett’s post-hoc test). | |||
Effect of the Compound (2) on PTZ-induced Convulsion
The effects of intraperitoneal (i.p) injection of compound (2) (20 mg/kg) on convulsions induced by PTZ (70 mg/kg,
i.p) in mice are shown in Table 2. Compound (2) (20 mg/kg) protected 83.33% of mice against
convulsions induced by PTZ While the reference drug, clonazepam (1 mg/kg) offered 100% protection against convulsions,
as none of the animals exhibited tonic-clonic seizures induced by PTZ in mice. The effective dose needed for compound
(2) to protect 50% of the
animals (ED50) was about 12 mg/kg. Statistical analysis showed that compound (2) (20 mg/kg) significantly increased the latency to the
tonic-clonic components of PTZ induced seizures in the unprotected mice (Table 2).
Effect of the Dichloromethane-methanol (1:1, v/v) (LM) Extract on PTZ-induced Convulsion
The effects of intraperitoneal (i.p) injection of the dichloromethane-methanol (1:1, v/v) (LM) extract (5-20 mg/kg) on convulsions induced by PTZ (70 mg/kg, i.p.) in mice are shown in Table 3. LM (5-20 mg/kg) protected 16.66-83.33% of mice against convulsions induced by PTZ while the reference drug, clonazepam (1 mg/kg) offered 100% protection against convulsions, as none of the animals exhibited tonic-clonic seizures induced by PTZ in mice. The effective dose needed for the dichloromethane-methanol (1:1, v/v) (LM) extract to protect 50% of the animals (ED50) was about 12.5 mg/kg. Statistical analysis showed that the dichloromethane-methanol (1:1, v/v) (LM) extract (5-20 mg/kg) significantly increased the latency to the tonic-clonic components of PTZ induced seizures in the unprotected mice (Table 3).
| Treatment | Dose (mg/kg) | Latency to seizure (min) [mean ± SEM] | % Protection |
|---|---|---|---|
| Control (DW) | - | 4.04 ± 1.14 | 0 |
| LM | 5 | 5.50 ± 0.30 | 16.66 |
| LM | 10 | 9.12 ± 0.45 | 50 |
| LM | 15 | 8.48 ± 0.04 | 83.33 |
| LM | 20 | 7.80 ± 0.34 | 83.33 |
| Clonaz | 1 | No convulsion | 100 |
| Note: Values represent the mean ± S.E.M for 6 animals per group. *p < 0.05, **p < 0.01, ***p < 0.001 compared to control group (ANOVA followed by Dunnett’s post-hoc test). | |||
Effect of the Compound (1) on PCT-induced Convulsion
The effects of intraperitoneal (i.p) injection of compound (1) (20 mg/kg) on convulsions induced by PCT (7.5 mg/kg,
i.p) in mice are shown in Table 4. compound (1) (20 mg/kg) protected 100% of mice against convulsions
induced by PCT just as the reference drug, clonazepam (1 mg/kg) offered 100% protection against convulsions, as none
of the animals exhibited tonic-clonic seizures induced by PCT in mice. The effective dose needed for compound (1) to protect 50% of the animals
(ED50) was about 10 mg/kg. Statistical analysis showed that compound (1) (20 mg/kg) increased the latency to the tonic-clonic
components of PCT induced seizures in the unprotected mice (Table 4).
| Treatment | Dose (mg/kg) | Latency to the seizure (min) [mean ± SEM] | % Protection |
|---|---|---|---|
| Control (DW) | - | 3.91 ± 1.29 | 0 |
| compound (1) | 20 | 14.35 ± 0.16 | 100 |
| Clonaz | 1 | No convulsion | 100 |
| Compound (2) | 20 | 12.54 ± 0.00 | 83.33 |
| Note: Values represent the mean ± S.E.M for 6 animals per group. p < 0.05, compared to control group (ANOVA followed by Dunnett’s post-hoc test). | |||
Effect of the Compound (2) on PCT-induced Convulsion
The effects of intraperitoneal (i.p) injection of compound (2) (20 mg/kg) on convulsions induced by PCT (7.5 mg/kg, i.p) in mice are shown in Table 4. Compound (2) (20 mg/kg) protected 83.33% of mice against convulsions induced by PCT while the reference drug, clonazepam (1 mg/kg) offered 100% protection against convulsions, as none of the animals exhibited tonic-clonic seizures induced by PCT in mice. The effective dose needed for compound (2) to protect 50% of the animals (ED50) was about 12 mg/kg. Statistical analysis showed that compound (2) (20 mg/kg) increased the latency to the tonic-clonic components of PCT induced seizures in the unprotected mice (Table 4).
Effect of the Dichloromethane-methanol (1:1, v/v) (LM) Extract on PCT-induced Convulsion
The effects of intraperitoneal (i.p) injection of the dichloromethane-methanol (1:1, v/v) (LM) extract (5-20 mg/kg) on convulsions induced by PCT (7.5 mg/kg, i.p) in mice are shown in Table 5. LM (5-20 mg/kg) protected 16.66-66.66% of mice against convulsions induced by PCT while the reference drug, clonazepam (1 mg/kg) offered 100% protection against convulsions, as none of the animals exhibited tonic-clonic seizures induced by PCT in mice. The effective dose needed for the dichloromethane-methanol (1:1, v/v) (LM) extract to protect 50% of the animals (ED50) was about 15 mg/kg. Statistical analysis showed that the dichloromethane-methanol (1:1, v/v) (LM) extract (5-20 mg/kg) significantly increased the latency to the tonic-clonic components of PCT induced seizures in the unprotected mice (Table 5).
| Treatment | Dose (mg/kg) | Latency to the seizure (min) [mean ± SEM] | % Protection |
|---|---|---|---|
| Control (DW) | - | 3.21 ± 1.21 | 0 |
| LM | 5 | 4.88 ± 0.33 | 16.66 |
| LM | 10 | 6.93 ± 0.50 | 33.33 |
| LM | 15 | 7.90 ± 0.61 | 66.66 |
| LM | 20 | 8.58 ± 0.54 | 66.66 |
| Clonaz | 1 | No convulsion | 100 |
| Note: Values represent the mean ± S.E.M for 6 animals per group. *p < 0.05, compared to control group (ANOVA followed by Dunnett’s post-hoc test). | |||
Conclusion
One known peptide, Asperphenamate (1), one known labdane diterpenoid, Nepetaefuran (2), two known steroids, β-sitosterol (3) and
ß-sitosterol-3-O-ß-D-glucopyranoside (4), two known triterpenoids, oleanolic acid (5) and ursolic acid (6) and one known flavonoid, Apegenin-7-O-glycoside (7) were isolated from the aerial
parts of L. martinicensis (Jacq.) Ait. f. (Lamiaceae).
The dichloromethane-methanol (1:1, v/v) (LM) extract, compounds (1) and (2) were evaluated for their anticonvulsant effects on
pentylenetetrazole and picrotoxin induced convulsions in mice. Asperphenamate (1) showed up to 100% protection of animals against
convulsions, Nepetaefuran (2)
produced a maximum of 83.33% protection and the dichloromethane-methanol (1:1, v/v) (LM) extract showed a maximum of
83.33% protection.
These results suggest that compounds (1) and (2)
could have a supportive role in the pharmaceutical field towards the development of new anti epileptic drugs
(AEDs).
Declarations
Acknowledgment
The authors are grateful for the Adolphe Monkiedje Fellowship. We thank also Mr. Tadjouteu Fulbert (botanist) for the identification of plant material.
Conflict of Interest
The authors declare no conflicting interest.
Data Availability
All data generated during study are included in this article.
Ethics Statement
Not applicable.
Funding Information
The authors declare that no financial support was received for the research, authorship, and/or publication of this article.
References
- Kansole MMR, Hilou A, Millogo J, Nacoulma O. Ethnobotany and ethnopharmacognosy of Lamiaceae species from Central Burkina Faso: Leucas martinicensis (Jacq. ) R. Br. , Hoslundia opposita Vahl and Orthosiphon pallidus Royle ex Benth. Am J Ethnomed. 2015; 2 (4): 219–232.
- World Health Organization. Epilepsy fact sheet. WHO; 2023.
- Löscher W, Schmidt D. Modern antiepileptic drug development has failed to deliver: Ways out of the current dilemma. Epilepsia. 2011;52(4):657-678. doi: https://doi.org/10.1111/j.1528-1167.2011.03024.x
- Burkill HM. The Useful Plants of West Tropical Africa. 2nd ed. Royal Botanic Gardens; 2000.
- Iwu MM. Handbook of African Medicinal Plants. CRC Press; 2014. doi: https://doi.org/10.1201/b16292
- Harborne JB. Phytochemical Methods. 3rd ed. Chapman & Hall; 1998.
- Löscher W, Schmidt D. Modern antiepileptic drug development has failed to deliver: Ways out of the current dilemma. Epilepsia. 2011;52(4):657-678. doi: https://doi.org/10.1111/j.1528-1167.2011.03024.x
- Tadesse B, Yinebeb T, Ketema B. Antibacterial activity of selected medicinal plants used in South-western Ethiopia. Afr. J. Microbiol. Res. 2016;10(46):1961-1972. doi: https://doi.org/10.5897/ajmr2016.8328
- Bum E, Schmutz M, Meyer C, Rakotonirina A, Bopelet M, Portet C, et al. Anticonvulsant properties of the methanolic extract of Cyperus articulatus (Cyperaceae). Journal of Ethnopharmacology. 2001;76(2):145-150. doi: https://doi.org/10.1016/s0378-8741(01)00192-1
- Subko K, Wang X, Nielsen FH, Isbrandt T, Gotfredsen CH, Ramos MC, et al. Mass Spectrometry Guided Discovery and Design of Novel Asperphenamate Analogs From Penicillium astrolabium Reveals an Extraordinary NRPS Flexibility. Front. Microbiol. 2021;11:618730. doi: https://doi.org/10.3389/fmicb.2020.618730
- Smith CR, Madrigal RV, Weisleder D, Mikolajczak KL, Highet RJ. Potamogetonin, a new furanoid diterpene. Structural assignment by carbon-13 and proton magnetic resonance. J. Org. Chem. 1976;41(4):593-596. doi: https://doi.org/10.1021/jo00866a002
- Kamdem MH, Ojo O, Kemkuignou BM, Talla RM, Fonkui TY, Silihe KK, et al. Pentacyclic Triterpenoids, Phytosteroids and Fatty Acid Isolated from the Stem-bark of Cola lateritia K. Schum. (Sterculiaceae) of Cameroon origin; Evaluation of Their Antibacterial Activity. Arabian Journal of Chemistry. 2022;15(1):103506. doi: https://doi.org/10.1016/j.arabjc.2021.103506
- Chundattu SJ, Agrawal VK, Ganesh N. Phytochemical investigation of Calotropis procera. Arabian Journal of Chemistry. 2016;9:S230-S234. doi: https://doi.org/10.1016/j.arabjc.2011.03.011
- Mahato SB, Kundu AP. 13C NMR Spectra of pentacyclic triterpenoids—a compilation and some salient features. Phytochemistry. 1994;37(6):1517-1575. doi: https://doi.org/10.1016/s0031-9422(00)89569-2
- Gohari AR, Ebrahimi H, Saeidnia S, Foruzani M, Ebrahimi P and Ajani Y. Flavones and flavone glycosides from Salvia macrosiphon Boiss. Iran J Pharm Res. 2011 Spring; 10 (2): 247–251.
- Švehlı́ková V, Bennett RN, Mellon FA, Needs PW, Piacente S, Kroon PA, et al. Isolation, identification and stability of acylated derivatives of apigenin 7-O-glucoside from chamomile (Chamomilla recutita [L.] Rauschert). Phytochemistry. 2004;65(16):2323-2332. doi: https://doi.org/10.1016/j.phytochem.2004.07.011