RESEARCH ARTICLE
Utilization of Simplex Lattice Design to Optimize the Sunscreen Cream Formula Containing Tamarind Peel Extract
Academic Editor: Samir Chtita
Sciences of Phytochemistry|Vol. 5, Issue 2, pp. 288-297 (2026)
CC BY 4.0-2026 Authors
Views
Downloads
Shares

Received
Dec 17, 2025Revised
Mar 10, 2026Accepted
Aug 18, 2026Published
Aug 31, 2026
Abstract
The tamarind peel (Tamarindus indica L.) extract contains flavonoids that have the ability to provide photoprotection. An optimal cream formulation is required to achieve a high-quality dosage form. This study aimed to determine the total flavonoid content (TFC), to obtain the optimal cream formula, and to measure its photoprotective activity. This research was conducted experimentally and optimized using the Simplex Lattice Design (SLD) method using factors (stearic acid and triethanolamine) and responses (pH, viscosity, spreadability, and adhesiveness). In vitro photoprotective activity determination test using sun protection factor (SPF), erythema transmission percentage (%Te), and pigmentation transmission percentage (%Tp) parameters. The TFC is 47.7018±1.68 mg QE/g. The optimization results showed that variations in stearic acid and trietanolamine concentrations affected pH, viscosity, spreadability, and adhesiveness. The optimization produced a desirability value of 0.967 with predicted factors of 16.078% stearic acid and 3.922% triethanolamine. The predicted responses included pH (4.933), viscosity (247.32 dPas), spreadability (7.07 cm), and adhesiveness (7.37 seconds). A one-sample t-test showed no significant difference between the predictions and the actual results, as indicated by the calculated t-value (pH 0.002, viscosity 0.049, spreadability 0.000, and adhesion 0.000) < t-table (4.303). The cream containing tamarind peel extract exhibits photoprotective activity, with an SPF value of 13.63 ± 1.01, a %Te of 4.64 ± 1.19, and a %Tp of 12.37 ± 1.89. Photoprotective parameters show that the cream is quite good and has the potential for further development. In conclusion, this study shows that the optimized tamarind peel extract cream has photoprotective activity.
Introduction
Prolonged exposure to sunlight containing ultraviolet (UV) rays can cause side effects on the skin (1). UV rays have the potential to lead to erythema, pigmentation, premature aging, and skin cancer (2). Sunscreen can protect the skin and minimize the harmful effects of UV rays (3). Sun protection factor is an indicator to assess the effectiveness of UV protection capabilities (4). However, chemical sunscreens may cause adverse effects. Benzophenone-3 has the potential to cause neurotoxicity (5). Oxybenzone can potentially induce eczema (6). Other chemical sunscreens, such as avobenzone, para-aminobenzoic acid, and cinoxate, also have the potential to cause allergic contact dermatitis (7). Natural sunscreens offer a promising alternative.
Tamarind (Tamarindus indica L.) is a natural source that has commercial value (8). Previous research indicated that 1% Tamarind peel extract achieved a sun protection factor (SPF) of 36.22 (9). The flavonoid compounds contained in tamarind peel extract play a crucial role as UV-protective agents. Previous research indicates that tamarind skin extract contains flavonoids such as taxifolin, eriodictyol, catechin, morin, myricetin, luteolin, naringenin, and apigenin (10). Flavonoids have shown significant absorption in the ultraviolet A (UVA) and ultraviolet B (UVB) regions, due to their chemical structure with conjugated double bonds, and may be used as ingredients in cosmetic formulations for skin protection (11). Tamarind peel extract should be formulated into a cream to make it easier to apply as an active photoprotector on the skin.
Cream is a cosmetic product that can be used in various dermatological conditions, including in sunscreen products (12). The oil-in-water (O/W) cream was chosen as a sunscreen dosage form because it has advantages, such as being comfortable to use, easy to apply, nonsticky, and easy to wash with water compared to ointment or paste formulations (13). The emulsifying components in cream are crucial to controlling the physical characteristics of whipped cream (14). The use of stearic acid and triethanolamine emulsifiers has been previously studied in sunscreen creams. Stearic acid can increase viscosity and adhesiveness, but it can also reduce pH and spreadability. The properties of stearic acid are opposite to those of triethanolamine (15). Therefore, optimization is necessary to determine the optimal formulation.
Simplex Lattice Design (SLD) is one of the available optimization methods. Previous studies have shown that the use of the SLD method in optimizing triethanolamine and stearic acid can produce optimal cream (15). The aim of this research is to obtain an optimal cream formula. This goal is achieved by optimising the use of triethanolamine and stearic acid in a cream made from tamarind skin extract using the SLD method. The responses used in the analysis are pH, viscosity, spreadability, and adhesiveness. Furthermore, the optimised cream is tested for its activity.
Materials and Method
Materials
Tamarind peel obtained in Pekalongan City, Central Java, Indonesia. 96% ethanol (PT. Jayamas Medica Industri Tbk, Indonesia), distilled water (PT. Brataco, Indonesia), stearic acid (PT. Wilmar Nabati Indonesia), triethanolamine (Petronas Chemicals Marketing (Labuan) Ltd., Malaysia), cetyl alcohol (PT. Ecogreen Oleochemicals, Indonesia), glycerin (PT. Wilmar Nabati Indonesia, Indonesia), propylene glycol (SK Picglobal, South Korea), methyl paraben (Ueno Fine Chemicals Industry, Ltd., Japan), propyl paraben (Ueno Fine Chemicals Industry, Ltd., Japan).
Extraction of Tamarind Peel
The tamarind fruit is peeled and cleaned using running distilled water. Then, it is dried using a solar dryer dome. Before extraction, the sample is ground using a grinder. Extraction was performed using a maceration method with 96% ethanol for 5 days, extraction process conditioned in dark place (9). Extraction using 1000 mg of dried tamarind peel and 10 L of 96% ethanol, stirring is done once a day during maceration. The maceration product was concentrated using a rotary evaporator at 50 °C and 60 rpm. The extract was evaluated for organoleptic, yield, and water content (15, 16).
Determination of Flavonoid Content (Qualitative and Quantitative)
Qualitative determination of flavonoids was carried out using three methods: NaOH, Pew’s, and Shibata (15). Quantitative determination of flavonoids was performed by measuring total flavonoid content, adapted from previous research (16). A quercetin stock standard solution (1000 ppm) was prepared by dissolving 10 mg of quercetin in ethanol in a 10 mL volumetric flask. This solution was further diluted to obtain a 100 ppm working standard. The maximum absorption wavelength was determined by mixing 0.5 mL of a 60 ppm quercetin solution with 3.5 mL of ethanol, 0.1 mL of 10% AlCl₃, 0.1 mL of 1 M potassium acetate (CH₃COOK), and 2.8 mL of distilled water. After incubation for 30 min, the absorbance was scanned from 400 to 500 nm. The operating time was determined by measuring the absorbance of the same reaction mixture at the maximum wavelength from 1 to 60 min. A calibration curve was constructed using quercetin working solutions at concentrations of 40, 60, 80, 100, and 120 ppm, prepared using the same procedure and incubated according to the determined operating time. Absorbance was measured at the maximum wavelength. For sample analysis, 100 mg of crude extract was dissolved in 10 mL of ethanol. An aliquot of 0.5 mL of the test solution was treated with ethanol, AlCl₃, potassium acetate, and distilled water as described above. After incubation, the absorbance was measured at the maximum wavelength. Total flavonoid content was calculated using the linear regression equation obtained from the quercetin calibration curve. All measurements were performed in triplicate.
Experimental Design and Formulation
Simplex lattice design (SLD) optimization used triethanolamine and stearic acid factor levels, as shown in Table 1. The SLD approach used three replications, and it recommended eight runs. The formula components are shown in Table 2.
| Factor | Level | |
|---|---|---|
| Low | High | |
| Triethanolamine | 16 | 18 |
| Stearic acid | 2 | 4 |
| Ingridients | Formulation | |||||||
|---|---|---|---|---|---|---|---|---|
| Run 1 (%) | Run 2 (%) | Run 3 (%) | Run 4 (%) | Run 5 (%) | Run 6 (%) | Run 7 (%) | Run 8 (%) | |
| Tamarind peel extract | 1 | 1 | 1 | 1 | 1 | 1 | 1 | 1 |
| Stearic acid | 17 | 18 | 17.5 | 16 | 16.5 | 16 | 17 | 18 |
| Triethanolamine | 3 | 2 | 2.5 | 4 | 3.5 | 4 | 3 | 2 |
| Glycerin | 4 | 4 | 4 | 4 | 4 | 4 | 4 | 4 |
| Propyl Paraben | 0.02 | 0.02 | 0.02 | 0.02 | 0.02 | 0.02 | 0.02 | 0.02 |
| Methyl Paraben | 0.2 | 0.2 | 0.2 | 0.2 | 0.2 | 0.2 | 0.2 | 0.2 |
| Cetyl alcohol | 4 | 4 | 4 | 4 | 4 | 4 | 4 | 4 |
| Propylene glycol | 7 | 7 | 7 | 7 | 7 | 7 | 7 | 7 |
| Distilled water ad | 100 | 100 | 100 | 100 | 100 | 100 | 100 | 100 |
The oil phase (cetyl alcohol, stearic acid, propylparaben, and liquid paraffin) and the water phase (glycerin, triethanolamine, methylparaben, and distilled water) are melted separately in porcelain dishes using a water bath set at 70°C. Once the oil phase has melted, it is poured into a warm mortar. Then, the water phase is gradually added to the mortar containing the oil phase while stirring continuously. After the mortar has cooled sufficiently, add the tamarind peel extract and stir until a homogeneous cream is formed.
Tamarind Peel Extract Cream Evaluation
pH Test
pH is measured to ensure the cream has a pH suitable for skin, 4.5-6.5. The pH meter is calibrated using a buffer solution. The process involves dissolving 1 gram of cream in 25 ml of distilled water. The electrode on the pH meter is dipped into the solution. The pH value of the cream will appear on the pH meter screen (17).
Spreadability Test
The spreadability test was carried out by placing 0.5 g of cream on a clear glass surface, then it was given a graduated load (50, 100, 150, and 250 grams). Each load is left for 60 seconds, and the spread cream's diameter is measured. A good spreadability of cream has a diameter of 5-7 cm, which indicates the cream can spread well on the skin surface (18).
Adhesion Test
The adhesion test was performed by placing 0.5 g of cream between two glass slides. It was given a load of 500 grams for 1 minute. Good cream adhesion is > 4 seconds. Good adhesion indicates that the cream adheres well to the skin, providing a longer-lasting protective effect (18).
Viscosity Test
Viscosity testing is conducted using a digital viscometer by attaching the rotor to the device and locking it clockwise. The cup is filled with the cream sample to be tested, and the rotor is placed in the center of the filled container. The rotor selection depends on the equipment specifications, which are based on the cream's viscosity estimate. The chosen rotor is number 2, though it may vary. Then, adjust the rotor number and speed on the instrument. The ideal viscosity for a cream is between 50-1000 dPas. The viscosity value can be seen on the viscometer screen (15).
Simplex Lattice Design Analysis
The SLD analysis used triethanolamine and stearic acid as factors. The responses included pH, viscosity, spreadability, and adhesiveness. Statistical analysis for optimization considered the model's P-value and the lack-of-fit test (15). The p-value in the model indicates whether there is a significant difference between the formulas, while the lack-of-fit test value shows the difference between the model's equation predictions from the software and the research results.
Verification of the Optimum Formula
The optimum formula prediction is formulated and evaluated. The actual evaluation results are compared against the prediction using a one-sample t-test (19).
Additional Evaluation of the Optimum Formula
Additional evaluations of the optimum formula cream include irritation testing, emulsion type, and sun protection factor (SPF) measurement.
Irritation Test
An irritation test was conducted to determine whether the formulated cream causes skin irritation or side effects. This test references prior research with several modifications (20). It involved healthy female volunteers aged 19 to 30 years. The number of volunteers was 10 people. Observations were conducted by applying 0.5 g of the cream to a 2.0 x 2.0 cm area on the back of the hand. Indicators included erythema and oedema. The parameters used were scoring the degree of erythema and oedema, by assigning scores from 0 to 4 depending on the severity of the oedema and erythema reactions in the test area. The irritation test did not involve any comparator. It was conducted solely with the tamarind skin extract cream (n=3), which had been optimized using SLD.
Emulsion Type Test
The emulsion type test involves adding 1g of cream, followed by one drop of methylene blue, and mixing thoroughly. The cream is classified as an oil-in-water (O/W) type if the methylene blue is evenly dispersed, but as a water-in-oil (W/O) type if blue spots appear (21).
In Vitro Sunscreen Evaluation
The sun protection factor (SPF) value measurement uses the Mansur equation (22). It shown in Equation 1. Where CF is the correction factor (10). EE is the erythemal effect spectrum, and I is the solar intensity spectrum. EE×I (constant), and Abs is the sample absorbance.
The cream was dissolved in 96% ethanol to achieve a 1% concentration. The SPF value was analyzed in vitro using UV-Vis spectrophotometry at a wavelength of 290-320 nm (5 nm interval) (15). The In vitro sunscreen evaluation for SPF did not involve any comparator. It was conducted solely with the tamarind skin extract cream (n=3), which had been optimized using SLD.
Measurement of Erythema Transmission
The measurement of erythema transmission refers to the equation developed by Cumpelik (Equation 2) (15, 23). Where %Te = erythema transmission; Fe = flux of erythema (constant).
The cream was dissolved in 96% ethanol to achieve a 1% concentration. The %Te value was analyzed in vitro using UV-Vis spectrophotometry at 292.5-372.5 nm. The %Te did not involve any comparator. It was conducted solely with the tamarind skin extract cream (n=3), which had been optimized using SLD.
Measurement of Pigmentation Transmission
The measurement of pigmentation transmission refers to the equation developed by Cumpelik (Equation 3) (15, 23), where %Tp= pigmentation transmission; Fp = flux of pigmentation (constant).
The cream was dissolved in 96% ethanol to achieve a 1% concentration. The %Tp value was analyzed in vitro using UV-Vis spectrophotometry at 322.5–372.5 nm. The %Tp did not involve any comparator. It was conducted solely with the tamarind skin extract cream (n = 3), which had been optimized using SLD.
Results and Discussion
Tamarind Peel Extraction
Tamarind peel was collected in Pekalongan City, Indonesia. It was extracted using maceration. The extraction results are shown in Table 3. Tamarind peel is dried to reduce its water content. This drying process aims to prevent microbial growth and associated damage to the medicinal plant. The medicinal plant is pollinated to reduce its particle size. This will impact the extraction process, increasing contact between the solvent and the sample, thereby enhancing penetration of the cell wall and dissolving the compound (24). Water content is determined for the medicinal plant powder of tamarind peel. The water content is measured using a moisture analyzer. The water content is 3.73%. The ethanol extract of the tamarind peel is evaporated to remove the solvent. Evaporation is performed at < 50°C to prevent damage to the flavonoid compounds in the extract. The results of the extraction process are shown in Table 3. The extraction of tamarind peel yields 151.271 grams of extract (15.12% w/w). The calculation of the extract yield aims to determine the ratio between the extract amount and the medicinal plant's initial weight (25). A higher yield value indicates a higher compound extract content. Water content of tamarind peel extract is 13.54%. This is related to the stability of the extract, too high a water content can encourage bacterial growth (26).
| Sample | Dry sample | Loss on drying | Simplicia powder | Water content of simplicia powder | Extract | Yield | Water content of the extract |
|---|---|---|---|---|---|---|---|
| 10kg | 1 kg | 90% | 1 kg | 3.73% | 151.271 g | 15.12% | 13.54% |
Determination of Flavonoid Content (Qualitative and Quantitative)
Qualitative compound identification was conducted to determine the secondary metabolites contained in tamarind peel extract. Flavonoid identification can be performed using three methods: the NaOH test, the Pew's test, and the Shibata test (27). The identification results are shown in Table 4. The tamarind peel extract was identified as containing flavonoid compounds based on the results. Flavonoid testing using the NaOH method was performed by adding 10% NaOH, which caused the extract to change from brownish to red. The red colour indicates the presence of flavonoid compounds (28). Identification using Pew's method, adding 0.1g of zinc powder and 8ml of sulfuric acid showed a colour change in the extract from brownish to red. The red colour indicates the presence of flavonol compounds (29). Identification using the Shibata method, with the addition of magnesium powder and HCl, resulted in a colour change in the extract from brownish to orange. The orange colour indicates the presence of flavone compounds (29).
| Method | Reagent | Result |
|---|---|---|
| NaOH | NaOH (10%) | (+) |
| Pew’s | Zn+H2SO4 | (+) |
| Shibata | Mg powder+HCl | (+) |
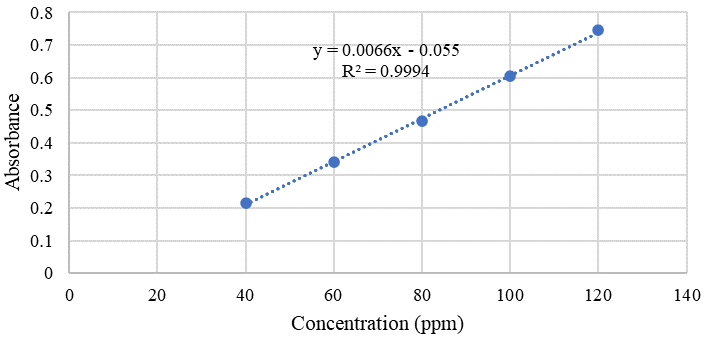
Quantitative measurement of flavonoids shows a content of 47.7018±1, 68 mg QE/g. The regression equation was derived from a quercetin standard solution: y = 0.0066x - 0.055. The correlation coefficient obtained was 0.9994. The linearity value indicates the relationship between concentration and absorbance. Quercetin was used as the standard for determining flavonoid content because it is the most widely distributed compound found in plants (16). Therefore, tamarind peel extract contains flavonoids both qualitatively and quantitatively. Quantitative measurement of flavonoids shows a content of 47.7018±1, 68 mg QE/g. The quercetin calibration curve is shown in Figure 1.
Results of Experimental Design and Formulation
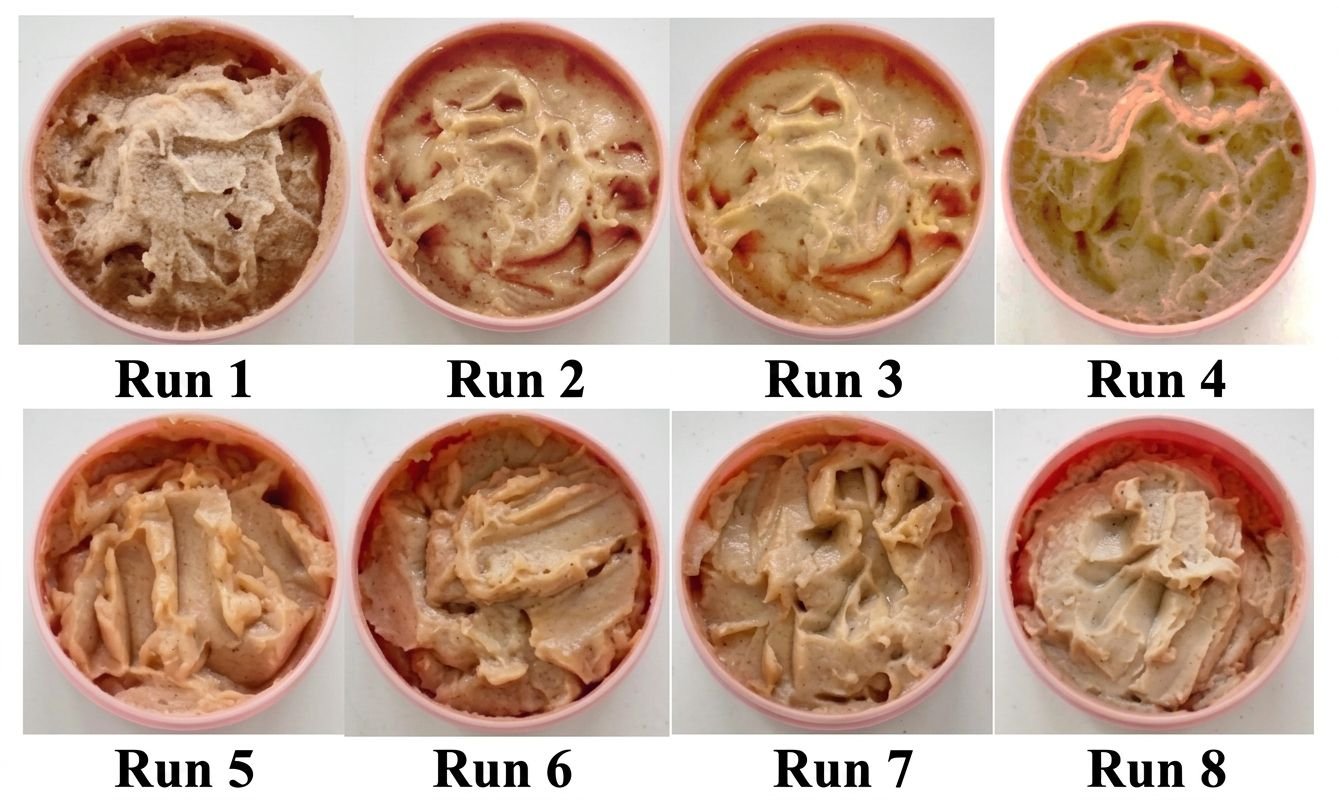
Cream formulations were developed in accordance with the simplex lattice design recommendations. The formulation results are shown in Figure 2. The factors used were stearic acid and triethanolamine. The formulation has an orange colour, a distinctive extract odour, and a semi-solid texture. The tamarind peel extract affected the cream's color and odor. The texture is achieved through a blend of formula components, including the stearic acid base and triethanolamine, which impart a semi-soft texture to the cream. Differences in texture among the creams are due to variations in the stearic acid-to-triethanolamine ratio. The cream formula also contains several excipients, such as cetyl alcohol to improve consistency, glycerin as an emollient, and methylparaben and propylparaben as preservatives. Homogeneity is a critical parameter in cream formulation. It concerns the uniform distribution of active ingredients within each application. A cream with good homogeneity has a uniform colour, even mixing, and no coarse particles (30). The requirement for homogeneity is that, when applied to a glass slide, there are no coarse grains or separation between emulsion components. The homogeneity evaluation of the eight formulas indicated uniform formulation with no visible coarse grains.
Tamarind Peel Extract Cream Evaluation and Simplex Lattice Design Analysis
The cream was evaluated for pH, spreadability, adhesiveness, and viscosity. The response measured was the evaluation in the simplex lattice design. It is shown in Table 5.
| Response | Run 1 | Run 2 | Run 3 | Run 4 | Run 5 | Run 6 | Run 7 | Run 8 |
|---|---|---|---|---|---|---|---|---|
| pH | 5.42 | 4.70 | 5.11 | 6.03 | 5.74 | 6.07 | 5.24 | 4.81 |
| Spreadability (cm) | 6.44 | 5.88 | 6.34 | 6.98 | 6.79 | 6.97 | 6.94 | 5.78 |
| Adhesiveness (second) | 9.28 | 9.56 | 9.03 | 7.08 | 8.13 | 7.50 | 8.47 | 9.50 |
| Viscosity (dPas) | 591.92 | 986.97 | 787.95 | 247.49 | 392.81 | 202.65 | 591.66 | 969.47 |
The analysis of the simplex lattice design includes the model, the lack of fit term, and the equation. These results are shown in Table 6. Optimization and two-component mix interactions between factors (triethanolamine and stearic acid) are shown in Figure 3.
| Response | Model | Lack of Fit Test | Equation |
|---|---|---|---|
| pH | 0.0001 (Linear) | 0.7346 | Y = 4.74 (A) + 6.04 (B) |
| Spreadability | 0.0008 (Linear) | 0.6118 | Y = 5.94 (A) + 7.12 (B) |
| Adhesiveness | 0.0005 (Linear) | 0.5940 | Y = 9.60 (A) + 7.54 (B) |
| Viscosity | 0.0001 (Linear) | 0.8179 | Y = 975.01 (A) + 271.87 (B) |
The pH value of the cream indicates the product's safety and helps prevent skin irritation (15). The pH results are shown in Table 5. The pH evaluation of the cream demonstrates that all formulas meet the pH standards. The cream formulation has a pH range of 4.5 to 6.5, indicating it is safe for skin application. The pH test results were further analysed using the simplex lattice design method. The ANOVA statistical analysis results are presented in Table 6. The analysis shows that a linear model was produced with a value of 0.0001 (p < 0.05). It indicates a significant difference among the formulas, so this pH can serve as one of the responses in identifying and predicting the optimal cream formulation. The lack of fit value reflects the extent of deviation between the experimental results and the predicted model. The lack of fit value was 0.7346 (p > 0.05), which indicates no significant difference between the research data and the model's predictions. The software recommends a linear equation, in which stearic acid (A) has a coefficient of +4.74, and triethanolamine (B) has a coefficient of +6.04. The higher triethanolamine value in the equation indicates that it plays a dominant role in the cream's pH response. The graphical model of the two-component mixture pH test is shown in Figure 3. The graph shows a decrease in pH, which is attributed to stearic acid because it contains an acid group. Therefore, a higher stearic acid concentration results in a lower pH. Conversely, triethanolamine is a base that can increase the pH of the cream formulation.
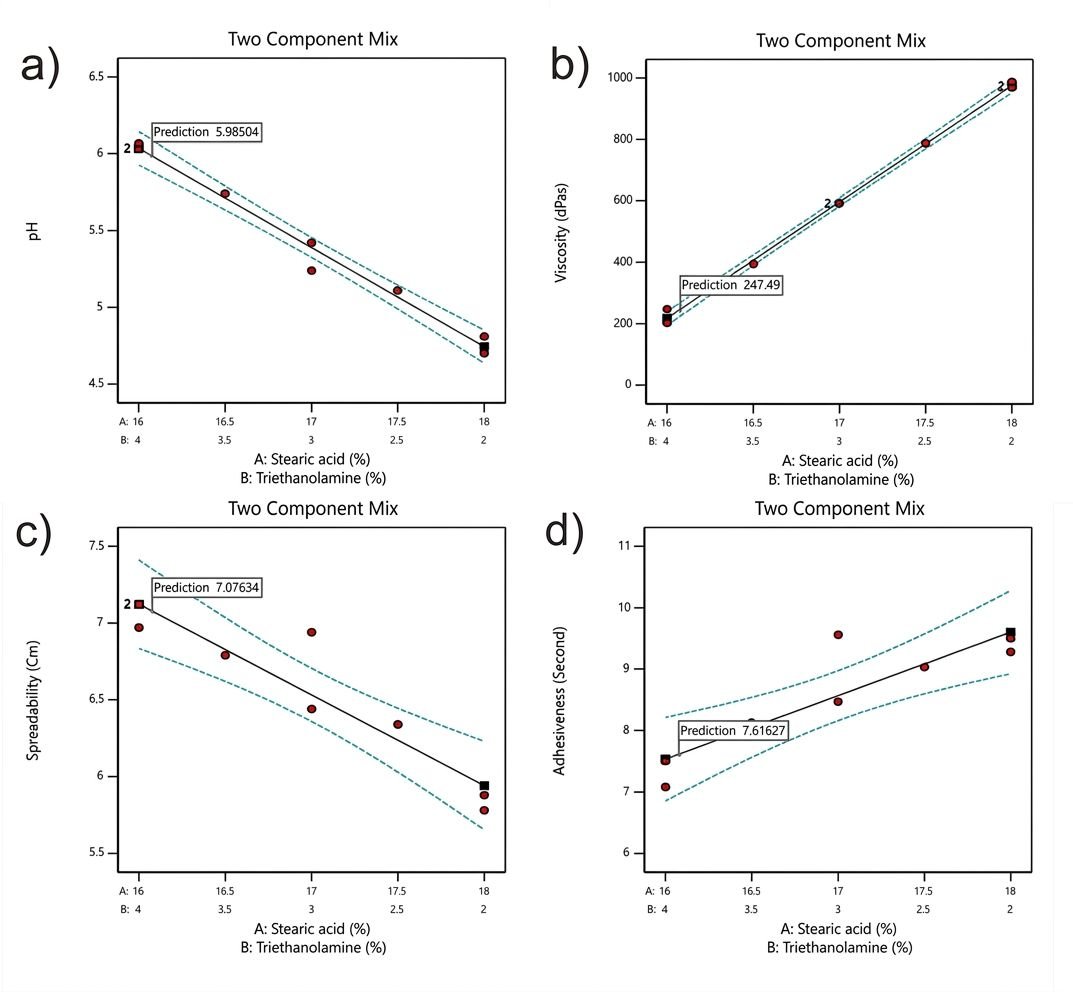
The viscosity test aims to determine the optimal cream thickness for easy application. When applied to the skin, the cream should spread easily, increasing its spreadability and ease of application (15). The acceptable viscosity range for cream formulation is 50-1000 dPas. The results of the cream evaluation are shown in Table 5, and all formulations meet the requirements. The viscosity test results were analyzed using the simplex lattice design method. The ANOVA statistical analysis results are shown in Table 6. The analysis indicates that the evaluation produced a linear model with a value of 0.0001 (p < 0.05). It suggests a significant difference among the formulas, so viscosity can be used as a response variable to identify and predict the optimal cream formulation. The lack of fit value reflects the extent of deviation between the experimental results and the predicted model. The lack of fit value is 0.8179 (p > 0.05), indicating no significant difference between the research data and the model’s predictions. The software recommends a linear equation. The stearic acid (A) has the coefficient of +975.01, while triethanolamine (B) has a coefficient of +271.87. It suggested that triethanolamine has a dominant effect on the cream’s viscosity. The graphical model of the two-component mixture pH test is shown in Figure 3. The graph demonstrates an increase in viscosity. Stearic acid can both reduce and increase viscosity. It is a fatty acid that can form a thick base in topical formulations, thus raising viscosity. Meanwhile, triethanolamine serves as an emulsifier in the aqueous phase and can reduce the formulation's viscosity.
The spreadability test evaluates how easily a cream formulation can be applied to the skin surface (15). A cream formulation with good spreadability has a diameter of 5-7 cm. The spreadability of the cream with a load of 250 g is shown in Table 5. All formulations meet the requirements. The spreadability test results were then analyzed using a simplex lattice design. The results of the ANOVA statistical analysis are shown in Table 6. The analysis shows that the evaluation produced a linear model with a value of 0.0008 (p < 0.05). It indicates a significant difference between the formulas, so spreadability can be used as one of the responses in determining and predicting the optimal cream formulation. The lack-of-fit value quantifies the magnitude of the deviation between the research results and the predicted equation. The lack of fit value obtained was 0.6118 (p> 0.05), indicating no significant difference between the research results and the model-predicted data. The equation recommended by the software is a linear model. The equation shows stearic acid (A) has a value of +5.94 and triethanolamine (B) has a value of +7.12. The equation indicates that stearic acid has a dominant effect on the cream's spreadability. The graphic model of the two-component mix spreadability test is shown in Figure 3. The graph shows a decrease in the cream's spreadability value. Spreadability is inversely proportional to cream viscosity: stearic acid increases the cream's thickness, thereby reducing its spreadability, while triethanolamine decreases the thickness, thereby enhancing spreadability.
The adhesiveness test aims to determine how long the cream can stay attached to the surface skin (15). The requirement for good adhesion time in a cream formulation is more than 4 seconds. The adhesion test results for the tamarind peel extract cream are shown in Table 5. All formulations meet the cream requirements. The adhesiveness test results were then analyzed using a simplex lattice design. The results of the ANOVA statistical analysis are shown in Table 6. The analysis shows that the evaluation produced a linear model with a value of 0.0005 (p < 0.05). It indicates a significant difference between the formulas, so this adhesiveness can be used as one of the responses in determining and predicting the optimal cream formulation. The lack of fit value describes the magnitude of the deviation between the research results and the predicted equation model. The lack of fit value obtained is 0.5940 (p> 0.05), indicating no significant difference between the research results and the model-predicted data. The equation recommended by the software is a linear model. The equation shows stearic acid (A) has a value of +9.60 and triethanolamine (B) has a value of +7.54. The equation indicates that stearic acid has a dominant effect on the cream's adhesiveness. The graphic model of the two-component mix adhesiveness test is shown in Figure 3. The graph shows an increase in the cream's adhesiveness. The more triethanolamine used and the less stearic acid added, the lower the cream's adhesiveness.
Verification and Additional Evaluation of the Optimum Formula
Prediction of the optimal formula based on suggestions from the simple lattice design, which considers the highest desirability value. Predictions for factors and responses are shown in Table 7. The desirability value is a value that describes the program's ability to produce the desired product more optimally (15). The desirability value improves as it approaches 1. The desirability value obtained is 0.967. The results of the predicted factors and responses are shown in Table 7. Based on the desirability value, the predicted optimal proportions are stearic acid (16.078%) and triethanolamine (3.922%). The response predictions are pH (4.795), viscosity (247.490 dPas), spreadability (7.076 cm), and adhesiveness (7.616 seconds). Verification is performed by comparing the predicted response with the actual response.
| Desirability | Stearic acid | Triethanolamine | pH | Spreadability | Adesiveness | Viscosity |
|---|---|---|---|---|---|---|
| 0.967 | 16.078% | 3.922% | 4.795 | 7.076 cm | 7.616 Second | 247.490 dPas |
The verification results are shown in Table 8. The results indicate that all responses show insignificant differences between predictions and actuals, indicating that the optimization research has been successfully carried out. The optimized cream has homogeneous characteristics, an orange color, a distinctive extract odor, and a soft, semi-solid consistency. The optimized cream was evaluated in vitro for photoprotection, including SPF, %Te, and %Tp.
| Response | Prediction | Actual | Verification | Conclusion | |
|---|---|---|---|---|---|
| t-table | t-calculated | ||||
| pH | 4.795 | 4.933 ± 0.0929 | 4.303 | 0.002 | No significant |
| Spreadability | 7.076 cm | 7.07 ± 0.5892 cm | 4.303 | 0.000 | No significant |
| Adhesiveness | 7.616 second | 7.37 ± 0.0916 seconds | 4.303 | 0.000 | No significant |
| Viscosity | 247.490 dPas | 247.32 ± 0.2354 dPas | 4.303 | 0.049 | No significant |
Additional evaluation of the optimal formula, including irritation tests, emulsion types, and measurements of SPF, %Te, and %Tp, was carried out. The evaluation results are shown in Table 9. Sun Protection Factor (SPF) is a standardized indicator of a sunscreen's effectiveness in protecting the skin from sunburn caused by UV-B rays. In vitro SPF determination was performed using Mansur's equation, yielding an SPF of 13.63 ± 1.01. According to FDA, this value is included in the moderate sun protection product (31). Erythema transmission (%Te) is the percentage of the amount of ultraviolet (UV) light energy transmitted (not absorbed or reflected) by a cosmetic, such as sunscreen, which causes skin redness or erythema. The % erythema transmission of the cream was 4.64 ± 1.19. It is included in the extra protection category (32). The % Pigmentation Transmission (%Tp) is the percentage of the amount of ultraviolet (UV) light energy transmitted by a material at a particular wavelength that can cause pigmentation or darkening of the skin color. The % pigmentation transmission of the cream is 12.37 ± 1.89, which is included in the sunblock category (32). The cream's photoprotective activity is due to the flavonoids in the tamarind peel extract. Due to their chemical structure, which includes conjugated double bonds and chromophore groups, Flavonoids have the ability to effectively absorb UV light in both UV A (320-400nm) and UV B (280-320nm).
| Irritation | Emulsion type | SPF | %Te | %Tp |
|---|---|---|---|---|
| Non-irritating | Oil in water | 13.63±1.01 | 4.64±1.19 | 12.37±1.89 |
Conclusion
Tamarind peel extract contains 47.7018±1.68 mg QE/g of flavonoids. Based on the simplex lattice design method, it was gathered that stearic acid and triethanolamine affected pH, viscosity, spreadability, and adhesiveness. The optimal ratio of stearic acid (16.078%) and triethanolamine (3.922%) is identified with a desirability of 0.967. Verification of the prediction using the simplex lattice design showed no significant difference, confirming the success of this research. The cream containing tamarind peel extract exhibits photoprotective activity, with an SPF value of 13.63 ± 1.01 (moderate sun protection), an erythema transmission percentage of 4.64 ± 1.19 (extra protection), and a pigmentation transmission percentage of 12.37 ± 1.89 (sunblock). The results of this photoprotective evaluation are more detailed than those of other natural sunscreens, which only report SPF values. In vivo research is necessary to determine the actual photoprotective effects.
Abbreviations
SLD= Simplex Lattice Design; UV= Ultraviolet; SPF= Sun Protection Factor; O/W= Oil-In-Water; %Te = Erythema Transmission; Fe = Flux of Erythema; %Tp= Pigmentation Transmission; Fp = Flux of Pigmentation.
Declarations
Conflict of Interest
The authors declare no conflicting interest.
Data Availability
Data supporting the findings of this study are available from the corresponding author upon reasonable request.
Ethics Statement
Not applicable.
Funding Information
Not applicable.
References
- Tang X, Yang T, Yu D, Xiong H, Zhang S. Current Insights and Future Perspectives of Ultraviolet Radiation (UV) Exposure: Friends and Foes to the Skin and Beyond the Skin. Environment International. 2024;185:108535. doi: https://doi.org/10.1016/j.envint.2024.108535
- Sultana S, Naz S, Akhtar N, Ijaz M, Huma S, Khan MS, et al. From Rays to Protection: How Sun Exposure Affects Our Skin and the Importance of Sunscreen. Recent Updates in Disease and Health Research; 2024. doi: https://doi.org/10.9734/bpi/rudhr/v9/729
- Breakell T, Kowalski I, Foerster Y, Kramer R, Erdmann M, Berking C, et al. Ultraviolet Filters: Dissecting Current Facts and Myths. JCM. 2024;13(10):2986. doi: https://doi.org/10.3390/jcm13102986
- Majeed M, Majeed S, Jain R, Mundkur L, Rajalakshmi HR, Lad P, et al. A Randomized Study to Determine the Sun Protection Factor of Natural Pterostilbene from Pterocarpus marsupium. Cosmetics. 2020;7(1):16. doi: https://doi.org/10.3390/cosmetics7010016
- Ruszkiewicz JA, Pinkas A, Ferrer B, Peres TV, Tsatsakis A, Aschner M. Neurotoxic Effect of Active Ingredients in Sunscreen Products, A Contemporary Review. Toxicology Reports. 2017;4:245-259. doi: https://doi.org/10.1016/j.toxrep.2017.05.006
- Kim M, Shin S, Ryu D, Cho E, Yoo J, Park D, et al. Evaluating the Sun Protection Factor of Cosmetic Formulations Containing Afzelin. Chem. Pharm. Bull. 2021;69(11):1039-1044. doi: https://doi.org/10.1248/cpb.c21-00398
- Salih H, Psomadakis C, George SMC. Sunscreens: A Narrative Review. Skin Health and Disease. 2024;4(6):1-10. doi: https://doi.org/10.1002/ski2.432
- Mansingh BB, Binoj J, Sai NP, Hassan SA, Siengchin S, Sanjay M, et al. Sustainable Development in Utilization of Tamarindus indica L. and Its By-products in Industries: A Review. Current Research in Green and Sustainable Chemistry. 2021;4:100207. doi: https://doi.org/10.1016/j.crgsc.2021.100207
- Heru Adha Prayogo, Rafita Yuniarti, Gabena Indrayani Dalimunthe, Minda Sari Lubis. Penentuan SPF (Sun Protection Factor) Ekstrak Etanol Kulit Buah Asam Jawa (Tamarindus indica L.). FJFSK. 2022;2(1):22-30. doi: https://doi.org/10.32696/fjfsk.v2i1.1369
- Li W, Huang R, Han S, Li X, Gong H, Zhang Q, et al. Potential of Tamarind Shell Extract against Oxidative Stress In Vivo and In Vitro. Molecules. 2023;28(4):1885. doi: https://doi.org/10.3390/molecules28041885
- José MTDAF, Pedrita AS, Emanuella CVP, Raimundo GDOJ, Fabrício SS, Jackson RGDSA, et al. Flavonoids as Photoprotective Agents: A Systematic Review. J. Med. Plants Res. 2016;10(47):848-864. doi: https://doi.org/10.5897/jmpr2016.6273
- Mawazi SM, Ann J, Othman N, Khan J, Alolayan SO, Al thagfan SS, et al. A Review of Moisturizers; History, Preparation, Characterization and Applications. Cosmetics. 2022;9(3):61. doi: https://doi.org/10.3390/cosmetics9030061
- Marissa Z, Mita SR, Kusumawulan CK, Sriwidodo S. Antioxidant and Photoprotective Activity of Bromelain Cream: An In Vitro and In Vivo Study. Cosmetics. 2025;12(2):41. doi: https://doi.org/10.3390/cosmetics12020041
- Ihara K, Hirota M, Akitsu T, Urakawa K, Abe T, Sumi M, et al. Effects of Emulsifying Components in the Continuous Phase of Cream on the Stability of Fat Globules and the Physical Properties of Whipped Cream. Journal of Dairy Science. 2015;98(5):2875-2883. doi: https://doi.org/10.3168/jds.2014-8870
- Endriyatno N, Nurhidayat L. Photoprotective Cream Containing Brown Seaweed (Sargassum Sp.) Extract: Optimization By Simplex Lattice Design. sciphar. 2025;4(3):109-116. doi: https://doi.org/10.58920/sciphar0403344
- Sartika Daulay A, Rahman F. The Determination of the Total Flavonoid Content of Yellow Wood Extracts, from Samarkilang, Central Aceh with Various Concentrations Ethanol Using Visible Spectrophotometry Method. Journal of Pharmaceutical and Sciences. 2023;1(Suppl 1):80–90. Doi: https://doi.org/10.36490/journal-jps.com.v6i5-si.391
- Wikantyasning ER, Astuti KF, Nurhakimah UF, Sula RD. Optimization and In Vitro Evaluation of Creams Formulation Containing Spirulina (Arthrospira platensis) Extract and Zinc Oxide Nanoparticles. Int J App Pharm. 2021;13(S1):34-37. doi: https://doi.org/10.22159/ijap.2021.v13s1.y0096
- Nabilla NH, Endriyatno NC. Formulation and Determination of SPF Value of Oryza sativa L. Extract Sunscreen Cream with Variations of Span 80 and Tween 8. Pharmasipha. 2025;9(2):23-33. doi: https://doi.org/10.21111/pharmasipha.v9i2.14604
- Wikantyasning ER, Wahyuni TT. Optimization and Formulation of Skin Lotion Contating Butterfly Pea (Clitoria ternatea) Flower Extract and Study on its Antioxidant Activity. BIO Web Conf. 2024;135:03001. doi: https://doi.org/10.1051/bioconf/202413503001
- More BH, Sakharwade SN, Tembhurne SV, Sakarkar DM. Evaluation for Skin Irritancy Testing of Developed Formulations Containing Extract of Butea monosperma for Its Topical Application. International Journal of Toxicology and Applied Pharmacology. 2013;3(1):10–3.
- Suryani, Putri AKP, Camalia RS. Formulation and Antioxidant Evaluation of Lotion Kleinhovia Leaves Extract. Bali 2017 International Conference Proceeding IPCET-17, CM3E-17, ABEMS-17, ICEEE-17, ICCEE-17, ICASE-17, ICAFE-17, EBHRM-17, LHHSS-17 & LEBHM-17. 2017;Oct 11–12:32–35. doi: https://doi.org/10.17758/eirai.iae1017104
- Mansur J de S, Breder MNR, Mansur MC d’Ascenção, Azulay RD. Determination of Sun Protection Factor (SPF) of Sunscreens by Ultraviolet Spectrophotometry. An Bras Dermatol Rio De Janeiro [Internet]. 1986;61(3):121–4. doi: https://doi.org/10.1590/S1516-93322004000300014
- Cumpelik BM. Analytical Procedures and Evaluation of Sunscreens. J Soc Cosmet Chem. 1972;23(6):333–45.
- Zhang QW, Lin LG, Ye WC. Techniques for Extraction and Isolation of Natural Products: A Comprehensive Review. Chin Med. 2018;13(1):1-26. doi: https://doi.org/10.1186/s13020-018-0177-x
- Gherdaoui D, Bouazza F, Ihadadene S, Yahoum MM, Lefnaoui S, Amrane A, et al. Kinetic Modeling, Comparative Investigations, and a New Approach to Quantifying the Global Extraction Yield of Algerian Pomegranate Peel Phenolic Compounds. AppliedChem. 2025;5(2):11. doi: https://doi.org/10.3390/appliedchem5020011
- Kanakal MM, Abdul Majid AM, Abdul Majid AS, Abdul Sattar M, Ajmi NS. Effect of Moisture Content on Microbial Contamination in Leaf Water Extract Powder. Toprocj. 2013;4(1):40-40. doi: https://doi.org/10.2174/2210289201304010040
- Endriyatno NC, Sa’ad M, Naufal MRA, Rochmawati, Wibowo BA. Green Synthesis and Characterization of ZnO Nanoparticles Using Rhizophora apiculata: Evaluation of Sun Protection Activity. Letters in Applied NanoBioScience Open-Access [Internet]. 2025;14(3):1–10. doi: https://doi.org/10.33263/LIANBS143.183
- Aparna B, Hema BP. Preliminary Screening and Quantification of Flavonoids in Selected Seeds of Apiaceae by UV-Visible Spectrophotometry with Evaluation Study on Different Aluminium Chloride Complexation Reaction. Ijst. 2022;15(18):857-868. doi: https://doi.org/10.17485/ijst/v15i18.131
- Shaikh JR, Patil M. Qualitative Tests for Preliminary Phytochemical Screening: An Overview. Int. J. Chem. Stud. 2020;8(2):603-608. doi: https://doi.org/10.22271/chemi.2020.v8.i2i.8834
- Chen MX, Alexander KS, Baki G. Formulation and Evaluation of Antibacterial Creams and Gels Containing Metal Ions for Topical Application. Journal of Pharmaceutics. 2016;2016:1-10. doi: https://doi.org/10.1155/2016/5754349
- FDA. Sunscreen Drug Products For Over-Thecounter Human Use [Stayed Indefinitely]. United States; 2004 p. 318.
- Kusmita L, Nur Prasetyo Edi A, Dwi Franyoto Y, Mutmainah, Haryanti S, Dwi Retno Nurcahyanti A. Sun Protection and Antibacterial Activities of Carotenoids from the Soft Coral Sinularia sp. Symbiotic Bacteria from Panjang Island, North Java Sea. Saudi Pharmaceutical Journal. 2023;31(8):101680. doi: https://doi.org/10.1016/j.jsps.2023.06.013