
REVIEW
Chemometrics in Pharmaceutical Formulation: A Two-Decade Bibliometric Review (2005-2025)
Sciences of Pharmacy|Vol. 5, Issue 2, pp. 226-238 (2026)
CC BY 4.0-2026 Authors
Views
Downloads
Shares
Received
Jan 27, 2026Revised
Mar 11, 2026Accepted
May 25, 2026Published
Jun 12, 2026
Abstract
Chemometrics is essential in modern pharmaceutical development for enhancing analysis and quality control. Despite its importance, the evolutionary trajectory and thematic shifts of chemometrics within pharmaceutical formulation have not been comprehensively synthesized. This study aims to explore publication trends, scientific collaborations, and keywords in research related to the application of chemometrics to pharmaceutical formulations, using a bibliometric approach. Data were retrieved from Scopus (2005–2025) using a structured search strategy focusing on "pharmaceutical formulation", "drug formulation", and "pharmaceutical development". The search was limited to English-language original articles or reviews. Bibliometric mapping was performed using VOSviewer and the Bibliometrix R-package, applying a minimum keyword occurrence of 5, full counting method, and association strength normalization. A total of 516 documents were identified. Publications have increased significantly in the last decade, with research articles being the dominant document type. Egypt and the United States are the countries with the highest contribution and citation impact. The Journal of Pharmaceutical and Biomedical Analysis is ranked highest in terms of the number of publications and influence. Khan, Mansoor A., is the most productive author, while the Faculty of Pharmacy at Cairo University and the FDA are the most productive organizations. Keyword analysis revealed various main themes and a division into seven clusters, highlighting an evolutionary shift from traditional analysis toward Process Analytical Technology (PAT) and Quality by Design (QbD). These findings highlight the importance of cross-disciplinary collaboration and the potential for further exploration of novel approaches in pharmaceutical product development.
Introduction
Over the past two decades, data-driven approaches have become increasingly integral to pharmaceutical formulation, aiming to address the complexity of product development and improve process efficiency. Among these approaches, chemometrics, defined as the application of mathematical and statistical techniques to extract relevant information from complex chemical data, has emerged as a powerful tool in pharmaceutical research (1). In the context of formulation science, chemometrics supports optimization of drug composition, prediction of stability, and modeling of relationships between formulation parameters and critical quality attributes (CQA) (2).
The role of chemometrics has become particularly prominent with the adoption of the Quality by Design (QbD) paradigm, which emphasizes scientific understanding of formulation processes and risk-based control strategies. QbD is supported by international guidelines such as ICH Q8 (R2), Q9, and Q10, which encourage the use of Design of Experiments (DoE), Principal Component Analysis (PCA), and Partial Least Squares (PLS) in pharmaceutical product development (3). Chemometrics supports the integration of Process Analytical Technology (PAT) and QbD principles, enabling real-time monitoring and control of pharmaceutical processes. Multivariate Statistical Process Control (MSPC) is often used to analyze complex datasets, ensuring consistent product quality (4, 5). Chemometric tools are employed to study the stability of active pharmaceutical ingredients (APIs) under stress conditions (e.g. , light, temperature, pH), which is essential for establishing shelf-life prediction models and regulatory stability documentation. These studies help identify degradation pathways and validate analytical methods for impurity detection (6). Chemometric methods like PLS and Principal Component Regression (PCR) are used for the simultaneous determination of multiple drugs in complex mixtures without requiring separation steps. These methods are efficient, cost-effective, and precise for routine quality control (7–10). Chemometrics enhances spectroscopic techniques (e.g. , UV-Vis, NIR, Raman) for non-destructive analysis of formulations. It enables the identification of APIs, excipients, and impurities, even in overlapping spectral regions, and also contributes to sustainable practices by optimizing chromatographic methods, reducing solvent use, and minimizing environmental impact (11–14). Chemometric approaches, combined with spectroscopic imaging, are used to detect counterfeit products, assess content uniformity, and monitor polymorphic transitions in formulations (13, 15).
Despite the growing applications, existing studies are focused on experimental and analytical aspects, with limited efforts to systematically evaluate global research trends in this field. However, in 2023, a bibliometric review analysis on chemometrics in spectroscopic techniques within the pharmaceutical field was conducted. While this study provided insights into spectroscopic applications, it primarily focused on analytical monitoring. There remains a significant gap in understanding how chemometrics is integrated across the broader spectrum of pharmaceutical formulation, including dosage form design, stability modeling, and multi-parameter optimization (16). Bibliometric analysis serves as a quantitative method used to evaluate the structure and dynamics of scientific literature by examining publication patterns, key authors and institutions, collaboration networks, and emerging research themes (17). Such analyses provide strategic insights into the intellectual development of a field and can help researchers identify knowledge gaps and future research opportunities.
In particular, there is a lack of comprehensive bibliometric analyses that specifically address the role of chemometric techniques in pharmaceutical formulation. Therefore, this study aims to fill this gap by providing a detailed bibliometric evaluation from 2005 to 2025, highlighting publication trends, scientific collaborations, and keyword co-occurrences. The findings are expected to provide a structured understanding of research progress and support future investigations in this interdisciplinary field.
Methodology
Search Strategy and Data Collection
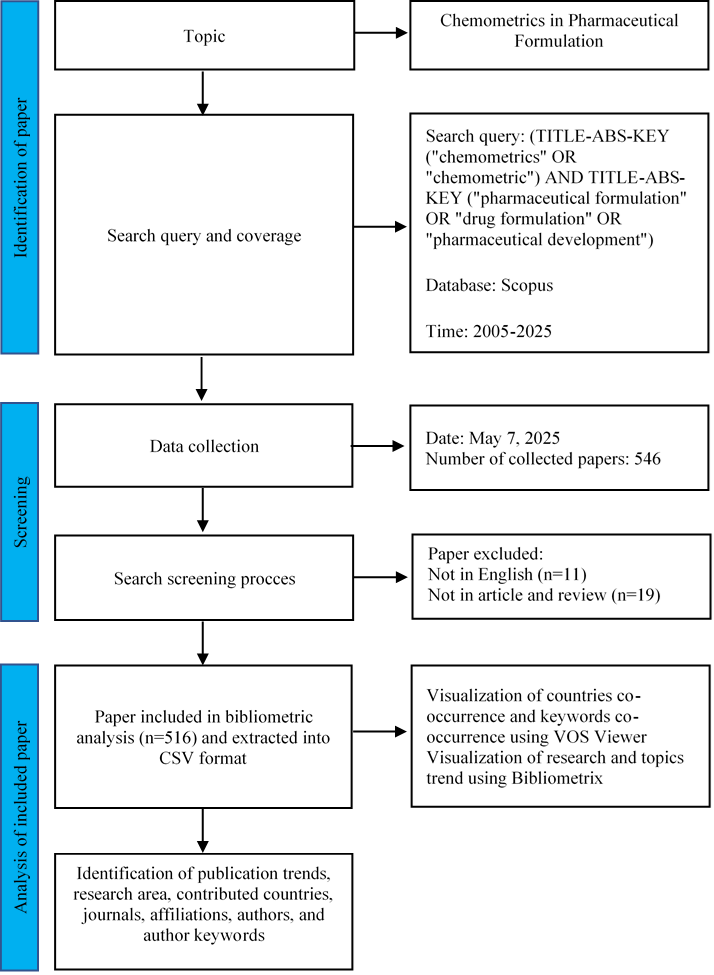
The method used in data collection is illustrated in Figure 1. A comprehensive literature search was performed using the Scopus database due to its broad coverage of peer-reviewed literature in pharmaceutical and analytical sciences. The search was conducted on May 7, 2025, covering publications from January 1, 2005, to May 7, 2025. The search strategy was designed to retrieve relevant studies focusing on the application of chemometric techniques in pharmaceutical formulation. The Boolean search string used was: TITLE-ABS-KEY ("chemometrics" OR "chemometric") AND TITLE-ABS-KEY ("pharmaceutical formulation" OR "drug formulation" OR "pharmaceutical development"). This string was applied to the title, abstract, and keywords fields to ensure comprehensive retrieval. The use of wildcards (e.g. , chemometric) allowed the inclusion of various term variants. To maintain the quality and focus of the dataset, inclusion criteria were applied: (1) documents must be written in English, (2) document type limited to research articles and review papers. Other document types, such as letters, editorials, notes, book chapters, and conference proceedings, were excluded. Following the application of these criteria, the retrieved documents were manually screened for thematic relevance. After removing duplicates and irrelevant entries, a total of 516 documents were included for final analysis.
Data Extraction
To avoid discrepancies due to daily updates in the Scopus database, all bibliographic data were extracted on the same date as the search (May 7, 2025). The metadata, including titles, authors, abstracts, source journals, keywords, affiliations, citations, and references, were exported in comma-separated values (CSV) format for further processing (18), allowing structured integration into multiple bibliometric software platforms.
Bibliometric Analysis and Visualization
The bibliometric analysis was conducted using a combination of tools: 1) Microsoft Excel 365 - to perform initial data cleaning, compute annual publication trends, and tabulate citation data, 2) VOSviewer version 1.6.20 (www.vosviewer.com) - for visualizing bibliometric networks, including keyword co-occurrence and citation (document, sources, authors, and countries), 3) Bibliometrix R package (version 4.4.3) and its web interface, Biblioshiny - for advanced statistical analysis of keyword trends, source impact, and thematic mapping.
The following parameters were strictly applied: Minimum keyword occurrence: 5, Counting method: full counting, Normalization method: association strength. Synonymous or closely related keywords (e.g. , “chemometric” and “chemometrics”) were manually reviewed and merged into a unified term. This harmonization step helped reduce fragmentation in the network visualization and enhanced the robustness of thematic clustering. In VOSviewer, term maps were constructed where each node (bubble) represented a keyword or author, with size indicating frequency and lines showing the strength of relationships. Color-coded clusters were used to group terms thematically (19, 20). Biblioshiny further enabled the performance analysis of prolific authors, journals, and countries, as well as the trend topic evolution over time.
Results and Discussion
Figure 1 shows that, based on data from 2005 to 2025, there were 546 articles published on chemometrics in the field of pharmaceutical formulation retrieved from the Scopus database. Only 516 articles met the inclusion requirements. These research articles involved 2683 authors across 232 journals and represented contributions from 77 countries. This dataset reflects a relatively broad and internationally distributed set of publications in chemometric applications within pharmaceutical formulation. The dataset was then analyzed based on publication trends by year, document type, research area, geographic distribution, journal, and authors’ contributions, and analysis based on keywords and research focus.
Trends by Years
The trend of chemometric publications in the pharmaceutical formulation field in the Scopus core database was analyzed based on year and research area. Distribution chart of publications by the year, as can be seen in Figure 2.
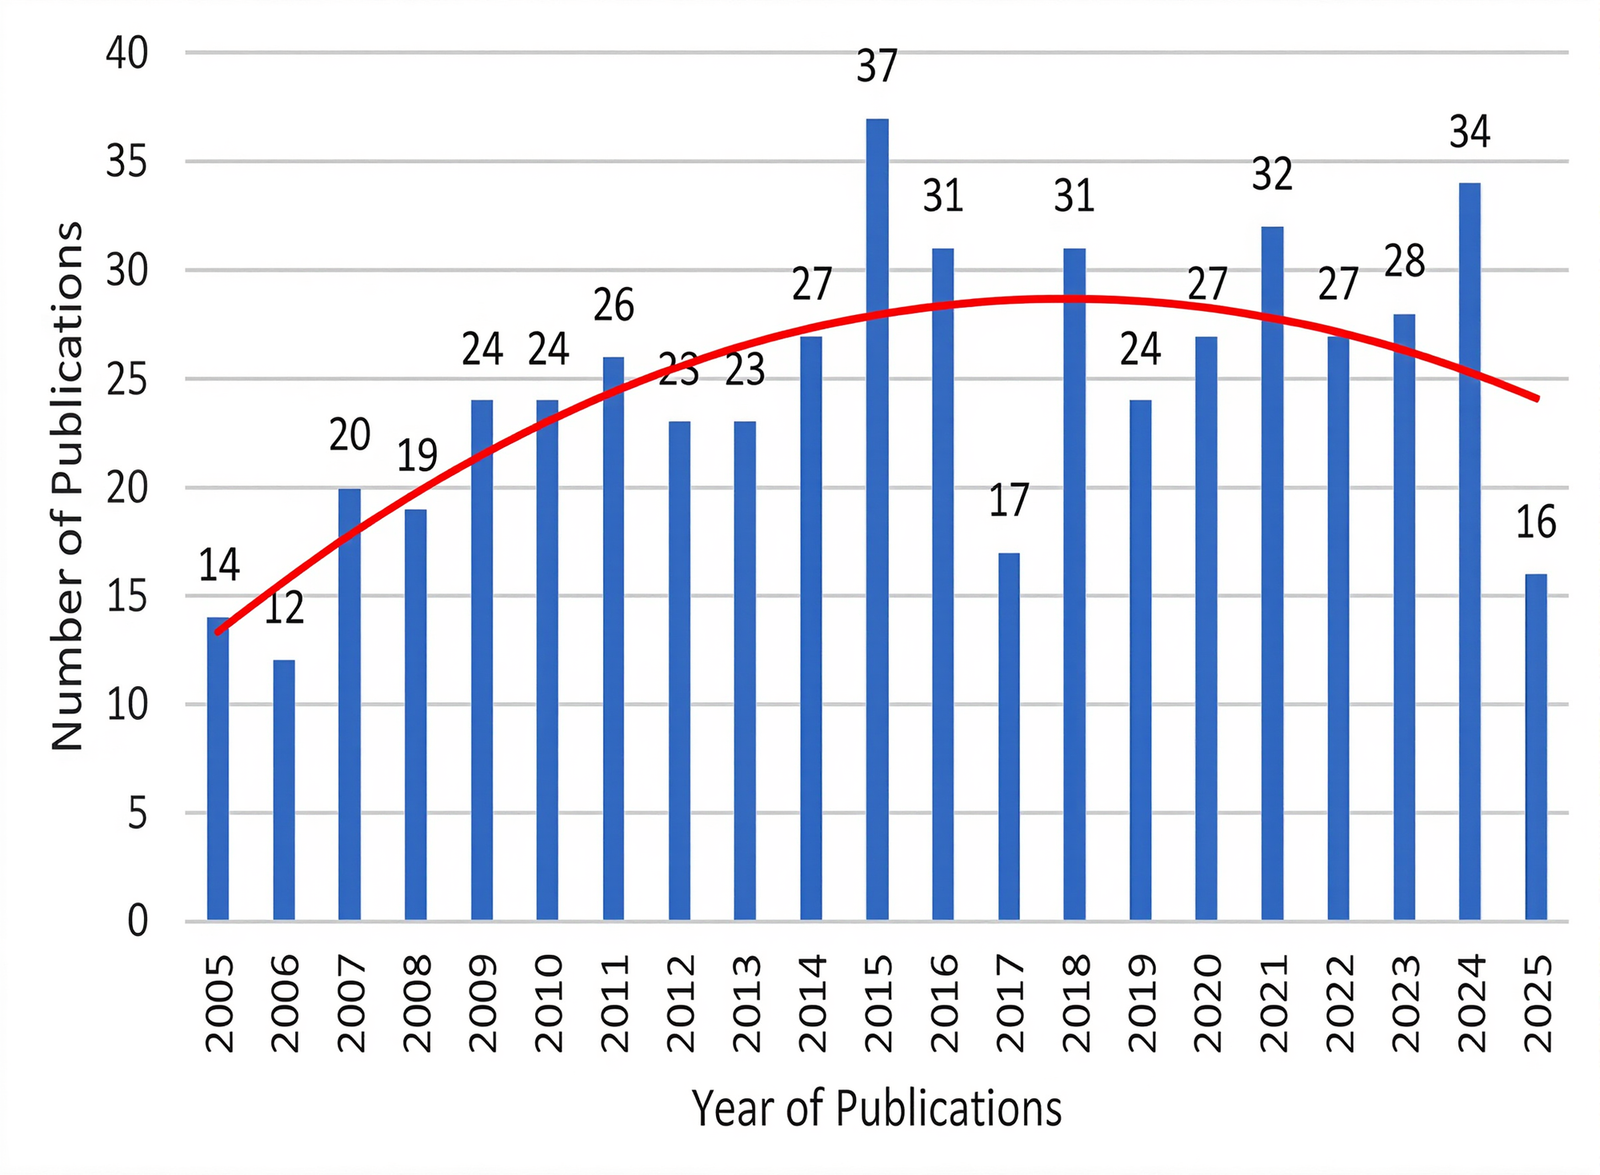
This figure represents the publication trend of papers between 2005 and 2025. Based on Figure 2, annual scientific publication trends indicate that, after a period of growth and stabilization, the volume of indexed documents shows a distinct pattern. In the early period, from 2005 to 2015, the number of publications increased consistently, rising from 14 to a peak of 37. This trajectory reflects the early integration of multivariate analysis in pharmaceutical formulation protocols, driven by increasing adoption of data-driven approaches and improvements in computational capabilities during this period. However, after reaching its peak in 2015, the publication volume fluctuated, with a notable decrease in 2017 (17 publications) before stabilizing between 24 and 34 publications annually through 2024. The apparent decline in 2025 should be interpreted cautiously, as the dataset includes only partial-year data up to May 2025, which may not fully capture ongoing publication outputs for the complete calendar year. Therefore, this decline does not reflect an actual reduction in research activity but rather incomplete data coverage.
Document Type and Research Area
Publication analysis based on document type and research area aims to identify the most frequently conducted research types and relevant and dominant scientific fields within the topic under study. Both are crucial for understanding the direction of research development and the contributions of various disciplines to the topic (21). The distribution of documents by type is shown in Figure 3, and the distribution by research area is shown in Table 1 and Figure 4.
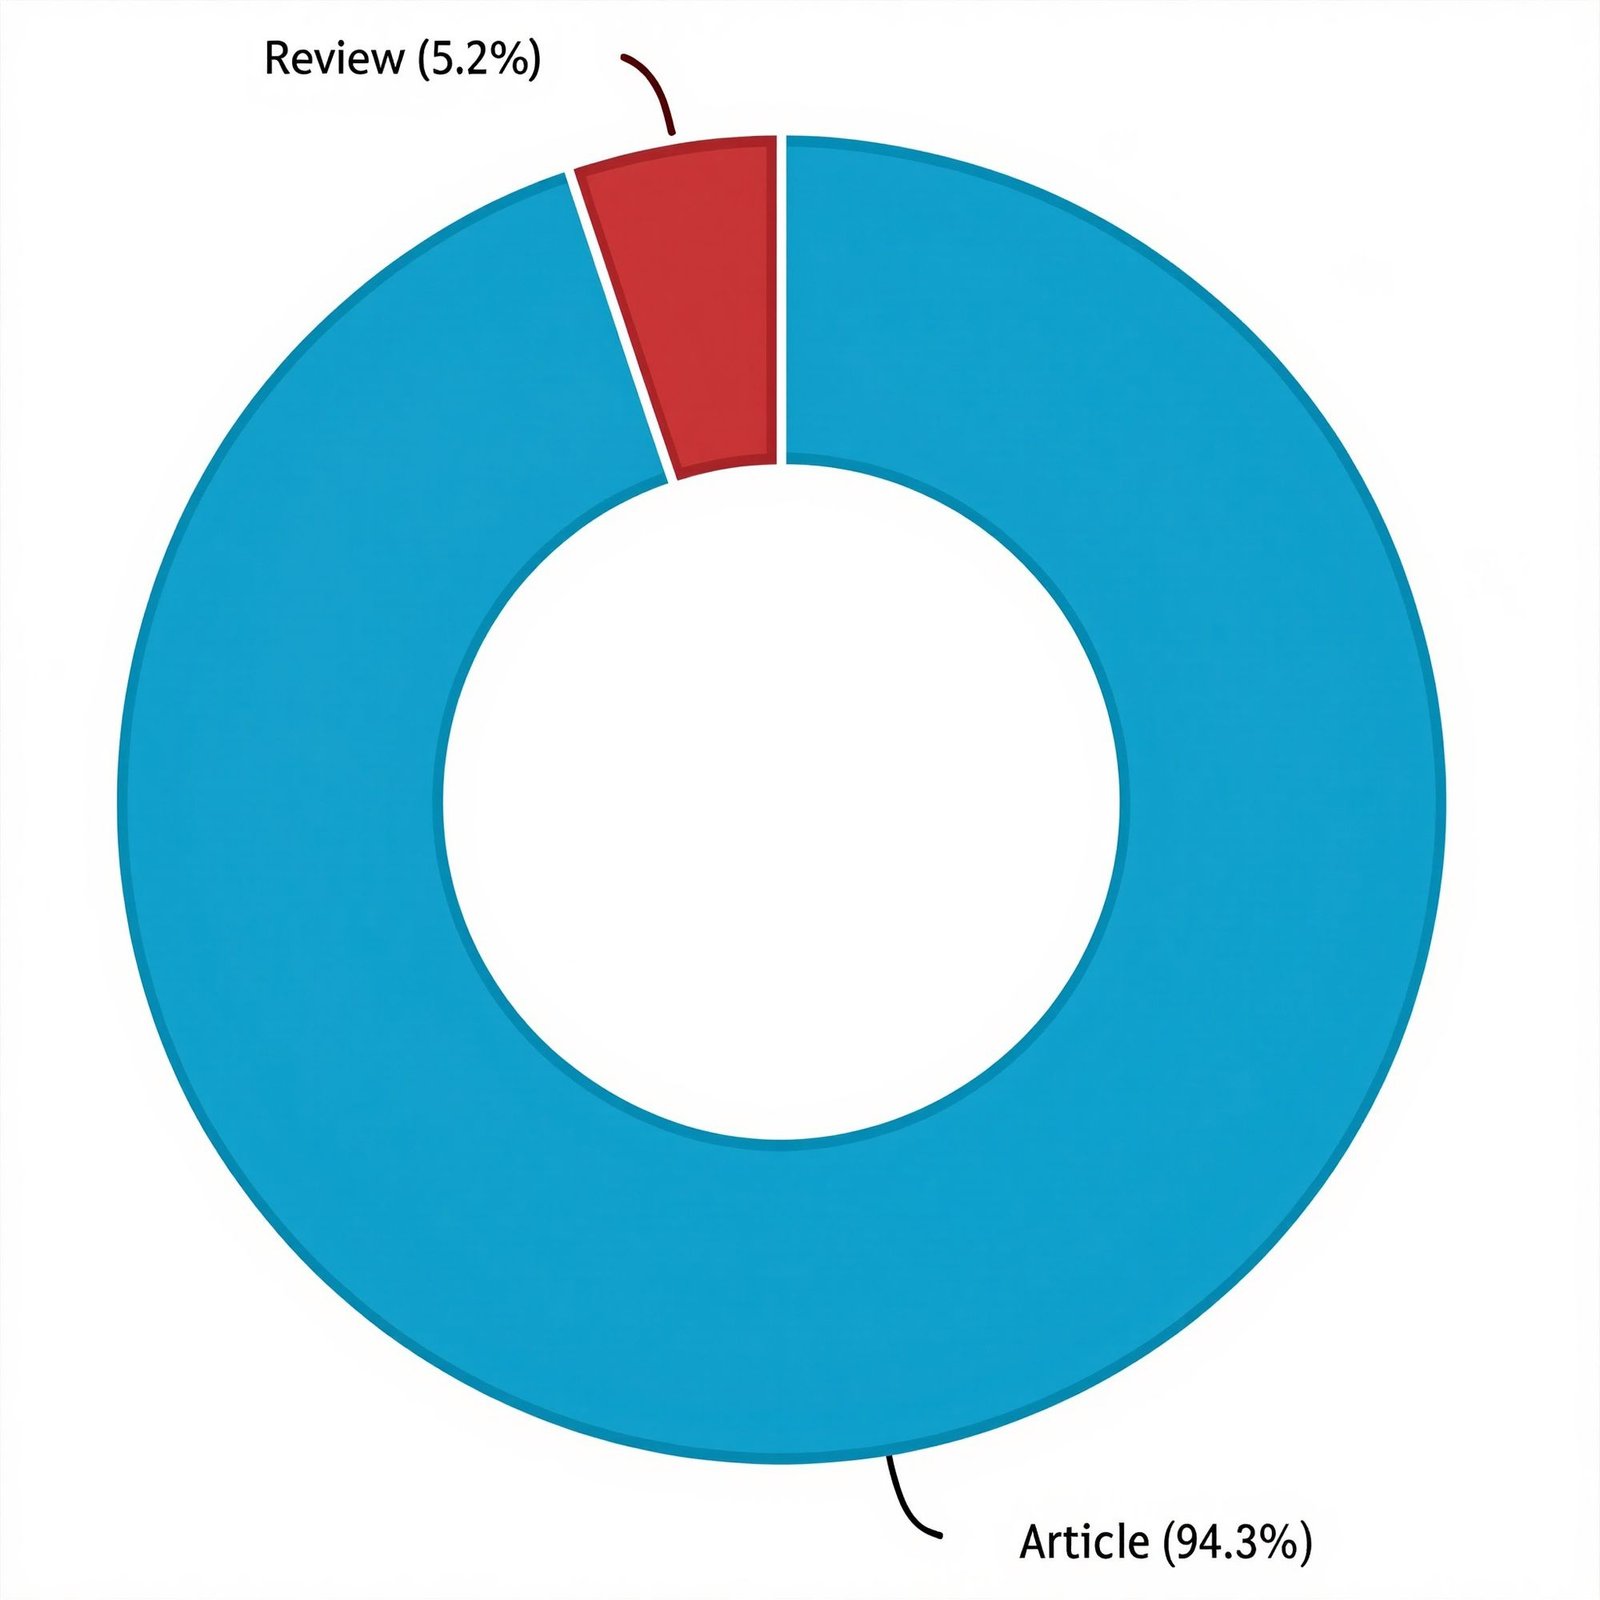
Based on the distribution of publications between 2005 and 2025, the dominant publication type was original articles (94.8%), while review articles accounted for only 5.2%. This distribution indicates that the field is primarily driven by experimental and applied research rather than synthesis-based studies. The relatively low proportion of review articles suggests an opportunity for more integrative and critical assessments in this domain.
| Rank | Research Area | Documents |
|---|---|---|
| 1st | Pharmacology, Toxicology, and Pharmaceutics | 286 |
| 2nd | Chemistry | 272 |
| 3rd | Biochemistry, Genetics, and Molecular Biology | 131 |
| 4th | Physics and Astronomy | 55 |
| 5th | Medicine | 48 |
| 6th | Chemical Engineering | 39 |
| 7th | Environmental Science | 23 |
| 8th | Computer Science | 21 |
| 9th | Engineering | 18 |
| 10th | Materials Sciences | 17 |
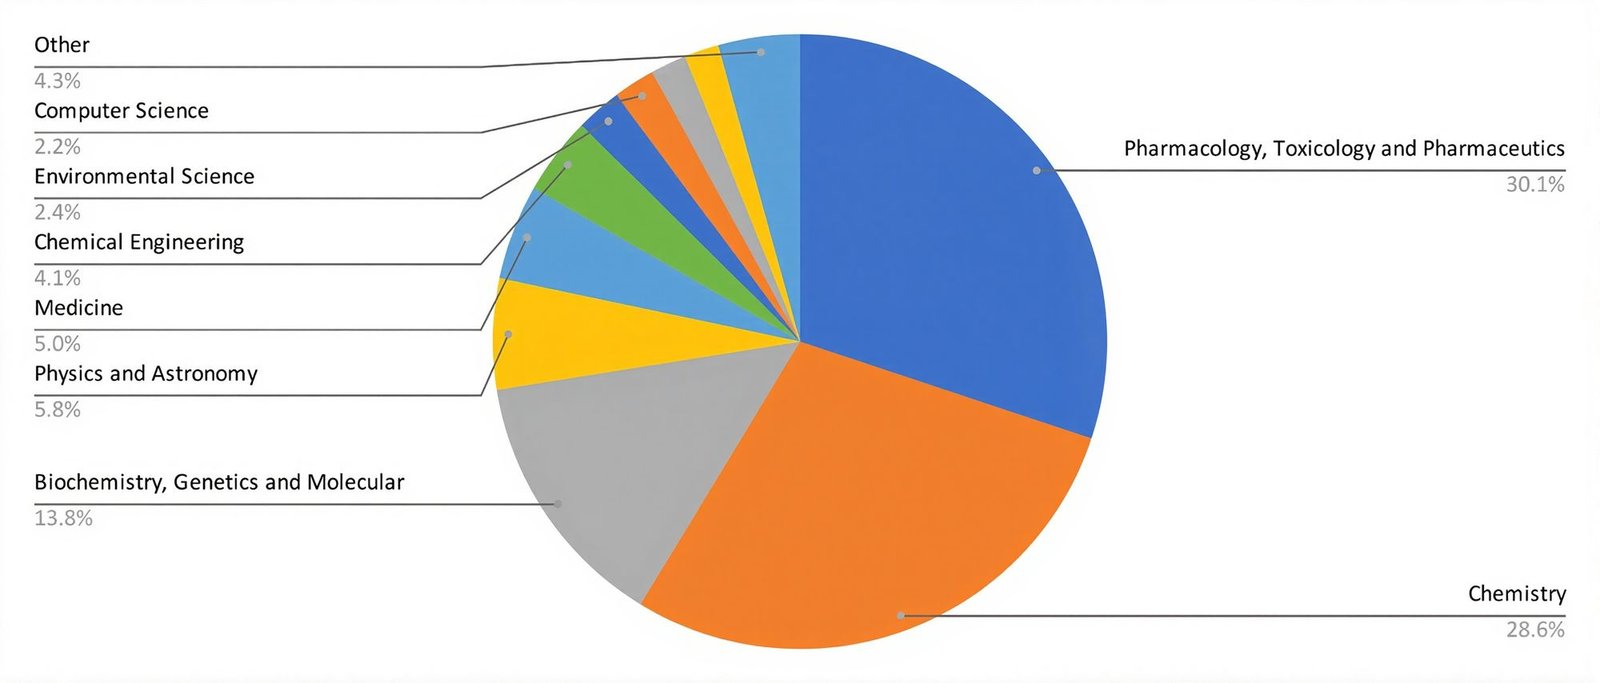
Based on Table 1 and Figure 4, illustrate the distribution of publications across various research areas. The majority of publications are concentrated in Pharmacology, Toxicology, and Pharmaceutics, which account for 30.1%, followed closely by Chemistry at 28.6%. These two fields dominate the research landscape, reflecting the significant scientific interest and activity within these disciplines (22). Biochemistry, Genetics, and Molecular Biology represents the third most prominent research area, contributing 13.8% of the total publications, indicating a multidisciplinary overlap in research involving bioactive compounds or pharmaceutical formulations (23). Other notable fields include Physics and Astronomy (5.8%) and Medicine (5.0%). Meanwhile, Chemical Engineering, Environmental Science, Computer Science, and Engineering show relatively lower contributions, each comprising less than 5%. The other category includes additional disciplines not specified individually and collectively accounted for 4.3% of publications.
Geographic Distribution
A geographic distribution analysis was conducted to determine each country's contribution to scientific publications related to this topic. This approach can provide an overview of the global distribution of research activity and identify countries that are centers of scientific development in this field (24). Table 2 displays the 10 countries with the highest number of publications, and Figure 5 displays a network visualization of collaborations among various countries involved in this topic.
| Rank | Country | Documents (%) | Citations |
|---|---|---|---|
| 1st | Egypt | 90 (17.44) | 1, 503 |
| 2nd | United States | 61 (11.82) | 1, 854 |
| 3rd | India | 56 (10.85) | 364 |
| 4th | Iran | 48 (9.30) | 904 |
| 5th | Brazil | 34 (6.59) | 732 |
| 6th | Saudi Arabia | 30 (5.81) | 409 |
| 7th | China | 23 (4.46) | 624 |
| 8th | Italy | 23 (4.46) | 344 |
| 9th | Romania | 20 (3.88) | 409 |
| 10th | Japan | 18 (3.49) | 247 |
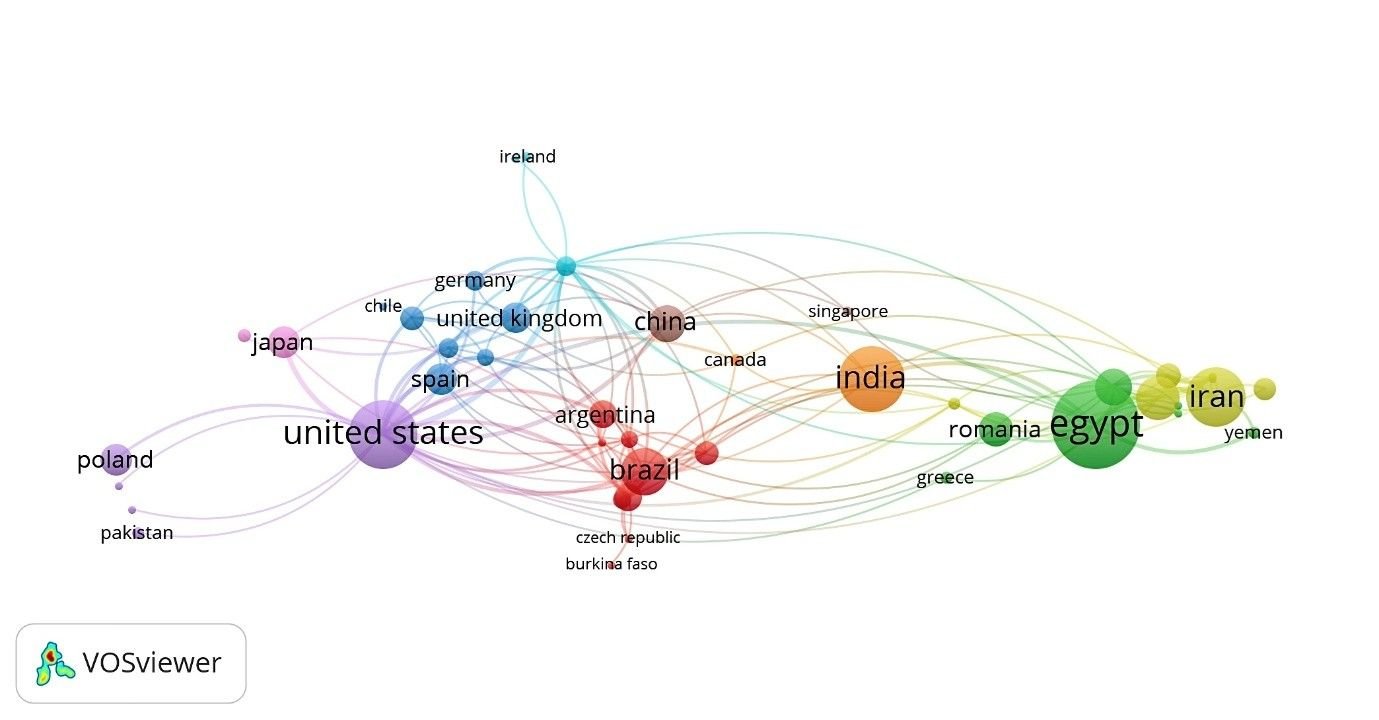
The table and network visualization present the top 10 countries contributing to publications in the analyzed research area. The geographic mapping (Table 2) reveals that Egypt and the United States are the primary hubs for this research domain. While Egypt leads in publication volume (17.44%), the United States recorded the highest citation impact (1, 854 citations), indicating that its outputs serve as central reference points in the field. Figure 5 illustrates the international collaboration among these countries. The size of the nodes corresponds to the number of documents, while the links indicate co-authorship relationships. The visualization highlights the United States, Egypt, India, Iran, and Brazil as central nodes with dense linkages, suggesting their prominent roles in global research networks. This indicates that not only do these countries contribute significantly in terms of publication quantity, but they also engage actively in international scientific collaborations (25).
Publishing Journal and Authors’ Contribution
The analysis of the publishing journal and authors' contributions aims to identify publication sources, contributors, and institutions most active in research related to this topic. The ranking is based on the 10 journals with the highest number of documents, reflecting the most productive and relevant publication channels in this field. Furthermore, the top 10 authors demonstrating high productivity in producing scientific publications, as well as the 10 institutions that are centers of research activity, are also analyzed. The results of this analysis can provide an overview of key actors in the development of science in the field of chemometrics, particularly in pharmaceutical formulations, as well as the potential for future scientific collaboration. The top 10 journals are shown in Table 3, the top 10 most productive authors are shown in Table 4, and the top 10 affiliations are shown in Figure 5.
| Rank | Journals | Publications (%) | Citations |
|---|---|---|---|
| 1st | Journal of Pharmaceutical and Biomedical Analysis | 38 (7.36) | 1, 961 |
| 2nd | International Journal of Pharmaceutics | 32 (6.20) | 682 |
| 3rd | Spectrochimica Acta – Part A: Molecular and Biomolecular Spectroscopy | 30 (5.81) | 730 |
| 4th | Journal of Pharmaceutical Sciences | 21 (4.07) | 803 |
| 5th | Journal of AOAC International | 16 (3.10) | 98 |
| 6th | Analytica Chimica Acta | 15 (2.91) | 397 |
| 7th | Chemometrics and Intelligent Laboratory Systems | 11 (2.13) | 243 |
| 8th | AAPS Pharmscitech | 10 (1.94) | 215 |
| 9th | European Journal of Pharmaceutics and Biopharmaceutics | 9 (1.74) | 309 |
| 10th | International Journal of Electrochemical Science | 9 (1.74) | 274 |
Based on Table 3, the top ten journals with the highest number of articles show a tendency for research topics to be spread across journals focused on pharmaceuticals, chemical analysis, and spectroscopy. The Journal of Pharmaceutical and Biomedical Analysis ranked first with 38 publications (7.36%) and recorded the highest number of citations, at 1, 961, indicating its significant influence in the scientific community. This was followed by the International Journal of Pharmaceutics in second place with 32 publications (6.20%) and 682 citations, and Spectrochimica Acta – Part A: Molecular and Biomolecular Spectroscopy in third place with 30 publications (5.81%) and 730 citations. These three journals demonstrate their strategic position as primary publication outlets for their topics. Other journals, such as the Journal of Pharmaceutical Sciences, Journal of AOAC International, and Analytica Chimica Acta, also recorded significant contributions, albeit with lower publication numbers. Several other journals, such as Chemometrics and Intelligent Laboratory Systems and AAPS PharmSciTech, highlight aspects of pharmaceutical analysis methodology and technology, demonstrating the diversity of research approaches used. Overall, this data reflects that research topics are spread across various journals with an interdisciplinary focus, spanning pharmacy, analytical chemistry, spectroscopy, and chemometrics, supporting the complexity and breadth of scientific coverage in this field (12).
| Rank | Author | Publications (%) | Citations |
|---|---|---|---|
| 1st | Khan, Mansoor A. | 17 (3.29) | 722 |
| 2nd | Sohrabi, Mahmoud Reza | 15 (2.91) | 95 |
| 3rd | Otsuka, Makoto | 14 (2.71) | 215 |
| 4th | Rahman, Ziyaur | 12 (2.33) | 418 |
| 5th | Aboul-Enein, Hassan Y. | 12 (2.33) | 209 |
| 6th | Norouzi, Parviz | 11 (2.13) | 240 |
| 7th | Riahi, Siavash | 11 (2.13) | 240 |
| 8th | Bunaciu, Andrei A. | 10 (1.94) | 189 |
| 9th | Ganjali, Mohammad Reza | 9 (1.74) | 199 |
| 10th | Hattori, Yusuke | 9 (1.74) | 125 |
Based on the analysis of author contributions, presented in Table 4, the top ten most prolific authors in scientific publications on this topic demonstrate the active involvement of a number of researchers. Khan, Mansoor A. , ranks first with 17 publications (3.29%) and 722 citations, demonstrating not only high productivity but also significant influence within the academic community. Next, Sohrabi, Mahmoud Reza, ranks second with 15 publications (2.91%), albeit with a lower number of citations (95), which may indicate that some of his work is relatively new or has not yet been widely cited. Other authors, such as Otsuka, Makoto, Rahman, Ziyaur, and Aboul-Enein, Hassan Y. , also made significant contributions with significant numbers of publications and citations.
Several other names on the list, such as Norouzi, Parviz, and Riahi, Siavash, indicate the presence of a group of researchers likely working in the same collaboration or on related research topics, judging by the similarity in the number of publications and citations. This data not only describes the authors who are leading in the development of the study topic, but can also be a reference for potential research collaborations or primary references in further studies (26).
Analysis of contributions by institutional affiliation, as shown in Table 5, reveals the top ten organizations most active in producing scientific publications related to chemometrics in pharmaceutical formulations. The Faculty of Pharmacy and Cairo University ranked first with 42 documents, reflecting the central role of educational and research institutions in developing research in this field. In third place, the Food and Drug Administration (FDA) was listed with 20 documents, demonstrating the significant contribution of this regulatory agency, which is also active in scientific publications, particularly regarding aspects of analysis, quality control, and pharmaceutical policy (27). Furthermore, institutions such as Beni-Suef University and Universidade Estadual de Campinas also stood out with 17 and 16 documents, respectively, demonstrating the strong academic interest in this field from Egypt and Brazil.
The presence of several branches of Islamic Azad University and the University of Tehran demonstrates the consistent contributions of institutions in Iran, while Musashino University of Japan and the Consejo Nacional de Investigaciones Científicas y Técnicas (CONICET) of Argentina add a broader geographic dimension to global research collaboration. These data illustrate that research on this topic involves institutions from various countries with diverse academic backgrounds, reflecting the global and collaborative nature of scientific development in this field (28).
| Rank | Organization | Documents |
|---|---|---|
| 1st | Faculty of Pharmacy | 42 |
| 2nd | Cairo University | 42 |
| 3rd | Food and Drug Administration | 20 |
| 4th | Beni-Suef University | 17 |
| 5th | Universidade Estadual de Campinas | 16 |
| 6th | Islamic Azad University, North Tehran Branch | 15 |
| 7th | University of Tehran | 13 |
| 8th | Islamic Azad University | 13 |
| 9th | Musashino University | 13 |
| 10th | Consejo Nacional de Investigaciones Científicas y Técnicas | 12 |
Keyword Network Analysis
Keyword Network Analysis is an important approach in bibliometric studies that aims to identify key topics, research trends, and relationships between concepts that frequently appear in scientific publications. By analyzing the keywords most frequently used by authors, one can gain insight into the dominant research focus, the depth of the issues studied, and potential research areas that can be further explored. Furthermore, visualizing keyword networks also helps in understanding how the relationships between topics develop over time and uncovers interconnected research clusters within a broader scope of study (29). Table 6 presents the top 10 highly frequent author keywords, Figure 6 presents a network visualization of keyword co-occurrence, Figure 7 presents a density visualization of keyword co-occurrence, Figure 8 presents an overlay map of keyword co-occurrence and clustering, and Figure 9 presents clustering of the author’s keywords.
| Rank | Author Keywords | Occurences |
|---|---|---|
| 1st | Chemometrics | 133 |
| 2nd | Process Analytical Technology | 25 |
| 3rd | Spectrophotometry | 25 |
| 4th | Partial Least Squares | 24 |
| 5th | Principal Component Analysis | 22 |
| 6th | Paracetamol | 22 |
| 7th | Near-infrared Spectroscopy | 19 |
| 8th | Multivariate Calibration | 16 |
| 9th | Quality by Design | 15 |
| 10th | Raman Spectroscopy | 15 |
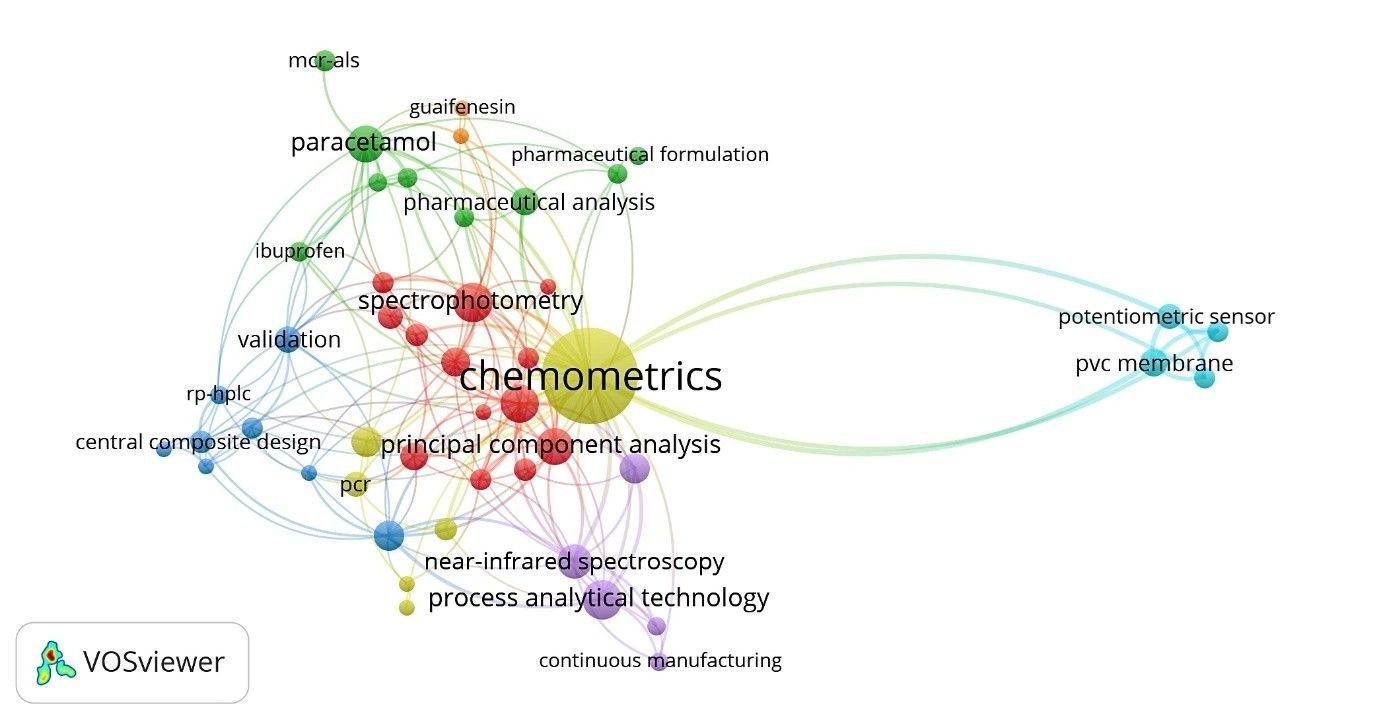
Table 6 and Figure 6 present a network visualization of keyword co-occurrence in research on chemometrics applied to pharmaceutical formulation. In this visualization, keywords that frequently appear together in the same publications are grouped and linked, forming clusters represented by different colors. The size of each node reflects the frequency of occurrence of the keyword, while the thickness of the lines indicates the strength of the association between the keywords (30). The central keyword “chemometrics” highlights its key role in research, surrounded by related terms like “principal component analysis”, “spectrophotometry”, “process analytical technology”, and “partial least squares”, which represent main research themes and methods. Other specific terms, such as “paracetamol”, “ibuprofen”, and “potentiometric sensor”, indicate its broad application in analyzing and controlling the quality of pharmaceutical formulations and materials.
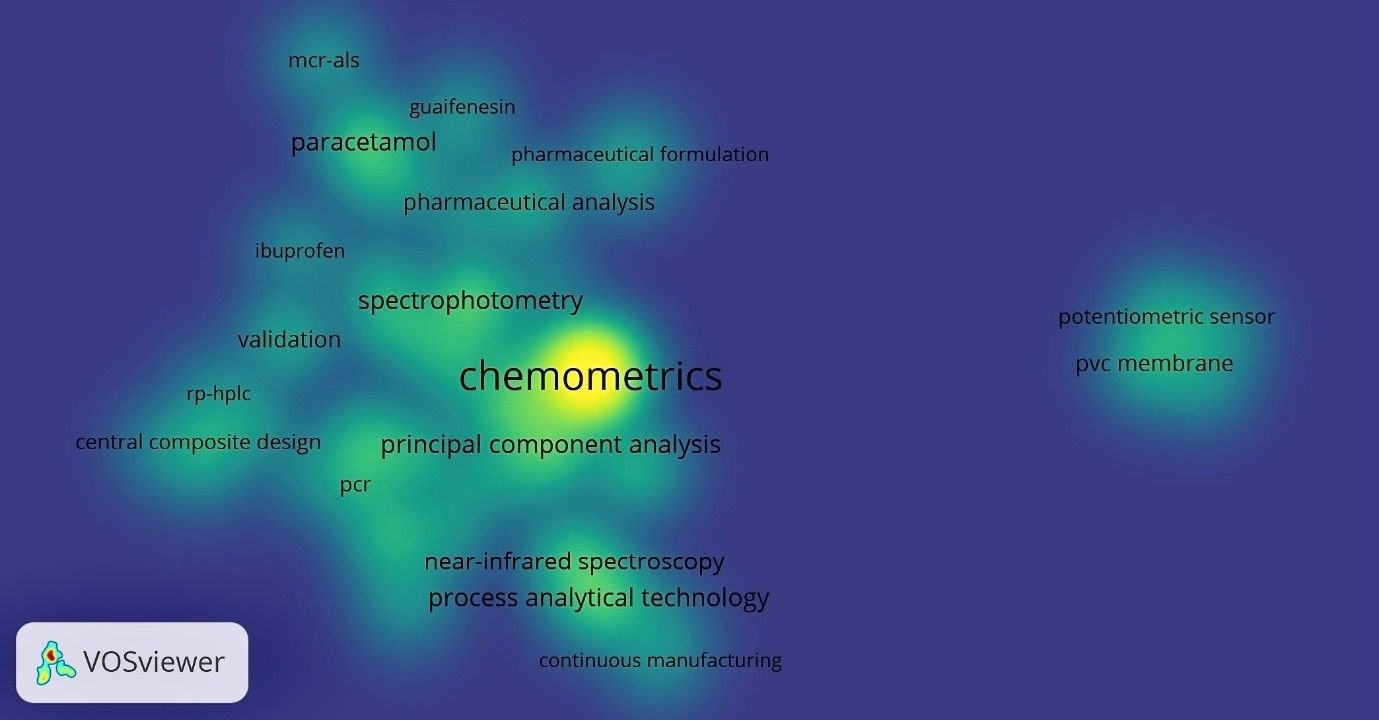
Figure 7 illustrates the density visualization map of keyword co-occurrence related to chemometrics in pharmaceutical formulation research. Areas with brighter colors, such as yellow and green, represent regions with high frequency and relevance of keywords, indicating significant research attention. The keyword “chemometrics” appears as the most prominent and central term, reflecting its dominant role in the field. Surrounding keywords like “principal component analysis”, “spectrophotometry”, and “process analytical technology” also show strong density, suggesting their frequent association with chemometrics research. In contrast, keywords located in darker or blue areas, such as “potentiometric sensor” and “PVC membrane”, indicate lower occurrence and lesser focus within the analyzed literature.
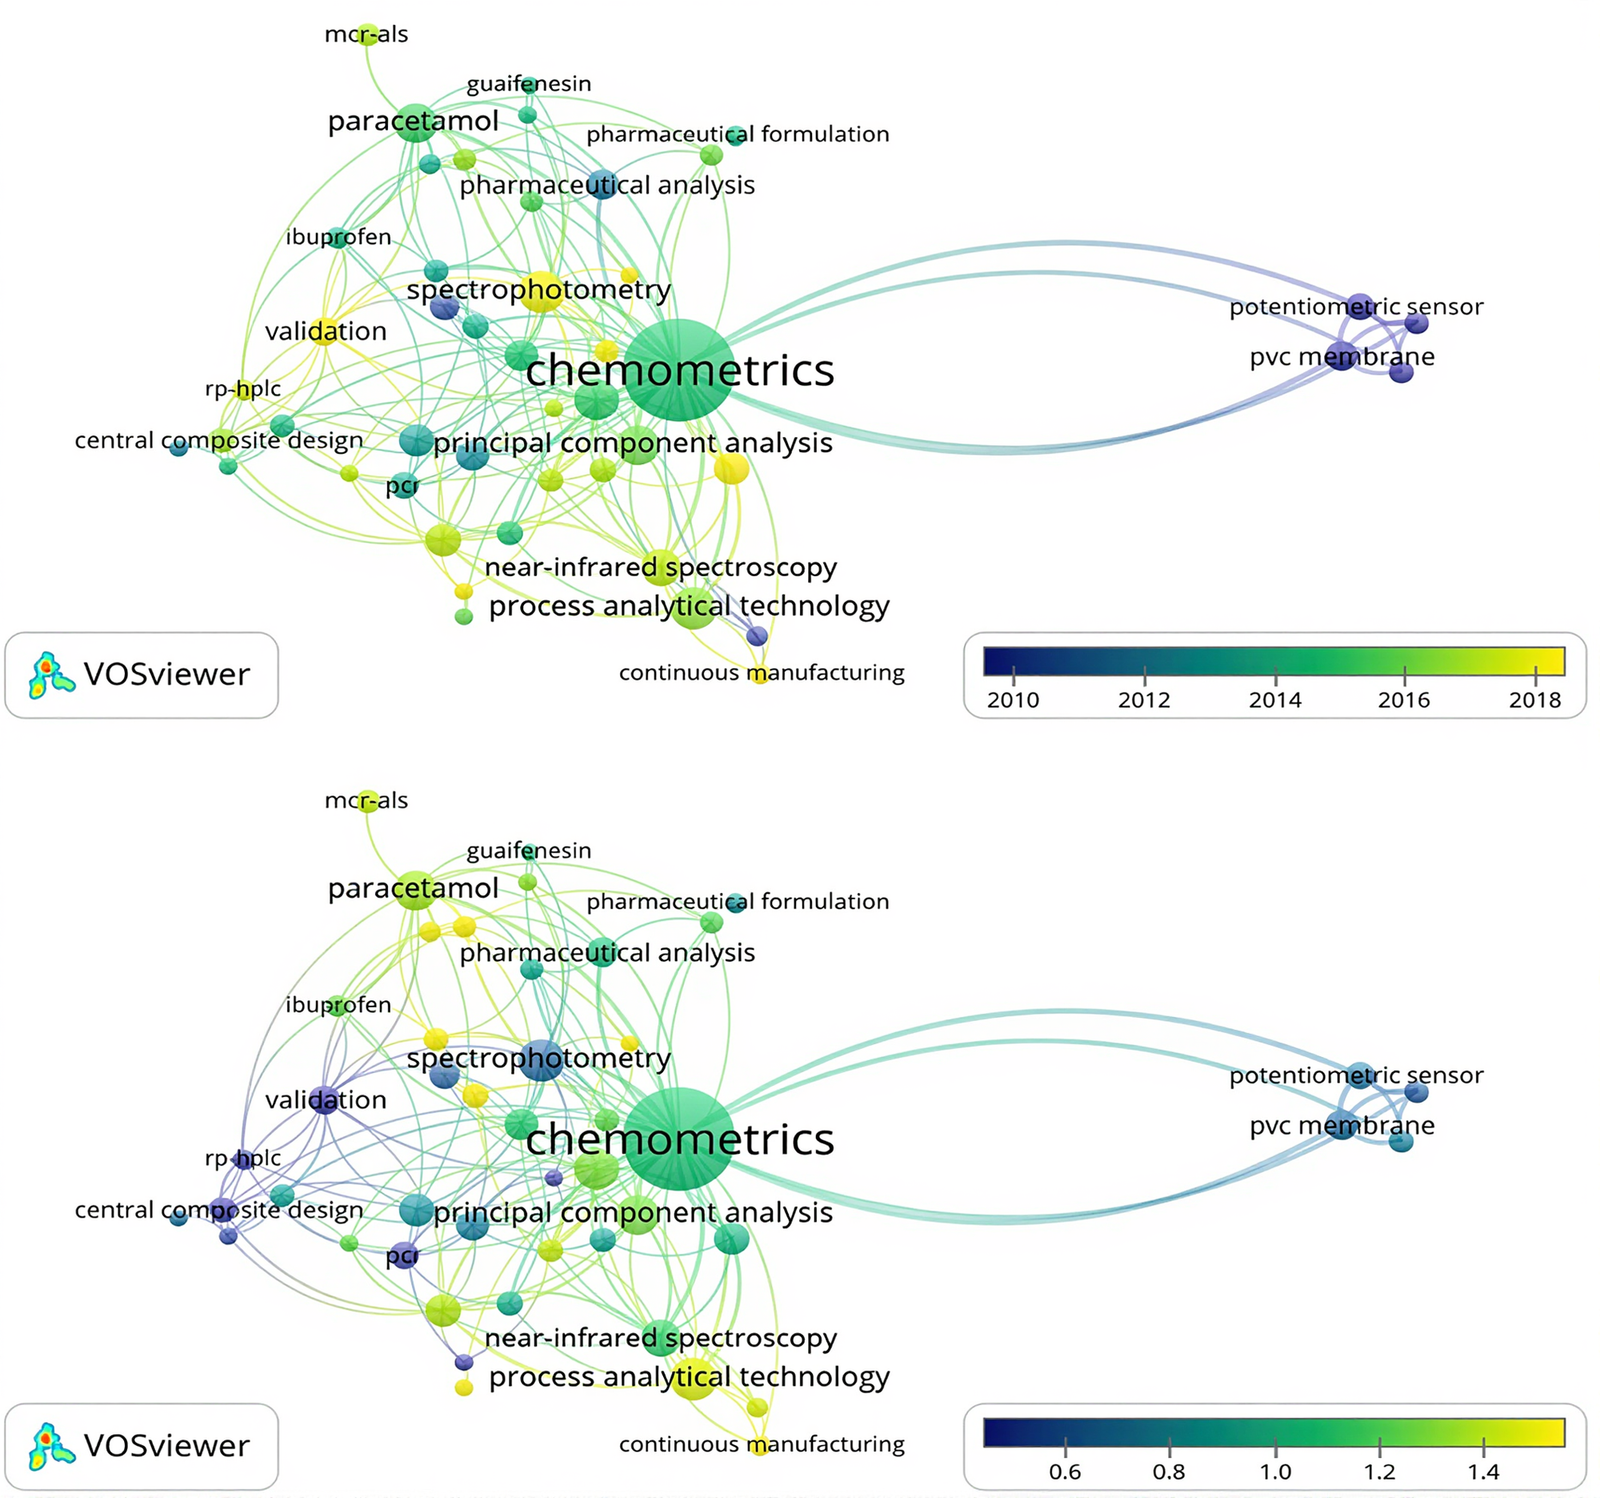
Figure 8 illustrates the development and trends in chemometrics research from 2005 to 2025. Node size corresponds to frequency, while node color represents the timeframe. The colors of the keyword nodes represent the time of their occurrence, with blue indicating earlier keywords and yellow representing more recent or frequently used keywords toward the later period (around 2025) (31). The keyword “chemometrics” remains the central focus, surrounded by related terms such as “principal component analysis”, “spectrophotometry”, “process analytical technology”, and “pharmaceutical analysis”, reflecting the consistent research focus on key methods and applications. Some keywords shown in brighter colors, such as “validation”, represent emerging trends that have received greater attention during the period. This map offers an understanding of the development of research topics in chemometrics over time and emphasizes the areas that have seen growing interest in recent years (32).
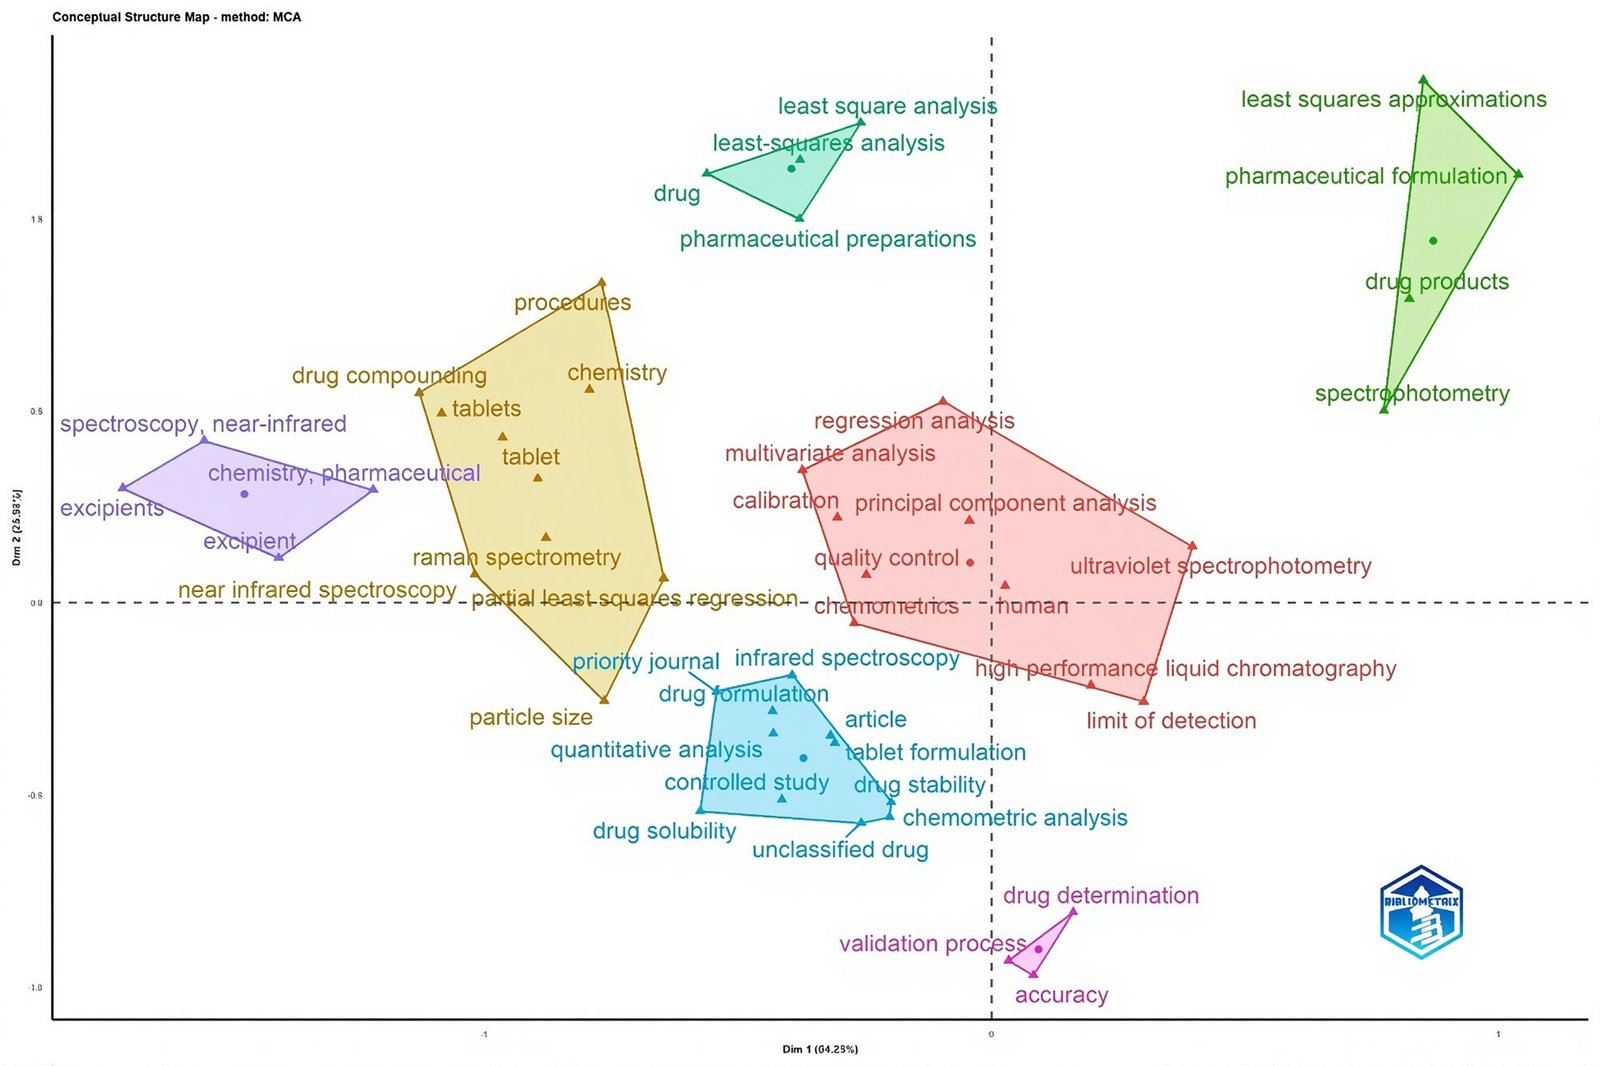
Figure 9 presents a visualization of keyword co-occurrence, illustrating the connections among research topics related to the application of chemometrics in pharmaceutical formulation from 2005 to 2025. Based on 516 Scopus-indexed articles, the data is grouped into seven clusters that reveal the main research themes in pharmaceutical and analytical chemistry. The red cluster, which is the largest, groups several keywords related to chemometrics, such as principal component analysis, regression analysis, multivariate analysis, and calibration, along with their applications in UV spectrophotometry and HPLC methods. This cluster represents the core of multivariate statistical applications in quality control. The yellow cluster, as the second largest, includes keywords such as drug compounding, tablet, Raman spectrometry, particle size, and partial least squares (PLS) regression. This cluster reflects the relationship between spectrometric techniques, particularly Raman spectroscopy, and PLS modeling for component analysis in solid pharmaceutical forms. Meanwhile, the blue cluster focuses more on topics related to drug formulation and physical characterization, illustrating the use of chemometrics for formulation optimization. The other clusters describe the application of spectrophotometric analysis in the development and evaluation of pharmaceutical formulations (green cluster), method validation in pharmaceutical analysis (pink cluster), the use of NIR in raw material characterization for quality control (purple cluster), and least squares analytical approaches for quantitative modeling (cyan cluster). Overall, these seven clusters represent an interconnected landscape of research trends from the development of chemometrics-based analytical methods, the application of spectroscopy and chromatography, and formulation optimization, to validation processes and quality control within the pharmaceutical industry (33).
Limitations of the Study
While this bibliometric mapping provides a robust framework for understanding the evolution of chemometrics in pharmaceutical formulation, certain methodological constraints must be acknowledged. First, the data were retrieved exclusively from the Scopus database. Although Scopus is one of the largest curated repositories for pharmaceutical literature, the exclusion of other databases such as Web of Science or PubMed may omit specific regional or niche publications. Second, the search strategy was restricted to English-language documents, which introduces a potential language bias and may underrepresent significant contributions from non-English-speaking academic circles. Additionally, the quantitative data for the year 2025 is based on a partial-year retrieval (up to May 2025), and thus should not be interpreted as a definitive decline in research activity. Finally, the reliance on specific Boolean strings might have excluded relevant studies that utilize multivariate techniques without explicitly using the term 'chemometrics'. Acknowledging these boundaries is essential for contextualizing the current study and providing a transparent foundation for future scientometric analyses.
Future Direction
In light of the limitations identified in this study, future research should first be directed toward multi-database integration, combining data from Scopus with Web of Science or PubMed, to minimize indexing bias and provide a more comprehensive global overview. Based on the current bibliometric findings from 516 articles, while there is a strong focus on spectroscopic analysis and method validation, significant gaps remain in advanced areas such as continuous manufacturing and stability testing. Therefore, future studies should focus on integrating chemometric approaches with Process Analytical Technology (PAT) and in-line spectroscopy to improve manufacturing efficiency. This includes exploring nanoformulation strategies and 3D-printed drug delivery systems, where multivariate models are essential for predictive quality control. Furthermore, more attention is needed on evaluating effectiveness through long-term stability studies, in vitro-in vivo correlation (IVIVC), and clinical trials, bridging the gap between analytical data and therapeutic outcomes. Multidisciplinary collaboration that integrates pharmaceutical sciences with bioinformatics and omics data is also necessary to enable more complex and predictive data analysis. Finally, the uneven geographical distribution highlights a clear need to increase participation from underrepresented regions, such as Southeast Asia and Africa. Strengthening international partnerships through joint funding and collaborative research initiatives will be vital for fostering product innovation and improving quality standards across the global pharmaceutical industry.
Conclusion
This bibliometric analysis provides a comprehensive overview of the global research landscape concerning chemometrics in pharmaceutical formulation from 2005 to 2025. The analysis reveals a sustained overall growth trend in publications, despite periodic fluctuations in certain years. The majority of publications are original research articles published in journals in the fields of pharmaceutical sciences, analytical chemistry, and chemometrics. Egypt and the United States are the countries with the highest contributions, while institutions such as the Faculty of Pharmacy and Cairo University demonstrate consistent scientific productivity. Author analysis reveals influential contributors such as Khan, Mansoor A. , and Sohrabi, M. R. , who have played a significant role in shaping the research direction through the quantity and quality of their work, as well as through their contributions to highly cited publications in the field. Keyword network mapping highlights key themes that demonstrate the central role of statistical modeling in this field. While significant progress has been made, cross-disciplinary collaboration and wider adoption of chemometric approaches in pharmaceutical sciences are essential to address increasingly complex regulatory challenges and improve the efficiency and safety of pharmaceutical formulations in the future.
Declarations
Acknowledgment
The authors convey deep gratitude to Sebelas Maret University for their invaluable support in facilitating and resourcing this study.
Conflict of Interest
The authors declare no conflicting interest.
Data Availability
All data generated or analyzed during this study are included in this published article [and its supplementary information files].
Ethics Statement
Ethical approval was not required for this study.
Funding Information
The author(s) declare that no financial support was received for the research, authorship, and/or publication of this article.
References
- Intell Lab Syst. 2001;58:109–130. doi: 10.1016/S0169-7439(01)00155-1.
- Lionberger RA, Lee SL, Lee L, Raw A, Yu LX. Quality by Design: Concepts for ANDAs. Aaps J. 2008;10(2):268-276. doi: https://doi.org/10.1208/s12248-008-9026-7
- International Council for Harmonisation. ICH Guideline Q8 (R2) Pharmaceutical Development - Note for Guidance on Pharmaceutical Development. Eur. Med. Agency. London: European Medicines Agency; 2017.
- Igne B, Airiau C, Talwar S, Towns E. Chemometrics in the Pharmaceutical Industry. Elsevier; 2020. doi: https://doi.org/10.1016/b978-0-12-409547-2.14638-4
- Ferreira AP, Tobyn M. Multivariate analysis in the pharmaceutical industry: enabling process understanding and improvement in the PAT and QbD era. Pharmaceutical Development and Technology. 2014;20(5):513-527. doi: https://doi.org/10.3109/10837450.2014.898656
- Roberto de Alvarenga Junior B, Lajarim Carneiro R. Chemometrics Approaches in Forced Degradation Studies of Pharmaceutical Drugs. Molecules. 2019;24(20):3804. doi: https://doi.org/10.3390/molecules24203804
- Valaee M, Sohrabi MR, Motiee F. Rapid simultaneous analysis of anti human immunodeficiency virus drugs in pharmaceutical formulation by smart spectrophotometry based on multivariate calibration and least squares support vector machine methods. Spectrochimica Acta Part A: Molecular and Biomolecular Spectroscopy. 2023;290:122292. doi: https://doi.org/10.1016/j.saa.2022.122292
- Lakshmi K, Lakshmi S. Design and Optimization of a Chemometric-Assisted Spectrophotometric Determination of Telmisartan and Hydrochlorothiazide in Pharmaceutical Dosage Form. Journal of Young Pharmacists. 2010;2(1):85-89. doi: https://doi.org/10.4103/0975-1483.62224
- Ragupathy V, Arcot S. Spectrophotometric Determination of Drotaverine HCl and Mefenamic Acid in Tablets by Chemometric Methods. Res J Pharm Biol Chem Sci [Internet]. 2013;4:899–909.
- Modi M, Patil H, Raj R, Bhavsar P. Development and validation of high-performance thin layer chromatography method for simultaneous estimation of indacaterol and budesonide in synthetic mixture. Ind Dru. 2026;63(01):42-47. doi: https://doi.org/10.53879/id.63.01.15628
- Angheluta A, Guizani S, Saunier J, Rönnback R. Application of chemometric modelling to UV-Vis spectroscopy: development of simultaneous API and critical excipient assay in a liquid solution continuous flow. Pharmaceutical Development and Technology. 2020;25(8):919-929. doi: https://doi.org/10.1080/10837450.2020.1770789
- EL-Gindy A, Hadad GM. Chemometrics in Pharmaceutical Analysis: An Introduction, Review, and Future Perspectives. Journal of AOAC INTERNATIONAL. 2012;95(3):609-623. doi: https://doi.org/10.5740/jaoacint.sge_el-gindy
- Mazivila SJ, Olivieri AC. Chemometrics coupled to vibrational spectroscopy and spectroscopic imaging for the analysis of solid-phase pharmaceutical products: A brief review on non-destructive analytical methods. TrAC Trends in Analytical Chemistry. 2018;108:74-87. doi: https://doi.org/10.1016/j.trac.2018.08.013
- Aboushady D, Samir L, Alaa Masoud A, Elshoura Y, Mohamed A, Hanafi RS, et al. Chemometric Approaches for Sustainable Pharmaceutical Analysis Using Liquid Chromatograph. Chemistry. 2024;7(1):11. doi: https://doi.org/10.20944/preprints202412.0904.v1
- Monakhova YB, Holzgrabe U, Diehl BW. Current role and future perspectives of multivariate (chemometric) methods in NMR spectroscopic analysis of pharmaceutical products. Journal of Pharmaceutical and Biomedical Analysis. 2018;147:580-589. doi: https://doi.org/10.1016/j.jpba.2017.05.034
- Zulkifli B, Fakri F, Odigie J, Nnabuife L, Isitua CC, Chiari W. Chemometric-empowered spectroscopic techniques in pharmaceutical fields: A bibliometric analysis and updated review. Narra X. 2023;1(1). doi: https://doi.org/10.52225/narrax.v1i1.80
- Donthu N, Kumar S, Mukherjee D, Pandey N, Lim WM. How to conduct a bibliometric analysis: An overview and guidelines. Journal of Business Research. 2021;133:285-296. doi: https://doi.org/10.1016/j.jbusres.2021.04.070
- Rizky D. Larasati, Lia Puspitasari, Audi N. Yusfiya, Ahmad Ainurrofiq, Syaiful Choiri, Imam Prabowo, et al. Bibliometric Analysis of Articles on Essential Oil Nanoemulsions. Tropical Journal of Natural Product Research. 2025;9(10). doi: https://doi.org/10.26538/tjnpr/v9i10.44
- van Eck NJ, Waltman L. Software survey: VOSviewer, a computer program for bibliometric mapping. Scientometrics. 2009;84(2):523-538. doi: https://doi.org/10.1007/s11192-009-0146-3
- Siler K. Future Challenges and Opportunities in Academic Publishing. Can. J. Soc. 2017;42(1):83-114. doi: https://doi.org/10.29173/cjs28140
- Haghani M. What makes an informative and publication-worthy scientometric analysis of literature: A guide for authors, reviewers and editors. Transportation Research Interdisciplinary Perspectives. 2023;22:100956. doi: https://doi.org/10.1016/j.trip.2023.100956
- Hugar J. Research Publication Trend in Pharmaceutical Sciences: A Bibliometric Analysis During 2013–2017. SSRN Journal. 2018; 3620176. doi: https://doi.org/10.2139/ssrn.3620176
- Kussmann M, Abe Cunha DH, Berciano S. Bioactive compounds for human and planetary health. Front. Nutr. 2023;10. 1193848.doi: https://doi.org/10.3389/fnut.2023.1193848
- Skopec M, Issa H, Reed J, Harris M. The role of geographic bias in knowledge diffusion: a systematic review and narrative synthesis. Res Integr Peer Rev. 2020;5(1):2. doi: https://doi.org/10.1186/s41073-019-0088-0
- Huang MH, Huang MJ. An analysis of global research funding from subject field and funding agencies perspectives in the G9 countries. Scientometrics. 2018;115(2):833-847. doi: https://doi.org/10.1007/s11192-018-2677-y
- Green BN, Johnson CD. Interprofessional collaboration in research, education, and clinical practice: working together for a better future. Journal of Chiropractic Education. 2015;29(1):1-10. doi: https://doi.org/10.7899/jce-14-36
- Yu LX, Woodcock J. FDA pharmaceutical quality oversight. International Journal of Pharmaceutics. 2015;491(1-2):2-7. doi: https://doi.org/10.1016/j.ijpharm.2015.05.066
- Preech T, Taqa A. International Collaboration in Scientific Research: Successes, Challenges, and Opportunities. 2020;8:2853–3006.
- Lu W, Liu Z, Huang Y, Bu Y, Li X, Cheng Q. How do authors select keywords? A preliminary study of author keyword selection behavior. Journal of Informetrics. 2020;14(4):101066. doi: https://doi.org/10.1016/j.joi.2020.101066
- Ahn J, Yi E, Kim M. Blockchain Consensus Mechanisms: A Bibliometric Analysis (2014–2024) Using VOSviewer and R Bibliometrix. Information. 2024;15(10):644. doi: https://doi.org/10.3390/info15100644
- Zhou J, Zhao B, Zhang M. Hotspots and research trends of the ‘dark side of creativity’ in the last decade. Heliyon. 2023;9(10):e20392. doi: https://doi.org/10.1016/j.heliyon.2023.e20392
- Lavine B, Workman JJ. Chemometrics. Anal. Chem. 2004;76(12):3365-3372. doi: https://doi.org/10.1021/ac040053p
- Paul D, Sanap G, Shenoy S, Kalyane D, Kalia K, Tekade RK. Artificial intelligence in drug discovery and development. Drug Discovery Today. 2021;26(1):80-93. doi: https://doi.org/10.1016/j.drudis.2020.10.010