RESEARCH ARTICLE
Optimization of Extraction Conditions and Kinetics of Antioxidant Compounds from Polyalthia longifolia Leaves
Sciences of Phytochemistry|Vol. 5, Issue 2, pp. 221-231 (2026)
CC BY 4.0-2026 Authors
Views
Downloads
Shares

Received
Mar 3, 2026Revised
May 4, 2026Accepted
Jun 10, 2026Published
Jul 9, 2026
Abstract
This study aimed to optimize phenolic antioxidant extraction from Polyalthia longifolia leaves using hot maceration with 70% ethanol and to characterize the extraction kinetics under optimal conditions. Response surface methodology was used to evaluate the effects of extraction time and temperature on extraction yield, total phenolic content (TPC), and ferric reducing antioxidant power (FRAP). Both factors significantly influenced all responses, with the extraction yield and TPC increasing progressively with temperature and time. FRAP, however, exhibited a dome-shaped response, peaking at intermediate temperatures before declining under prolonged high-temperature conditions, consistent with the thermal degradation of heat-labile antioxidants. The highest phenolic recovery and antioxidant activity were achieved at the upper boundary of the experimental domain, suggesting that the true optimum may lie beyond the conditions tested. Kinetic analysis further revealed that antioxidant-active compounds were mobilized faster than the bulk extractable mass, with implications for reducing extraction time and energy consumption at scale. These findings provide a statistically guided and kinetically informed foundation for the valorization of Polyalthia longifolia leaves, supporting future process optimization across broader solvent systems and extraction techniques for functional food and nutraceutical applications.
Keywords:
Introduction
Polyalthia longifolia (false Ashoka), a tropical ornamental tree with extensive traditional medicinal use, has emerged as a candidate source, its leaves employed in Ayurveda for fever, skin disorders and diabetes (4), contain alkaloids, terpenoids, flavonoids, and phenolic acids (5). However systematic understanding of how extraction conditions influence both the yield and antioxidant activity of these phenolics remains limited, particularly under hot maceration, a simple technique well-suited to thermostable compounds.
Extraction efficiency is strongly affected by time and temperature, which often interact non-linearly. Response surface methodology (RSM) overcomes the shortcomings of one-factor-at-a-time approaches by evaluating multiple variables and their interactions simultaneously, and has been applied to phenolic extraction from diverse plant matrices (6). In the case of P. longifolia, previous process optimization employed orthogonal experimental designs (7); however, these studies lacked corresponding kinetic insights. Kinetic studies on this species have concentrated on unrelated systems, such as pyrolysis (8) and adsorption processes (9). Broader research on hot phenolic extraction indicates first-order or pseudo-second-order behavior, although these models are largely empirical and rarely connect rate parameters to antioxidant functionality (10). To date, there have been no reports on the combined use of RSM-driven optimization and kinetic modeling for P. longifolia leaf extraction under hot maceration. This combination is relevant because it enables the simultaneous mapping of extraction yield and bioactivity, which is key to developing standardized extracts that retain functional properties during scale-up.
A critical review of the kinetic literature on heat-assisted phenolic extraction from leafy and lignocellulosic matrices reveals three recurring shortcomings that motivate the present study. First, kinetic models are often reported in isolation: rate constants and activation energies are estimated, but their relationship with retained antioxidant capacity is rarely quantified. As a result, it remains unclear whether the conditions that maximize extraction yield also optimize functional antioxidant activity (11). Second, in studies where multi-response optimization has been applied, such as those on artichoke bracts, apple pomace, and Feijoa peels, the temperature ranges investigated are often narrow, typically ≤20 °C, which may limit the reliability of Arrhenius-derived activation energies (12). Third, single-component first-order or pseudo-second-order models are frequently fitted to total phenolic data without sufficient consideration of the multicomponent nature of phenolic release or the analytical nonspecificity of the Folin–Ciocalteu assay (13). The present study addresses the first gap by linking RSM-derived response surfaces with first-order kinetic parameters for yield, TPC, and FRAP, while explicitly recognizing the remaining two issues as methodological limitations.
The case for jointly optimizing yield, total phenolic content (TPC), and ferric reducing antioxidant power (FRAP) is built on three key considerations. (i) Operationally, antioxidant-rich extracts intended for functional food and nutraceutical applications need to be defined not only by quantity (extract mass per unit feedstock) but also by quality (bioactivity per unit extract), as either parameter alone is insufficient for establishing a commercially viable ingredient. (ii) Economically, the kinetic parameters derived in this study, such as rate constants, half-lives, and activation energies, directly inform batch time and energy budgets at the pilot scale. Thus, a kinetic model based on bioactivity, rather than mass alone, offers a more realistic basis for cost modeling. (iii) Regulatory and label-claim documentation for this product class often require proof that the bioactive fraction is preserved under the extraction conditions. This is feasible only when the extraction kinetics and antioxidant retention are mapped on the same time–temperature grid, as is done in the present study.
Accordingly, this study used a face-centered central composite design to evaluate the effects of extraction time (2–6 h) and temperature (50–70 °C) on the extraction yield, total phenolic content (TPC), and ferric reducing antioxidant power (FRAP) of P. longifolia leaf extracts obtained by hot maceration with 70% ethanol. The optimized conditions were then employed to derive kinetic parameters (rate constants, half-lives, and activation energies) and to model extraction behavior. By integrating statistical optimization with kinetic analysis, this study offers a model-dependent yet comprehensive framework to support the valorization of P. longifolia leaves in functional foods and nutraceuticals.
Materials And Methods
Materials
Polyalthia longifolia leaves were collected in Kiagbodo, Ughelli, Delta State, Nigeria. The specimen was taxonomically verified by the Botanical Survey Unit of the Department of Forestry and Wood Technology at the Federal University of Technology, Akure (voucher specimen reference no: 2026/FUTA/HRB 0417). All solvents and reagents were of analytical grade and purchased from Jemok Nigeria Limited, Egbeda, Lagos. Folin-Ciocalteu reagent, gallic acid, 2, 4, 6-tripyridyl-s-triazine (TPTZ), and other antioxidant assay chemicals were obtained from Merck (Darmstadt, Germany).
Sample Preparation
Fresh leaves were washed with deionized water to remove surface contaminants and air-dried in the shade at ambient temperature (25 ± 2 °C) until a constant weight was achieved, to minimize the degradation of thermolabile phytochemicals (14). The dried leaves were ground into a fine powder using a manual grinder. The powdered material was sieved to obtain a uniform particle size and stored in airtight containers at ambient temperature until analysis.
Solvent Preparation
Seventy percent (v/v) ethanol was freshly prepared on the day of extraction by diluting analytical-grade 95% (v/v) ethanol with distilled water. This prepared solvent was then immediately transferred into tightly capped amber glass bottles, stored at 25 ± 2 °C in the dark, and effectively used within 2 h of preparation.
Extraction Procedure
Extraction was performed using a hot maceration (digestion) technique. Ground plant material (20 g) was placed in a sealed, heat‑resistant borosilicate glass bottle (Schott®) to minimize solvent loss during heating. Subsequently, 70 % ethanol (400 mL) was added to obtain a solid-to-liquid ratio of 1: 20 (w/v). The vessel was immersed in a thermostatically controlled water bath set to the temperature specified by the RSM experimental design, with continuous agitation at 150 rpm to enhance solvent penetration and mass transfer. Extraction time and temperature were varied according to the design described in Section 2.4. After extraction, the mixture was filtered through Whatman No. 1 filter paper, and the filtrate was concentrated under reduced pressure using a rotary evaporator (Büchi, Switzerland) at 40 °C until a constant weight was obtained. The concentrated extract was stored in airtight amber bottles at 4 °C until analysis.
Experimental Design and Optimization
A face-centered central composite design (CCD; α = 1) within the framework of response surface methodology (RSM) was employed to model and optimize the extraction conditions and evaluate the effects of independent variables on the response (s). Two factors were investigated: extraction time (A: 2–6 h) and extraction temperature (B: 50–70 °C). The design comprised 13 experimental runs, including factorial, axial (star), and replicated center points, to estimate the pure experimental error and assess the model adequacy. The design matrix, which shows both the coded and actual factor levels, is presented in Table 1. Center points (runs 2, 3, 5, 9, and 10) were replicated to evaluate the method reproducibility and estimate the experimental variability.
| Run | A (coded) | B (coded) | Time, h (actual) | Temp, °C (actual) |
|---|---|---|---|---|
| 1 | +1 | 0 | 6 | 60 |
| 2 | 0 | 0 | 4 | 60 |
| 3 | 0 | 0 | 4 | 60 |
| 4 | 0 | −1 | 4 | 50 |
| 5 | 0 | 0 | 4 | 60 |
| 6 | −1 | −1 | 2 | 50 |
| 7 | −1 | 0 | 2 | 60 |
| 8 | 0 | +1 | 4 | 70 |
| 9 | 0 | 0 | 4 | 60 |
| 10 | 0 | 0 | 4 | 60 |
| 11 | −1 | +1 | 2 | 70 |
| 12 | +1 | −1 | 6 | 50 |
| 13 | +1 | +1 | 6 | 70 |
The coded levels of the independent variables were −1 (low), 0 (center), and +1 (high). The relationship between the coded and actual values of each variable was established using Equation 1, where represents the coded value of the independent variable, is the actual value, is the center-point value, and ΔX denotes the step change (half the range of the variable).
Analytical Methods
Determination of Extraction Yield
Extraction yield was determined gravimetrically by evaporating the solvent from a known volume of extract under reduced pressure. The residue was dried to a constant weight, and the extraction yield (%) was calculated using Equation 2, where MextractMextract = mass of dried extract (g) and MsampleMsample = mass of initial plant material (g).
Determinations were performed in triplicate. The mean values were used as Response 1 in the response surface methodology (RSM) analysis. Triplicate measurements were adopted in line with common RSM practice to improve reliability and support error estimation (15).
Ferric Reducing Antioxidant Power (FRAP) Assay
The Ferric Reducing Antioxidant Power (FRAP) assay was performed as described by Clark et al. (16), with slight modifications. Briefly, 0.5 mL of the extract obtained from each experimental run was mixed with 0.5 mL of phosphate buffer (0.2 M, pH 6.6) and 0.5 mL of potassium ferricyanide solution (1%, w/v). The reaction mixture was incubated at 50 °C for 20 min to facilitate the reduction of ferricyanide (Fe³⁺) to ferrocyanide (Fe²⁺). Following incubation, 0.5 mL of trichloroacetic acid (10%, w/v) was added to stop the reaction, and the mixture was centrifuged at 3000 rpm for 10 min. A 0.5 mL aliquot of the supernatant was then mixed with 0.5 mL distilled water and 0.1 mL ferric chloride solution (0.1%, w/v). After standing for 10 min at room temperature, the absorbance was measured at 700 nm using a UV-Vis spectrophotometer.
All measurements were performed in triplicate. Ferric-reducing activity was expressed as the percentage FRAP according to Equation 3, where is the absorbance of the extract and is the maximum absorbance recorded among all experimental runs. The calculated percentage values were used as Response 2 (FRAP, %) in the response surface methodology (RSM) analysis.
Total Phenolic Content (TPC)
Total phenolic content was determined using the Folin–Ciocalteu colorimetric method (17) with slight modifications. Absorbance was measured
at 765 nm using a precise UV–Vis spectrophotometer. Results are expressed as milligrams of gallic acid equivalents per
gram of dry extract (mg GAE/g) using Equation 4, where C represents the concentration derived from the
established standard gallic acid calibration curve (mg/mL), V is the total volume of the extract used (mL), and m is
the mass of the dried extract (g). All experimental measurements were carefully performed in triplicate, and the
calculated mean values were consistently used as the defined Response 3 in the subsequent detailed RSM statistical
analysis.
Kinetic Analysis
First-Order Kinetic Model
Extraction kinetics were fitted to a first-order kinetic model described by Equation 5, where Y(t) is the extraction yield at time t (%), Y₍∞₎ is the equilibrium extraction yield (%), k is the extraction rate constant (h⁻¹), and t is the extraction time (h).
Model parameters (Y₍∞₎ and k) were estimated for each temperature using non-linear regression analysis with the MATLAB lsqcurvefit function (MathWorks, Inc. , Natick, MA, USA). Goodness of fit was evaluated using the coefficient of determination (R²) and root mean square error (RMSE).
Linearization and Validation
The linearized form of the first-order kinetic model (Equation 6) was used for validation. A plot of ln(Y∞−Y(t))ln(Y∞−Y(t)) versus time (t) should yield a straight line with slope -k if the extraction follows first-order kinetics.
Arrhenius Analysis
The temperature dependence of the extraction rate constant was evaluated using the Arrhenius Equation 7, where k is the rate constant (h⁻¹), A is the pre-exponential factor (h⁻¹), Ea is the activation energy (J/mol), R is the universal gas constant (8.314 J mol⁻¹ K⁻¹), and T is the absolute temperature (K). The activation energy was determined from the slope of the plot of ln (k) versus 1/T, and the pre-exponential factor was calculated from the intercept.
Half-Life Calculation
The half-life, defined as the time required to achieve 50% of the equilibrium extraction yield, was calculated using Equation 8.
Statistical Analysis
All experiments were performed in triplicate, and the results are expressed as the mean ± standard deviation. The experimental design and response surface analysis were conducted using Design-Expert® software version 13 (Stat-Ease Inc., Minneapolis, MN, USA). Analysis of variance (ANOVA) was performed to evaluate the significance of the model terms, and the lack-of-fit test was used to validate model adequacy. Statistical significance was set at p < 0.05. Kinetic and Arrhenius analyses were performed using MATLAB R2023b (MathWorks, Inc. , Natick, MA, USA).
Results and Discussion
This study optimized the extraction of phenolic compounds from P. longifolia leaves using response surface methodology. The extraction kinetics were evaluated under the optimal conditions identified in the design. The findings from the experimental design, statistical analysis, response surface optimization, and kinetic modeling are presented in Tables 2 and 3 and Figures 1-6.
Experimental Design and Model Fitting
A face-centered central composite design comprising 13 runs was used to evaluate the effects of extraction temperature (50–70 °C) and time (2–6 h) on extraction yield, total phenolic content (TPC), and FRAP using 70% (v/v) aqueous ethanol (Table 2). Both temperature and time increased phenolic recovery within the studied range, consistent with the expectation that higher temperatures lower solvent viscosity and increase solute diffusivity (18). Good reproducibility at the center points (4 h, 60 °C) supported the reproducibility of the design (yield: 15.16 ± 0.96%; TPC: 11.24 ± 0.17 mg GAE/g; FRAP: 67.36 ± 0.48%).
| Std Run | Run Order | Factor 1 A: Time (h) | Factor 2 B: Temperature (°C) | Response 1 Extraction Yield (%) | Response 2 FRAP (%) | Response 3 Phenolics (mg GAE/g) |
|---|---|---|---|---|---|---|
| 6 | 1 | 6 | 60 | 17.3 | 70.2 | 12.8 |
| 12 | 2 | 4 | 60 | 15.1 | 67.4 | 11.2 |
| 9 | 3 | 4 | 60 | 16.5 | 67.9 | 11.5 |
| 7 | 4 | 4 | 50 | 10.7 | 58.3 | 9.8 |
| 13 | 5 | 4 | 60 | 15.3 | 67.7 | 11.3 |
| 1 | 6 | 2 | 50 | 7.2 | 50.6 | 7.5 |
| 5 | 7 | 2 | 60 | 11.4 | 60.2 | 10.1 |
| 8 | 8 | 4 | 70 | 15.8 | 69.1 | 12.0 |
| 10 | 9 | 4 | 60 | 13.9 | 66.8 | 11.1 |
| 11 | 10 | 4 | 60 | 15 | 67 | 11.1 |
| 3 | 11 | 2 | 70 | 12.5 | 63.3 | 10.8 |
| 2 | 12 | 6 | 50 | 13.6 | 65.2 | 10.5 |
| 4 | 13 | 6 | 70 | 19.8 | 71.1 | 13.5 |
The ANOVA results (Table 3) support model adequacy (R² = 0.9928; adjusted R² = 0.9877; predicted R² = 0.9522; adequate precision = 48.07; CV = 0.97%). The close agreement between the adjusted and predicted R² values supports the reliability of the model for predicting responses within the studied range, a prerequisite for process optimization. Temperature (F = 439.67, p < 0.0001) and extraction time (F = 362.02, p < 0.0001) were the dominant contributors to all responses. The significant interaction term AB (F = 29.05, p < 0.0010) indicates that neither factor can be optimized independently, reinforcing the practical advantage of RSM over one-factor-at-a-time approaches. Significant quadratic terms A² and B² indicate curvature consistent with a true optimum within the studied range, and the non-significant lack-of-fit (p = 0.1564) further supports model adequacy. Given the limited number of experimental runs in the face-centered CCD, the model, while robust within the tested domain, may be sensitive to extrapolation beyond this range; external validation using additional data points or a more design-efficient strategy (e. g., Box–Behnken) would further test its generalizability.
| Source | Sum of Squares | Df | Mean Square | F-value | P-value |
|---|---|---|---|---|---|
| Model | 385.19 | 5 | 77.04 | 193.60 | < 0.0001 |
| A-Temperature | 174.96 | 1 | 174.96 | 439.67 | < 0.0001 |
| B-Extraction time | 144.06 | 1 | 144.06 | 362.02 | < 0.0001 |
| AB | 11.56 | 1 | 11.56 | 29.05 | < 0.0010 |
| A² | 7.72 | 1 | 7.72 | 19.41 | < 0.0031 |
| B² | 27.80 | 1 | 27.80 | 69.85 | < 0.0001 |
| Residual | 2.79 | 7 | 0.3979 | - | - |
| Lack of Fit | 1.93 | 3 | 0.6445 | 3.03 | 0.1564 |
| Pure Error | 0.8520 | 4 | 0.2130 | - | - |
| Cor Total | 387.98 | 12 | - | - | - |
| Note: C.V. = 0.9707 %; R²= 0.9928; Adjusted R²= 0.9877; Predicted R²=0.9522; Adeq Precision = 48.0684. | |||||
Effect of Time and Temperature on Extraction Responses
The extraction yield increased with both temperature and time across the entire experimental range (Figure 1a), consistent with enhanced solvent diffusivity and solute solubility at elevated temperatures. FRAP, by contrast, exhibited a dome-shaped response surface (Figure 1b), rising from 50 to approximately 60–65 °C before plateauing and declining slightly at 70 °C, particularly during extended extraction times. Total phenolic content (TPC) followed the same upward trend as yield (Figure 1c), increasing progressively across the studied range. The significant interaction term (AB, p< 0.001) confirmed that the two factors acted synergistically, reinforcing the advantage of multivariate optimization over one-factor-at-a-time approaches.
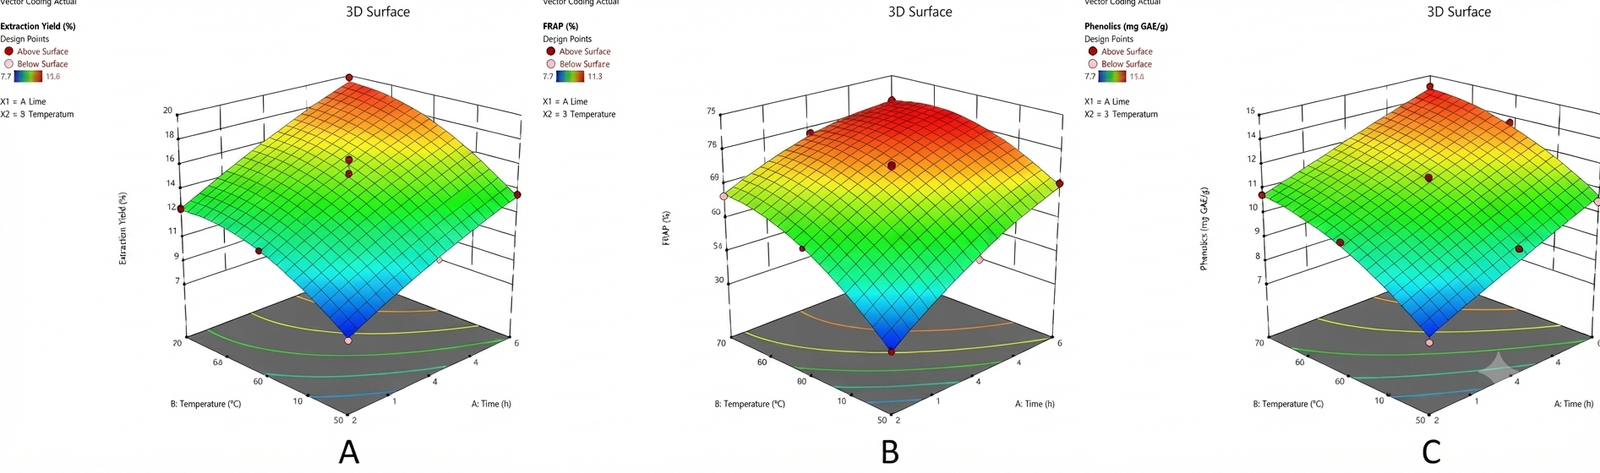
This non-monotonic FRAP behaviour indicates a thermal trade-off between enhanced phenolic solubilization and concurrent antioxidant degradation (19–20). At least three mechanisms may contribute to this behavior. First, compounds such as gallic acid and catechin derivatives undergo oxidative coupling and quinone formation above 50 °C, yielding polymeric products with diminished radical-scavenging and reducing capacity (21–22). Second, endogenous polyphenol oxidase (PPO) and peroxidase (POD) may retain activity during the early stages of heating before thermal denaturation occurs, catalyzing phenolic degradation in situ. This is particularly relevant at the 50–60 °C transition, where enzyme activity and thermal extraction overlap. Third, flavonoid glycosides and anthocyanins undergo hydrolytic cleavage and oxidative ring-opening at sustained elevated temperatures, directly reducing measurable FRAP activity (23). Thermal degradation of heat-labile phenolics, accompanied by concurrent oxidation reactions, plausibly accounts for the FRAP plateau (21–23). Notably, TPC continued to increase under prolonged high-temperature conditions, even as FRAP plateaued. This divergence reflects an analytical contrast between the two assays: the Folin–Ciocalteu reagent measures total reducing capacity and is not selective for intact phenolics. Therefore, oxidation products, polymerized phenolics, and non-phenolic reductones formed during prolonged heating may continue to register as apparent “phenolics,” even though they contribute little to electron-donating activity at the FRAP assay pH of approximately 3.6 (17). The TPC trend should therefore be interpreted as a measure of total reducing matter rather than as evidence that bioactive phenolics accumulate indefinitely with temperature. Compound-specific verification, such as HPLC analysis of marker phenolics under matched thermal stress, would be required to attribute the FRAP plateau to specific degradation pathways.
The plateau rather than a sharp decline suggests that extraction and degradation rates are competing rather than one dominating within the 50–70 °C window. This interpretation is consistent with reports that 60–65 °C represents a practical optimum for phenolic recovery from Annonaceae species (24). However, the relative contributions of individual degradation pathways cannot be quantified from the present data. The absence of time-resolved HPLC profiling or compound-specific thermal stability experiments means that the degradation narrative remains plausible but unvalidated.
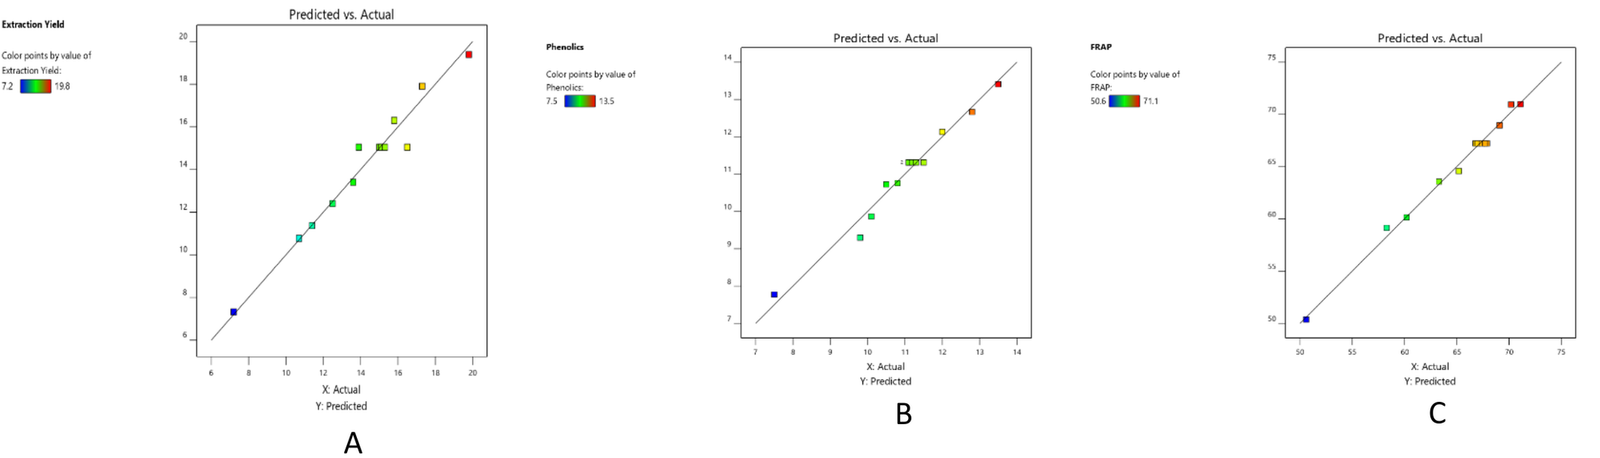
The predicted versus actual plots (Figure 2) further support the adequacy of the models developed in this study. For the extraction yield, FRAP, and total phenolics, the data points closely aligned with the 45° reference line, indicating a strong agreement between the experimental and predicted values. The tight clustering and minimal dispersion reflect a low residual error and high predictive accuracy across the studied range. Slight deviations observed under intermediate and extreme conditions are consistent with the previously discussed curvature and interaction effects observed in the 3D response surfaces (25). Importantly, no systematic bias (over- or under-prediction) was evident, indicating that the quadratic models captured the time–temperature effects governing the yield, phenolic recovery, and antioxidant activity.
Having established that extraction yield, TPC, and FRAP respond differently to temperature and time within the design space, with FRAP plateauing while yield and TPC continue to rise, the next step was to characterize the underlying rate behavior. Kinetic analysis was therefore conducted at the upper-boundary temperature (70 °C) to quantify how rapidly each response approaches equilibrium and to determine whether antioxidant-active compounds are mobilized on a similar time scale as the bulk extractable mass. This approach provides the rate-based information necessary to translate optimization outcomes into practical extraction times for scale-up.
Extraction Kinetics of Phenolic Antioxidants
Fitting to First-Order Kinetic Model
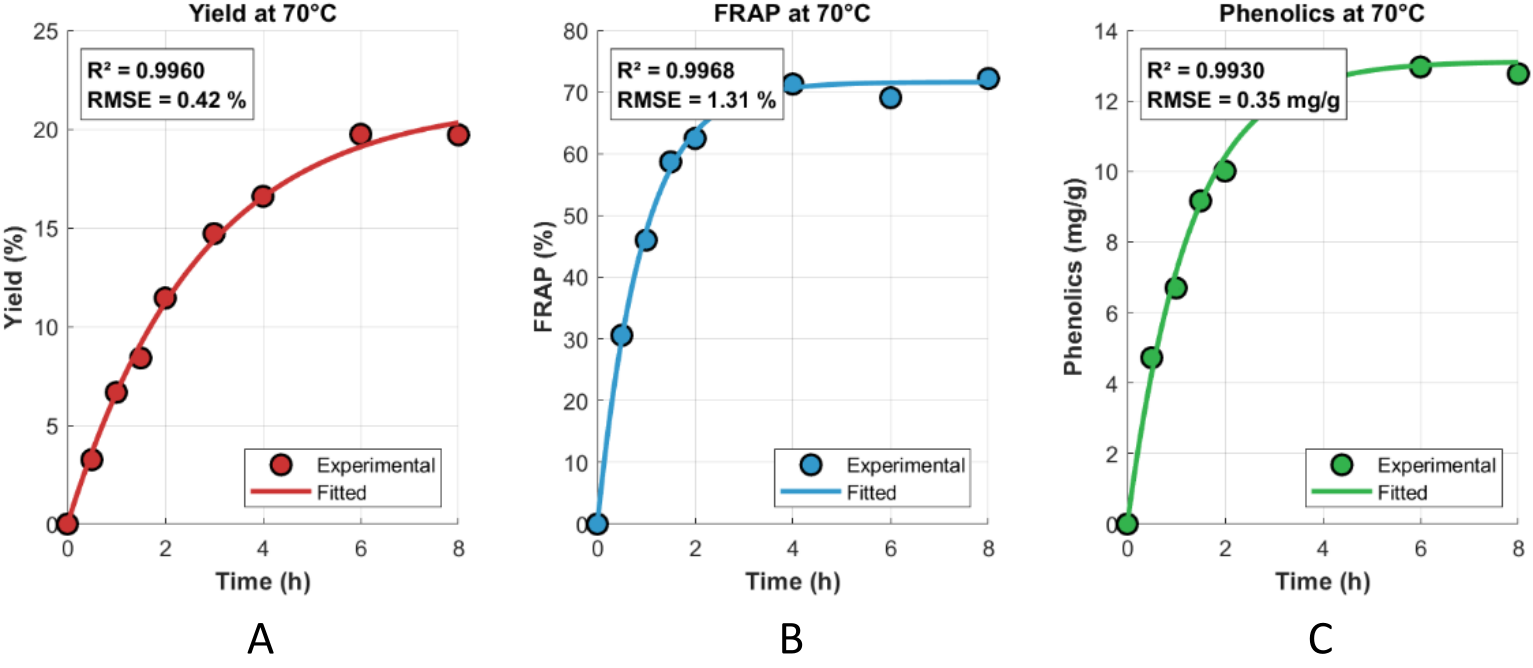
The first-order kinetic model described the extraction profiles at 70 °C with high R² values for all responses (0.9930–0.9968, Figure 3), and the biphasic pattern, rapid initial extraction followed by a slower approach to equilibrium, was consistent with the solid–liquid extraction theory (26,27). However, the linearized first-order plot (Figure 4) revealed response-dependent deviations that warrant critical examination. Extraction yield (R² = 0.9622) and FRAP (R² = 0.9226) showed acceptable linearity, supporting approximately first-order behavior for these responses. In contrast, TPC linearity was considerably weaker (R² = 0.7598), reflecting fundamental limitations of applying a single-component first-order model to a chemically heterogeneous extract, as examined in detail below.
Linearized Model Validation
The linearized first-order plots (Figure 4) indicate predominantly first-order behavior, with conformity varying among responses. The extraction yield (R² = 0.9622, k = 0.4045 h⁻¹) and FRAP (R² = 0.9226, k = 0.6067 h⁻¹) show strong fits that support a diffusion-controlled mechanism (28). The higher rate constant for FRAP than for yield suggests that antioxidant-active components are more readily mobilized. This practical insight indicates that shorter extraction times (approximately 1–2 h) may be adequate for recovering antioxidants, thus minimizing energy and solvent use without significantly compromising activity.
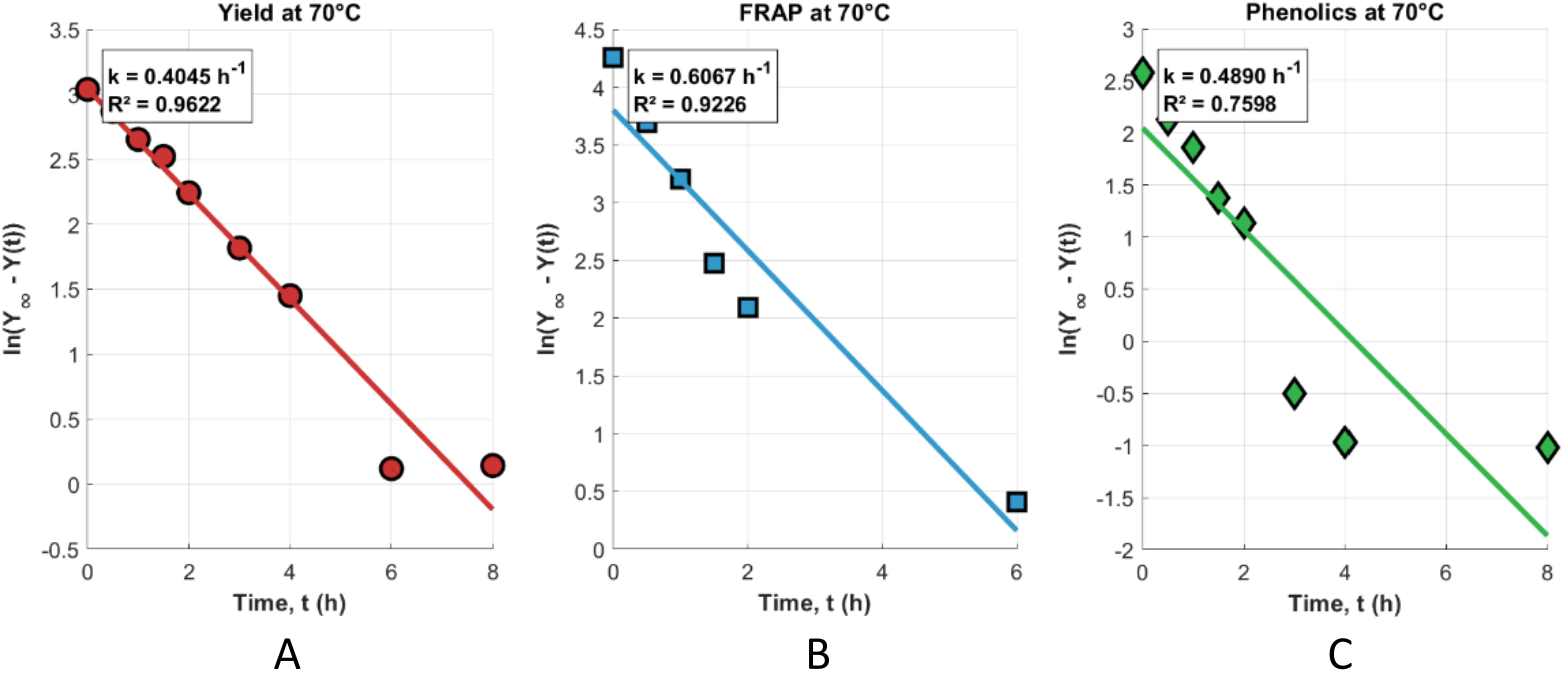
TPCs exhibited considerably weaker linearity (R² = 0.7598, k = 0.4890 h⁻¹). This weaker TPC linearity (R² = 0.7598, k = 0.4890 h⁻¹) is attributable to two concurrent mechanistic factors. First, phenolic compounds exist in structurally and locationally diverse pools; low-molecular-weight phenolics are extracted quickly in an approximately first-order manner, whereas cell wall-bound condensed tannins and lignin-linked hydroxycinnamic acids require longer diffusion paths or preliminary hydrolysis, producing a multi-compartment extraction profile incompatible with single-component first-order kinetics (29). Second, as noted in the discussion of the FRAP response surface above, simultaneous thermal degradation of heat-labile phenolics, anthocyanins, and certain flavonoid glycosides at 70 °C means that net TPC reflects a dynamic equilibrium between release and degradation that cannot be captured by a single first-order equation (22). Therefore, a two-compartment or bi-exponential kinetic model would more accurately describe total phenolic extraction from complex plant matrices and should be prioritized in future kinetic studies on P. longifolia; the present first-order approach is best regarded as a practical approximation.
Temperature Dependence: Arrhenius Parameters and Half‑Life
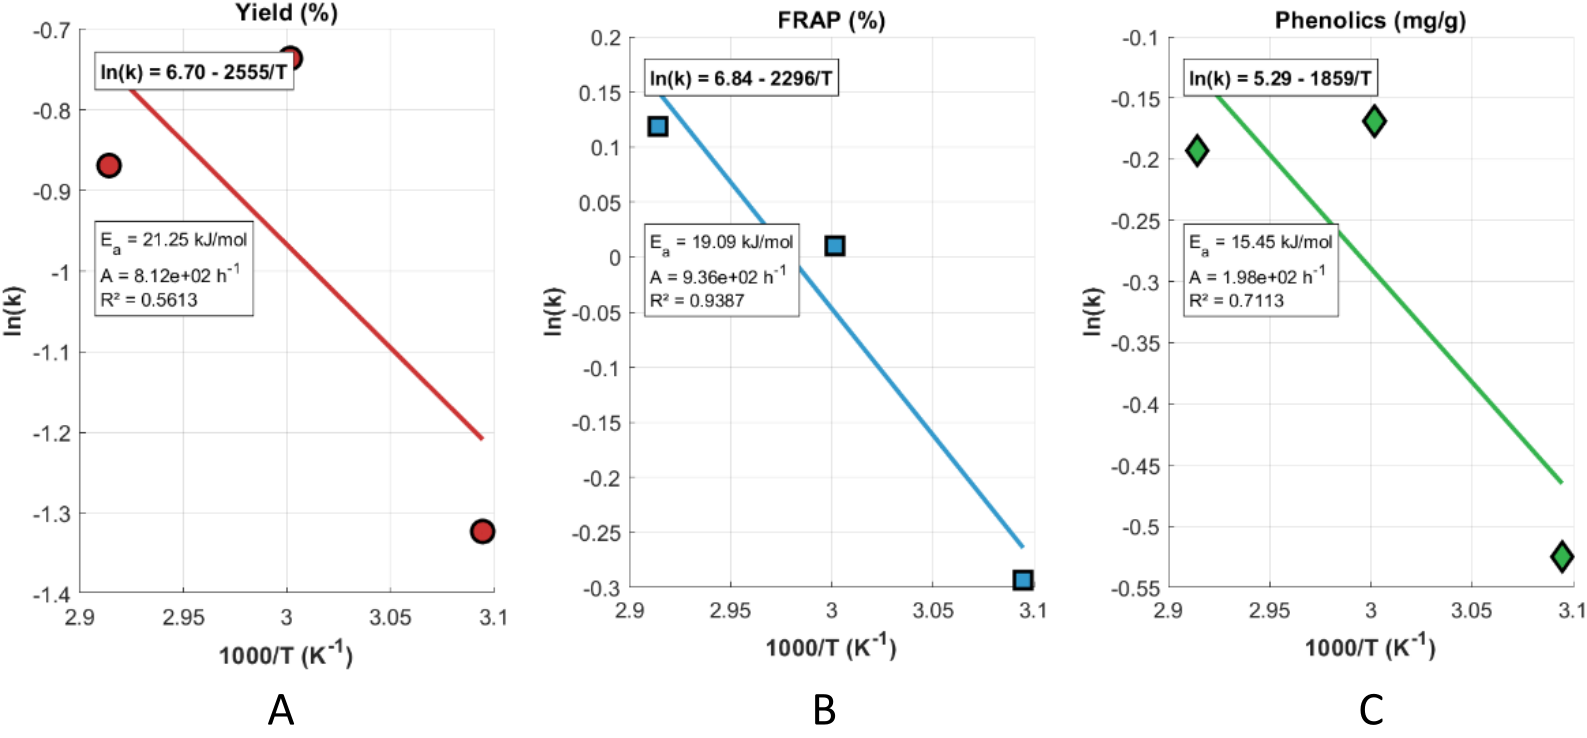
The Arrhenius plots (Figure 5) revealed markedly different degrees of linearity across responses, thereby challenging the assumption of uniform temperature dependence. The FRAP response showed acceptable Arrhenius linearity (R² = 0.9387, Ea = 19.09 kJ mol⁻¹). Within the narrow 50–70 °C window tested, this estimate is internally consistent but should not be extrapolated outside the studied range without additional data. TPC showed intermediate linearity (R² = 0.7113, Ea = 15.45 kJ mol⁻¹), with the weaker fit reflecting the competing effects of enhanced diffusion and thermal degradation discussed above. Critically, extraction yield produced a poor Arrhenius fit (R² = 0.5613), rendering the estimated Ea of 21.25 kJ mol⁻¹ of limited physical meaning for thermodynamic scale-up calculations. This weak correlation likely reflects the narrow 20 °C temperature range, the composite nature of extraction yield as an integrator of multiple parallel mass-transfer mechanisms each with distinct temperature coefficients, and temperature-dependent changes in solvent properties that may shift the dominant extraction mechanism across the studied range (22,30).
Mechanistic Interpretation and its Limits
The low activation energies (15–22 kJ mol⁻¹) are consistent with diffusion-limited behavior, which has already been supported by linearized kinetic data (Figure 4). However, classifying the mechanism as diffusion-controlled based on this alone is provisional. Definitive confirmation would require independent measurements of the effective diffusion coefficients, intraparticle diffusion modelling, or particle-size-dependent kinetic experiments, none of which were performed in this study. Therefore, the mechanistic interpretation advanced herein should be regarded as a working hypothesis rather than an established conclusion. Further rigorous investigations, such as varying the solid-to-solvent ratio or utilizing advanced microscopic surface analysis, would be necessary to validate this assumption. While the observed kinetic trends strongly suggest diffusion dominance, the influence of potential chemical reactions occurring at the interface cannot be entirely dismissed without additional empirical evidence, thereby necessitating a more cautious approach when interpreting the complex mass transfer phenomena within this specific extraction system.
Half-Life Comparison
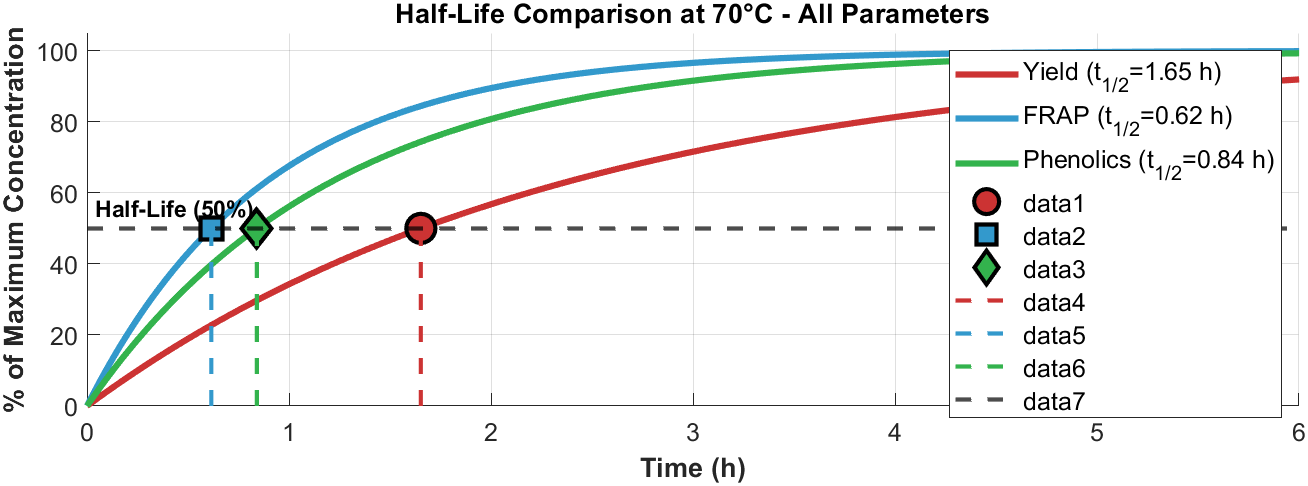
The half-life (t₁/₂) at 70 °C varied considerably among the responses (Figure 6); FRAP exhibited the shortest half-life (t₁/₂ = 0.62 h), indicating rapid mobilization of antioxidant-active compounds, likely low-molecular-weight phenolic acids and flavonoids with high solubility and surface accessibility (28,31). TPC showed an intermediate half-life (t₁/₂ = 0.84 h), consistent with the heterogeneity of the phenolic pool. Extraction yield recorded the longest half-life (t₁/₂ = 1.65 h), reflecting the slower mass transfer of less soluble or matrix-bound constituents (32). These differential half-lives reinforce the kinetic insight noted above: the more rapid mobilization of antioxidant-active compounds relative to the total extractable mass supports the use of shorter extraction times at the pilot scale, without substantial loss of bioactivity.
Conclusion
Hot maceration at the experimentally tested conditions (70 °C, 6 h, and 70 % ethanol) yielded 19.8 % extract, with 13.5 mg GAE/g total phenolics and 71.1 % FRAP activity from P. longifolia leaves. These findings, analyzed using response surface methodology and first-order kinetics (R² > 0.96), adequately described the extraction behavior within the studied domain. However, the optimum lies at the upper boundary of the experimental range, suggesting that the true maximum may exist beyond the conditions tested.
Scale-up predictions are constrained by the weak Arrhenius fit for extraction yield (R² = 0.5613) and by unexamined process factors, including solvent recovery, energy consumption, and extract stability under prolonged heating. The dome-shaped FRAP response further cautions against simply maximizing the temperature, as antioxidant degradation offsets gains in phenolic solubilization. This study was limited to a single technique (hot maceration), one solvent system, and two process variables. Future work should validate the kinetic model under pilot-scale conditions, test alternative models (e. g., bi-exponential or diffusion-based forms), extend the temperature–time domain to locate the true optimum, and benchmark the results against ultrasound-or microwave-assisted extraction. Compound-specific profiling (HPLC or LC-MS) is needed to identify the phenolics responsible for antioxidant activity and their individual thermal stability.
Declarations
Conflict of Interest
The author declares that there is no conflict of interest regarding the publication of this manuscript.
Data Availability
Data supporting the findings of this study are available from the corresponding author upon reasonable request.
Ethics Statement
Ethical approval was not required for this study.
Funding Information
The author(s) declare that no financial support was received for the research, authorship, and/or publication of this article.
Supplemental Material
Supplemental Data is available as supplementary material at the journal's website (<a class="cursor-pointer" href="https://etflin.com/file/document/20260506191922_334523_6863289d.docx">link</a>).
References
- Chang SK, Alasalvar C, Bolling BW, Shahidi F. Nuts and their co-products: The impact of processing (roasting) on phenolics, bioavailability, and health benefits – A comprehensive review. Journal of Functional Foods. 2016;26:88-122. doi: https://doi.org/10.1016/j.jff.2016.06.029
- Jakobek L, Blesso C. Beneficial effects of phenolic compounds: native phenolic compounds vs metabolites and catabolites. Critical Reviews in Food Science and Nutrition. 2023;64(25):9113-9131. doi: https://doi.org/10.1080/10408398.2023.2208218
- Abedelmaksoud TG, Younis MI, Altemimi AB, Tlay RH, Ali Hassan N. Bioactive Compounds of Plant‐Based Food: Extraction, Isolation, Identification, Characteristics, and Emerging Applications. Food Science & Nutrition. 2025;13(6):e70351. doi: https://doi.org/10.1002/fsn3.70351
- Suthar A, Chauhan V, Katkar K. The chemistry, pharmacologic, and therapeutic applications of Polyalthia longifolia. Phcog Rev. 2010;4(7):62. doi: https://doi.org/10.4103/0973-7847.65329
- Chen YC, Chia YC, Huang BM. Phytochemicals from Polyalthia Species: Potential and Implication on Anti-Oxidant, Anti-Inflammatory, Anti-Cancer, and Chemoprevention Activities. Molecules. 2021;26(17):5369. doi: https://doi.org/10.3390/molecules26175369
- Tirado-Kulieva VA, Sánchez-Chero M, Villegas Yarlequé M, Villegas Aguilar GF, Carrión-Barco G, Ygnacio Santa Cruz AG, Sánchez-Chero J. An overview on the use of response surface methodology to model and optimize extraction processes in the food industry. Curr Res Nutr Food Sci. 2021;9(3):745–754. doi:10.12944/CRNFSJ.9.3.03.
- Kumar T, Sampath M, Sivachandran S, Shanmugam S, Rajasekaran P. Optimal process for the extraction and identification of flavonoids from the leaves of Polyalthia longifolia using L16 Orthogonal design of experiment. International Journal of Biological and Chemical Sciences. 2009;3(4):736–745. doi: https://doi.org/10.4314/ijbcs.v3i4.47184
- Annapureddy PKR, Kishore N. Non-isothermal pyrolysis of Polyalthia longifolia using thermogravimetric analyzer: kinetics and thermodynamics. J Renew Sustain Energy. 2023;15(5):053101. doi:10.1063/5.0160104.
- Choudhary M, Bhattacharyya KG. Aqueous removal of arsenic (III) using acid treated Polyalthia longifolia leaf powder. J Appl Fundam Sci. 2015;1(1):98–106.
- Galgano F, Tolve R, Colangelo MA, Scarpa T, Caruso MC. Conventional and organic foods: A comparison focused on animal products. Cogent Food & Agriculture. 2016;2(1):1142818. doi: https://doi.org/10.1080/23311932.2016.1142818
- Mohamad Said KA, Mohamed Amin MA. Overview on the Response Surface Methodology (RSM) in Extraction Processes. Jaspe. 2016;2(1):8–17. doi: https://doi.org/10.33736/jaspe.161.2015
- Peng Y, Bishop KS, Quek SY. Extraction optimization, antioxidant capacity and phenolic profiling of extracts from flesh, peel and whole fruit of New Zealand grown feijoa cultivars. Antioxidants (Basel). 2019;8(5):141. doi:10.3390/antiox8050141.
- Yuan G, Yuan H, Zhao Y, Liang Z. Characterization of organic release kinetics in particleboard using a dual model fitting methodology. RSC Adv. 2023;13(47):33446-33452. doi: https://doi.org/10.1039/d3ra03587e
- Ndukwe GI, Tetam JG, Clark PD. Phytochemical screening and in vitro antioxidant assessment of Cassia alata (Linn) leaf extracts. ChemSearch J. 2020;11(2):64–72.
- Singer JM, Pedroso-de-Lima AC, Tanaka NI, González-López VA. To triplicate or not to triplicate?. Chemometrics and Intelligent Laboratory Systems. 2007;86(1):82-85. doi: https://doi.org/10.1016/j.chemolab.2006.08.008
- Clark PD, Ndukwe GI, Awatefe KJ. Phytochemical characterization and evaluation of antioxidant activity in Sorghum bicolor leaves extracts. Sci Phytochem. 2026;5(1):31–42.
- Dominguez-López I, Pérez M, Lamuela-Raventós RM. Total (poly)phenol analysis by the Folin-Ciocalteu assay as an anti-inflammatory biomarker in biological samples. Critical Reviews in Food Science and Nutrition. 2023;64(27):10048-10054. doi: https://doi.org/10.1080/10408398.2023.2220031
- Clark P, Otutu J, Asiagwu AK, Ndukwe G. Exploring the Potential of Dacryodes Edulis Leaf Extract as Natural Colourant on Polyamide Fabrics: Extraction, Characterization and Application. Substantia. 2024;8(1):114. doi: https://doi.org/10.36253/substantia-2604
- Wu Y, Wang X, Xue J, Fan E. Plant phenolics extraction from Flos Chrysanthemi: Response surface methodology-based optimization and the correlation between extracts and free radical scavenging activity. J Food Sci. 2017;82(11):2726–33. doi:10.1111/1750-3841.13916
- Weremfo A, Abassah‐Oppong S, Adulley F, Dabie K, Seidu‐Larry S. Response surface methodology as a tool to optimize the extraction of bioactive compounds from plant sources. J Sci Food Agric. 2022;103(1):26-36. doi: https://doi.org/10.1002/jsfa.12121
- Hagar AY, Ibrahim M, Ahmed IA, Ramli N, Mhd Jalil AM, Abd Rani NF. Optimisation of phenolic compounds and antioxidant capacity of Trigona honey and propolis using response surface methodology from fermented food products. Ifrj. 2021;28(6):1233-1244. doi: https://doi.org/10.47836/ifrj.28.6.15
- Silva MO, Castro RJS. First-order degradation kinetics of phenolic compounds and antioxidant properties of fresh and enzymatically hydrolyzed seriguela pulp (Spondias purpurea L.). ACS Food Sci Technol. 2025;5(9):3520–9. doi:10.1021/acsfoodscitech.5c00554.
- Firuzi O, Lacanna A, Petrucci R, Marrosu G, Saso L. Evaluation of the antioxidant activity of flavonoids by “ferric reducing antioxidant power” assay and cyclic voltammetry. Biochimica et Biophysica Acta (BBA) - General Subjects. 2005;1721(1-3):174-184. doi: https://doi.org/10.1016/j.bbagen.2004.11.001
- Okeke UJ, Micucci M, Mihaylova D, Cappiello A. The effects of experimental conditions on extraction of polyphenols from African Nutmeg peels using NADESs-UAE: A Multifactorial Modelling Technique. Preprint. 2024. doi: https://doi.org/10.21203/rs.3.rs-3931581/v1
- Zgórka G, Adamska-Szewczyk A, Baj T. Response Surface Methodology in Optimising the Extraction of Polyphenolic Antioxidants from Flower Buds of Magnolia × soulangeana Soul.-Bod. var. ‘Lennei’ and Their Detailed Qualitative and Quantitative Profiling. Molecules. 2023;28(17):6335. doi: https://doi.org/10.3390/molecules28176335
- Abraham-Diego JI, Reynel-Ávila HE, Bonilla-Petriciolet A, Moreno-Pérez J. Experimental Intensification and Modeling of Solid–Liquid Extraction of Polyphenols From Rice Husk Waste Using Organic Solvents. International Journal of Chemical Engineering. 2024;2024(1):7145617. doi: https://doi.org/10.1155/2024/7145617
- Abishli R, Albarri R, Şahin S. Mass transfer, kinetics, and thermodynamics studies during the extraction of polyphenols from Feijoa sellowiana peels. J. Food Process. Preserv. 2021;45(9):e15736. doi: https://doi.org/10.1111/jfpp.15736
- Hobbi P, Okoro OV, Delporte C, Alimoradi H, Podstawczyk D, Nie L, et al. Kinetic modelling of the solid–liquid extraction process of polyphenolic compounds from apple pomace: influence of solvent composition and temperature. Bioresour. Bioprocess. 2021;8(1):114. doi: https://doi.org/10.1186/s40643-021-00465-4
- Sridhar A, Ponnuchamy M, Kumar PS, Kapoor A, Vo DVN, Prabhakar S. Techniques and modeling of polyphenol extraction from food: a review. Environ Chem Lett. 2021;19(4):3409-3443. doi: https://doi.org/10.1007/s10311-021-01217-8
- Natolino A, Passaghe P, Brugnera G, Comuzzo P. Intensification of grape marc (Vitis vinifera) exploitation by subcritical water-ethanol extraction: Effect on polyphenol bioactivities and kinetic modelling. Journal of Food Engineering. 2024;381:112185. doi: https://doi.org/10.1016/j.jfoodeng.2024.112185
- Antony A, Farid M. Effect of temperatures on polyphenols during extraction. Appl Sci. 2022;12(4):2107. doi:10.3390/app12042107.
- Xavier L, Pisani J, Meghirditchian G, de Mattos R, Vieitez I, Barrenengoa M, et al. Extraction of phenolic compounds from apple pomace, process modeling and antioxidant potential evaluation of extracts. Int J Food Eng. 2022;18(7–8):547–558. doi:10.1515/ijfe-2022-0012.