RESEARCH ARTICLE
Predicting Sun Bear (Helarctos malayanus) Habitat Suitability Using MaxEnt in West Sumatra, Indonesia
Tropical Animals|Vol. 2, Issue 1, pp. 33-44 (2026)
CC BY 4.0-2026 Authors
Views
Downloads
Shares

Received
Apr 15, 2026Revised
May 23, 2026Accepted
Jun 4, 2026Published
Jun 30, 2026
Abstract
Rapid forest degradation and land-use change in West Sumatra threaten the persistence of sun bear (Helarctos malayanus) populations by altering habitat availability and increasing human–wildlife conflict. This study aimed to predict habitat suitability and identify key environmental drivers influencing the distribution of sun bears using the Maximum Entropy (MaxEnt) model. A final dataset of 167 verified occurrence records—obtained after filtering and spatially thinning an initial pool of 466 field-compiled presence points to mitigate sampling bias—was analyzed alongside multiple environmental variables. The model demonstrated high predictive performance (AUC = 0.922 ± 0.004), indicating strong reliability in estimating habitat suitability. Quantitatively, less suitable habitats covered 46.23% (314,471.97 ha), suitable habitats 32.85% (223,493.41 ha), and highly suitable habitats 20.92% (142,305.43 ha). Results revealed that suitable habitats are spatially heterogeneous, with high-suitability zones primarily concentrated in protected and conservation forests, contributing 55% and 44% of suitable habitats, respectively, while production forests accounted for only 1%. Elevation (31.1%), land use (21.4%), precipitation (15.5%), and distance from roads (11.7%) were identified as the most influential variables. Sun bears showed a preference for elevations of 1,500–2,000 m, primary and secondary forests, rainfall of 240–260 mm/month, and areas located 4–5 km away from roads and settlements. These findings provide critical spatial insights for conservation planning, emphasizing the importance of protecting forested landscapes and managing anthropogenic disturbances to ensure the long-term survival of sun bear populations in West Sumatra.
Introduction
Forests constitute complex ecological systems that sustain high levels of biodiversity and provide essential ecosystem services for both wildlife and human populations. In Indonesia, forests are legally defined as integrated ecosystems dominated by tree vegetation and functioning as interconnected biotic and abiotic components (1). However, rapid forest degradation has emerged as a critical environmental issue. Indonesia is reported as one of the countries with the highest deforestation rates globally, reaching approximately two million hectares annually (2). In West Sumatra, forest landscapes are characterized by highly variable topography, ranging from lowlands to mountainous regions exceeding 2, 500 meters above sea level. Despite relatively high forest cover (46%), a substantial portion of land approximately 630,695 hectares is categorized as critical or highly degraded (3). This condition poses a serious threat to biodiversity conservation, particularly for forest-dependent species such as the sun bear (Helarctos malayanus), whose survival is closely linked to habitat integrity.
The sun bear (H. malayanus), the smallest member of the Ursidae family, inhabits a wide range of tropical forest ecosystems, including primary forests, secondary forests, and selectively logged or disturbed habitats (4, 5). This species plays an important ecological role in tropical forest ecosystems, particularly in seed dispersal and maintaining forest dynamics. However, these bears are increasingly threatened by anthropogenic pressures such as habitat loss, degradation, poaching, and land-use change driven by agricultural expansion (6, 7). Furthermore, limited ecological data on population size, spatial distribution, and mortality rates continue to constrain effective conservation planning for H. malayanus (6, 8). As a result, many populations have become fragmented and isolated, increasing their vulnerability to local extinction. Globally, the species is classified as Vulnerable on the IUCN Red List and is listed under Appendix I of CITES, prohibiting international trade (8, 9). In Indonesia, it is legally protected under Ministerial Regulation No. 106 of 2018 (10). In West Sumatra, populations are still found in forested areas such as the Kerinci Seblat National Park, yet increasing human–wildlife conflicts have been reported in regions including Agam, Pasaman, and Limapuluh Kota due to habitat encroachment and food scarcity (11). These severe local conflicts indicate an escalating ecological imbalance, underscoring the urgent need for a regional MaxEnt model to establish spatially explicit habitat management and conflict-mitigation strategies.
Addressing these challenges requires localized, high-resolution predictive tools capable of capturing regional ecological nuances. While broad-scale species distribution models have been developed across Southeast Asia, they often smooth over the highly rugged topographic gradients and complex mosaic landscapes characteristic of West Sumatra, rendering them less applicable for provincial wildlife zoning. West Sumatra represents a critical yet underexplored region where steep elevational shifts from coastal lowlands to montane zones exceeding 2,500 m drive unique microclimatic dynamics and distinct human-wildlife conflict clusters. Consequently, a region-specific modeling framework is vital to address local conservation demands. This study aims to predict the spatial distribution of suitable habitats for H. malayanus in West Sumatra and to identify the primary environmental drivers influencing these patterns. By integrating refined field occurrence data (2019–2022) with localized biophysical and anthropogenic predictors, this study establishes a high-resolution baseline to inform regional corridor design and threat mitigation strategies.
Methodology
Study Design and Rationale
This study employed a spatially explicit species distribution modeling (SDM) approach to predict habitat suitability for the sun bear (Helarctos malayanus) in West Sumatra, Indonesia. The modeling framework was based on the Maximum Entropy (MaxEnt) algorithm, a presence-only modeling technique widely recognized for its robustness in predicting species distributions under limited occurrence data conditions (12). The rationale for selecting MaxEnt lies in its ability to estimate species–environment relationships using incomplete datasets while maintaining high predictive performance (13). This approach is particularly suitable for elusive and wide-ranging species such as the sun bear, for which absence data are often unreliable or unavailable.
Study Area
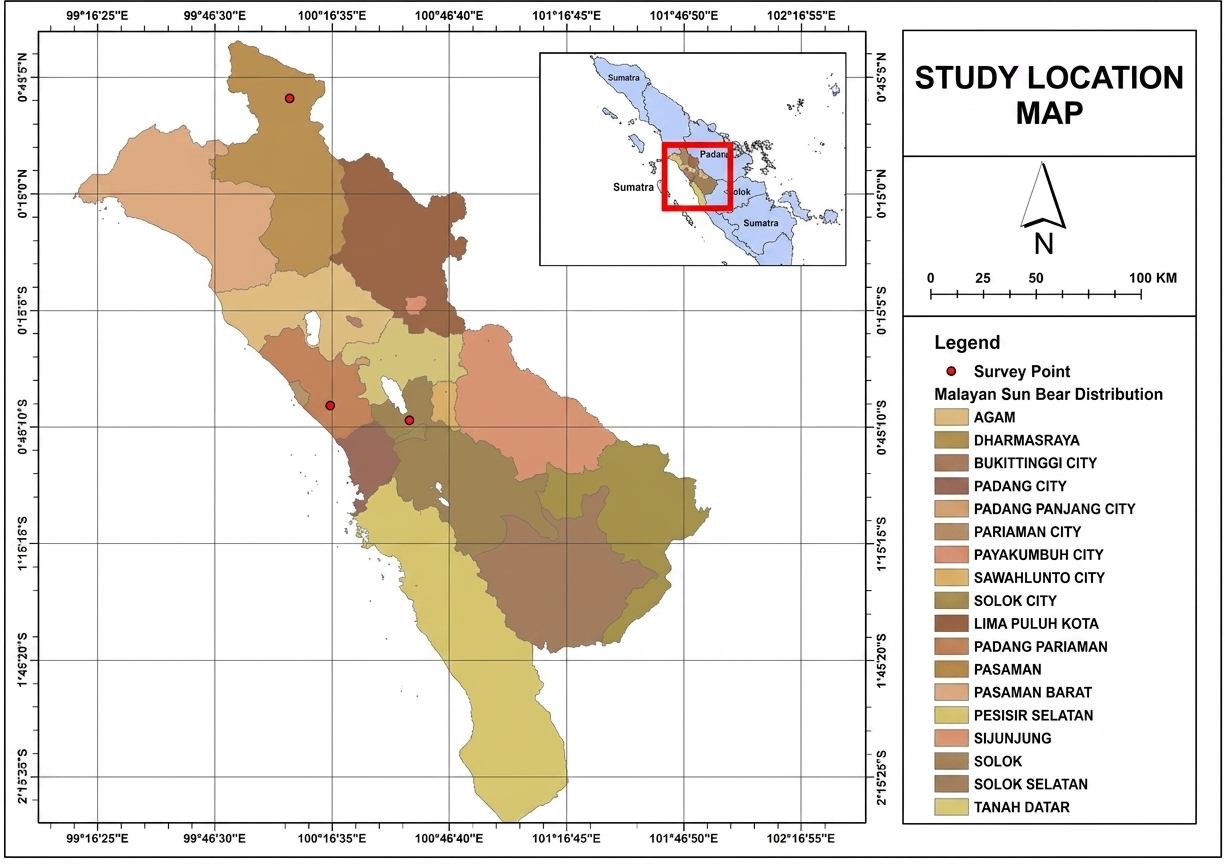
The study was conducted across forested landscapes in West Sumatra Province, Indonesia, including key regions such as Solok and Pasaman (Figure 1). Geographically, the province is bordered by North Sumatra to the north, Riau to the east, Jambi and Bengkulu to the south, and the Indian Ocean to the west. The region spans an elevation gradient from sea level to approximately 3,805 m above sea level at Mount Kerinci, with predominantly tropical rainforest climate conditions characterized by annual rainfall ranging from 3,000 to 7,929 mm (Bappenas Sumatera Barat, 1994). Forest cover in the province is extensive (± 2,380,057 ha) and includes conservation areas (KSA/KPA), protected forests (HL), and various production forest categories (SK.35/Menhut-II/2014). This ecological heterogeneity provides a suitable context for evaluating habitat preferences of sun bears.
Species Occurrence Data
Species occurrence data consisted of georeferenced presence records of H. malayanus obtained from the Sintas Indonesia Foundation, covering the period from 2019 to 2022. A total of 466 occurrence points were initially compiled from field-based occupancy surveys, including both direct sightings and indirect evidence such as tracks and signs. To reduce sampling bias and spatial autocorrelation, these points were filtered using a spatial thinning protocol that retained only a single independent presence point within a 1 km² grid cell, resulting in 167 high-quality records utilized in the final model execution. These data were processed and formatted into comma-separated values (CSV) files using Microsoft Excel Version 2013 for compatibility with the modeling software. To ensure species protection and prevent misuse of sensitive ecological data, the exact geographic coordinates were not disclosed in this publication.
Environmental Variables
A total of eleven environmental predictor variables were incorporated into the model to represent biophysical and anthropogenic factors influencing habitat suitability (Table 1). These included land cover, climate variables (temperature and precipitation), elevation, vegetation index, slope, and distance-based variables (distance to rivers, roads, and plantations). Environmental datasets were derived from multiple secondary sources, including Digital Elevation Model (DEM), Global Forest Watch, Indonesia Geospatial Portal, WorldClim bioclimatic datasets, and institutional datasets from KLHK and Sintas Indonesia.
| AUC Value | Model Performance |
|---|---|
| 0.9 – 1.0 | Excellent |
| 0.8 – 0.9 | Good |
| 0.7 – 0.8 | Moderate |
| 0.6 – 0.7 | Poor |
Prior to modeling, all environmental layers were standardized to a uniform spatial resolution of 30 arc-seconds (~1 km) and clipped to the provincial boundary using the resampling function in ArcGIS 10.3 (ESRI, Redlands). To correct for sampling bias and mitigate spatial autocorrelation, the initial 466 field-compiled occurrence records were subjected to spatial thinning, retaining only a single unique presence record within any single 1 km² grid cell, which reduced the final modeling dataset to 167 independent points. Multicollinearity among environmental variables was assessed using Pearson correlation analysis. Highly correlated variables exceeding a threshold of r > 0.5 were excluded to reduce statistical redundancy and prevent overprediction (14). This threshold is more conservative than standard modeling practices but was strictly applied to effectively separate the overlapping influences of elevation, temperature ranges, and precipitation regimes across the region's steep topographic gradients, ensuring that only independent and ecologically meaningful predictors were retained.
Model Development and Parameterization
Habitat suitability modeling was conducted using MaxEnt software version 3.3.3k, executed within a Java-based environment. The model utilized presence-only occurrence data alongside environmental predictor layers to estimate the probability distribution of suitable habitats across the study area. Model settings were configured using default parameters with specific adjustments to improve robustness: 25% of the occurrence data were randomly assigned for testing, while the remaining 75% were used for training. The model was run with 10 bootstrap replicates to assess stability and reduce sampling bias. The regularization multiplier was set to 1, and the maximum number of iterations was fixed at 5,000 to ensure model convergence.
The output of the MaxEnt model was generated in logistic format, representing habitat suitability values ranging from 0 (unsuitable) to 1 (highly suitable). Model performance was evaluated using the Area Under the Receiver Operating Characteristic Curve (AUC), which measures the model’s ability to discriminate between suitable and unsuitable habitats across all threshold values (15, 16). Higher AUC values indicate better predictive performance.
Variable Contribution and Response Analysis
The relative importance of environmental variables was assessed using two complementary approaches: percent contribution and Jackknife analysis. The percent contribution reflects the heuristic importance of each variable during model training, while the Jackknife test evaluates the individual and combined effects of variables on model performance. Three metrics were examined in the Jackknife analysis: training gain, test gain, and AUC. These metrics provide insights into how each variable influences model accuracy when used independently or excluded from the model (12).
Additionally, response curves were generated to examine the relationship between each environmental variable and predicted habitat suitability. These curves allow for the identification of optimal environmental conditions for H. malayanus, thereby enhancing ecological interpretation of the model outputs (17).
Habitat Suitability Classification
The continuous habitat suitability outputs from MaxEnt were converted into discrete, ecologically meaningful categories by applying the model-generated 10-percentile training presence logistic threshold (0.2295). Areas with probabilities below this threshold were classified as less suitable, while values above it were classified into suitable and highly suitable habitat zones. This classification process was conducted by converting ASCII output files into raster format using the “ASCII to Raster” tool in ArcGIS. The resulting habitat suitability map was then overlaid with land-use and forest function layers to analyze spatial patterns of habitat distribution across different landscape types.
Ethical Considerations
This study utilized secondary data from authorized institutional sources and did not involve direct interaction with wildlife. Sensitive location data for sun bear occurrences were anonymized to prevent potential exploitation or disturbance. Data use was conducted with permission from the Sintas Indonesia Foundation, ensuring compliance with ethical standards in wildlife research and conservation.
Results and Discussion
Habitat Distribution Modeling Using MaxEnt
The MaxEnt model generated a spatially explicit prediction of the habitat distribution of the sun bear (H. malayanus) across West Sumatra based on occupancy survey data and environmental predictors. A total of 167 occurrence records, derived from both direct and indirect field observations, were used as input for the modeling process. The model incorporated ten environmental variables representing biophysical and anthropogenic factors influencing species presence.
Figure 2 displays the baseline continuous probability surface generated by the MaxEnt model prior to binary classification. This continuous landscape highlights gradual environmental transitions and spatial variations in habitat suitability across West Sumatra. Delineating these explicit, actionable habitat boundaries for management purposes requires transforming this continuous probabilistic output into discrete categories via threshold selection, which is addressed in subsequent sections.
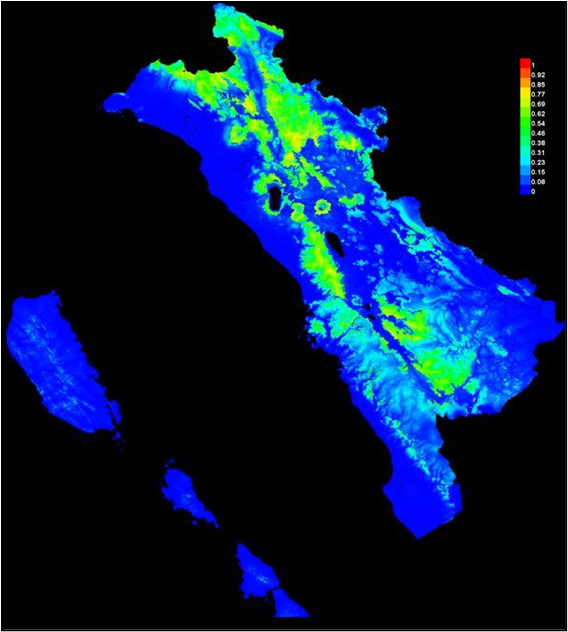
The application of a threshold is therefore essential for translating model predictions into actionable categories, such as “suitable” and “unsuitable” habitats. In the context of this study, thresholding facilitates decision-making processes by simplifying the interpretation of spatial patterns and enabling the delineation of habitat zones relevant for conservation planning. However, at this stage, Figure 2 serves as a baseline representation of the modeled ecological niche of H. malayanus in West Sumatra, capturing the probabilistic distribution of habitat suitability prior to classification.
Threshold-Based Habitat Suitability Classification
The MaxEnt-derived habitat suitability model was further refined through the application of a threshold to distinguish between levels of habitat suitability for H. malayanus in West Sumatra. The threshold applied in this study was the 10 percentile training presence logistic threshold, with a value of 0.2295, as determined by the MaxEnt output. This threshold enabled the conversion of continuous probability values into discrete habitat suitability classes, namely: less suitable, suitable, and highly suitable habitats.
It is important to note that the resulting model represents a predictive approximation of habitat suitability rather than an exact depiction of ecological reality. This is inherent to species distribution modeling, where complex ecological processes are simplified into statistical relationships between species occurrence and environmental variables. Consequently, while the model may not fully capture all ecological dynamics influencing sun bear distribution, it provides a reliable and widely accepted approach for estimating habitat suitability and understanding species–environment interactions. Such predictive models are particularly valuable for assessing species responses to environmental gradients and informing conservation planning under data-limited conditions.
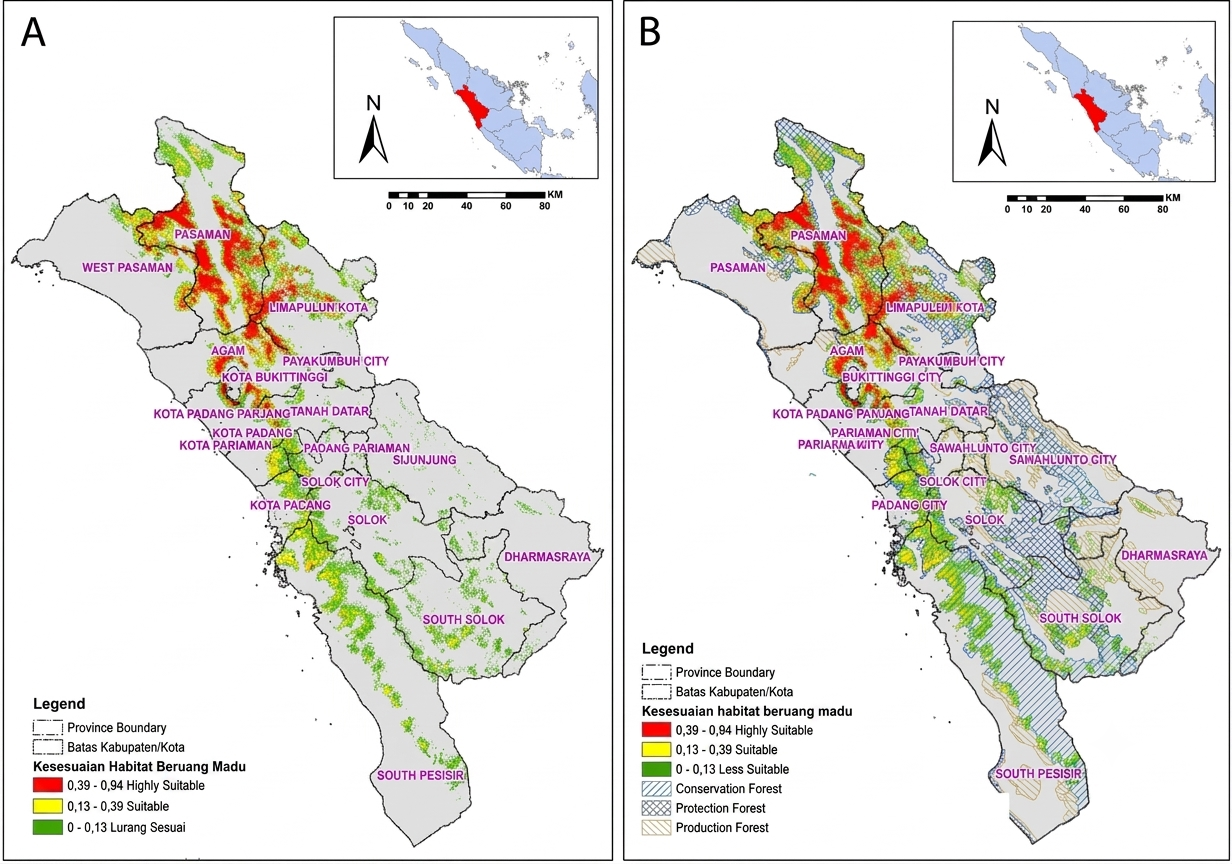
The classified habitat suitability map (Figure 3A) illustrates a clear spatial differentiation of habitat categories across the study area. The visualization employs a color gradient to enhance interpretability: green represents less suitable habitats with low probability of occurrence, yellow indicates moderately suitable habitats with intermediate probability, and red denotes highly suitable habitats with a high likelihood of species presence. The spatial distribution of these classes corresponds closely with recorded occurrence points, suggesting consistency between model predictions and empirical observations.
The presence of highly suitable habitats (red zones) indicates areas that likely provide essential ecological requirements, particularly food availability. This finding is consistent with ecological theory, which identifies food resources as a key limiting factor influencing wildlife distribution and habitat selection (18). In conditions where food availability is insufficient, wildlife species—including sun bears—tend to shift their range in search of more favorable habitats. Therefore, the clustering of high suitability areas may reflect regions with adequate resource availability supporting the persistence of H. malayanus populations.
Furthermore, the predicted distribution map (Figure 3A) provides a spatial representation of habitat conditions that are conducive to species survival, making it a valuable tool for conservation decision-making. Habitat suitability models such as this have been widely recognized as effective tools for identifying priority areas for conservation and informing ecosystem management strategies, as they enable the spatial delineation of suitable habitats and support evidence-based decision-making in biodiversity conservation (19, 20).
Quantitatively, the extent of each habitat suitability class is presented in Table 2. Less suitable habitats dominate the study area, covering approximately 314,471.97 ha (46.23%), followed by suitable habitats at 223,493.41 ha (32.85%), and highly suitable habitats at 142,305.43 ha (20.92%), out of a total modeled area of 680,270.81 ha. This total modeled area is intentionally smaller than the province's total forest cover of 2.3 million hectares, as the spatial boundary of the predictive model was restricted to the core public forest estates under active provincial management zones where consistent occupancy data were available, excluding highly isolated fragments and unmanaged private lands.
| Category | Area (ha) | Percentage (%) |
|---|---|---|
| Less Suitable | 314,471.97 | 46.23 |
| Suitable | 223,493.41 | 32.85 |
| Highly Suitable | 142,305.43 | 20.92 |
| Total | 680,270.81 | 100 |
Predicted Distribution of Sun Bear Habitat Based on Forest Functional Zones
The spatial modeling results indicate that H. malayanus exhibits a clear preference for forested landscapes, particularly dense and protected forest areas, while showing lower suitability in cultivated or managed landscapes. The model suggests that sun bears tend to avoid open areas and regions with high anthropogenic disturbance, such as road networks. Furthermore, the predicted habitat distribution is not evenly distributed across the study area, highlighting spatial heterogeneity in habitat suitability. This uneven distribution may pose a significant long-term risk to population persistence, as fragmented and isolated suitable habitats can limit species movement and increase vulnerability to local extinction. Therefore, understanding the spatial configuration of suitable habitats is essential for identifying conservation priorities and mitigating potential threats.
The predicted distribution map based on forest functional zones (Figure 3B) reveals that areas with high habitat suitability are predominantly located within protected landscapes, particularly in the northern regions of West Sumatra. These areas are characterized by extensive forest cover and relatively low levels of human disturbance, providing optimal ecological conditions for the survival of sun bears. The concentration of highly suitable habitats within protected areas underscores the critical role of conservation zones in maintaining viable populations of H. malayanus.
Further analysis of habitat distribution across forest functional categories (Figure 4) demonstrates the relative contribution of each land-use type to habitat suitability. The results indicate that two forest categories dominate the distribution of suitable habitats: protected forests contribute the highest proportion at 55%, followed by conservation forests at 44%. In contrast, production forests contribute only 1% of the total suitable habitat area, indicating minimal importance in supporting sun bear populations.
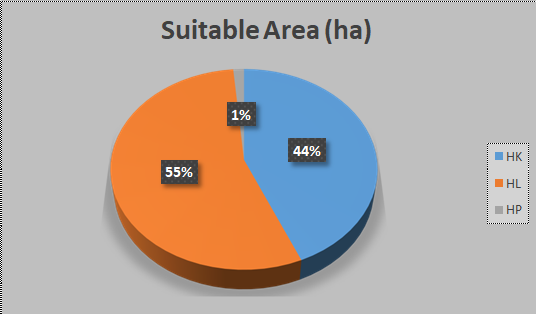
These findings highlight the ecological importance of protected and conservation forests as primary habitats for sun bears in West Sumatra. Protected forests, which are designated to preserve ecological functions and biodiversity, provide essential resources such as food availability, shelter, and breeding sites, thereby supporting species persistence. Similarly, conservation forests play a vital role in maintaining ecosystem stability and minimizing anthropogenic pressures, which likely explains the relatively high presence of suitable habitats within these areas.
In contrast, production forests appear to be less suitable for sun bears, as indicated by their minimal contribution (1%) to habitat suitability. This is likely due to the intensive resource extraction activities commonly associated with these areas, such as logging and land conversion, which can degrade habitat quality and reduce resource availability. Overall, these results emphasize that protected and conservation forest areas are critical for sustaining sun bear populations, as they offer relatively undisturbed environments that fulfill the ecological requirements of the species.
Model Accuracy and Predictive Performance
The predictive performance of the MaxEnt model was evaluated using sensitivity–specificity analysis and the Area Under the Receiver Operating Characteristic Curve (AUC). The sensitivity–specificity plot (Figure 5) illustrates the model’s ability to discriminate between suitable and unsuitable habitats for H. malayanus in West Sumatra.
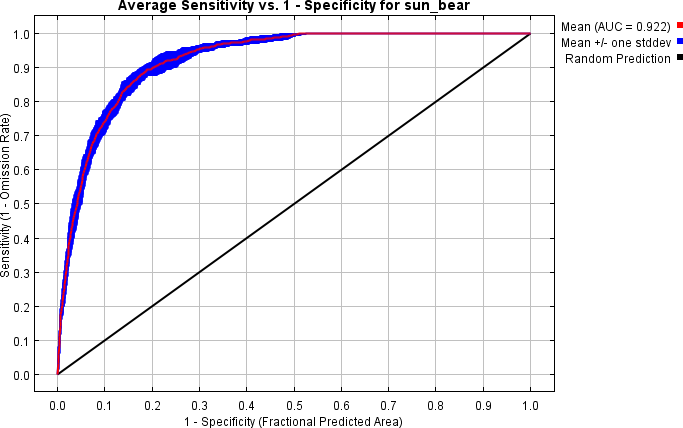
The model demonstrated a high level of predictive accuracy, with an AUC value of 0.922 and a standard deviation of 0.004, indicating excellent model performance. AUC values exceeding 0.9 are generally considered to represent high accuracy in distinguishing presence from absence. The low standard deviation further suggests that the model is stable and consistent across replicate runs. In Figure 5, the red line represents the mean AUC, while the blue line indicates the variability (standard deviation) across model iterations. The proximity of the curve to the value of 1.0, combined with minimal deviation, confirms that the model provides a robust and reliable prediction of sun bear habitat suitability in the study area. These results indicate that the MaxEnt model is well-suited for predicting the spatial distribution of H. malayanus under the given environmental conditions, supporting its application in conservation planning and habitat management.
Habitat Suitability in Relation to Environmental Variables
The influence of environmental variables on habitat suitability was further examined using response curves, which describe the relationship between each predictor variable and the probability of species occurrence. Overall, four key variables were identified as having the strongest influence on habitat suitability: elevation, land use, precipitation, and distance from roads.
The response curve for elevation (Figure 6) indicates that H. malayanus shows a higher probability of occurrence at elevations of approximately 1,500–2,000 m above sea level. Although sun bears are generally associated with lowland forests, they are known to occur across a broad elevational range, including higher elevations (8, 21). This pattern may reflect local habitat conditions or increasing disturbance in lowland areas of West Sumatra.
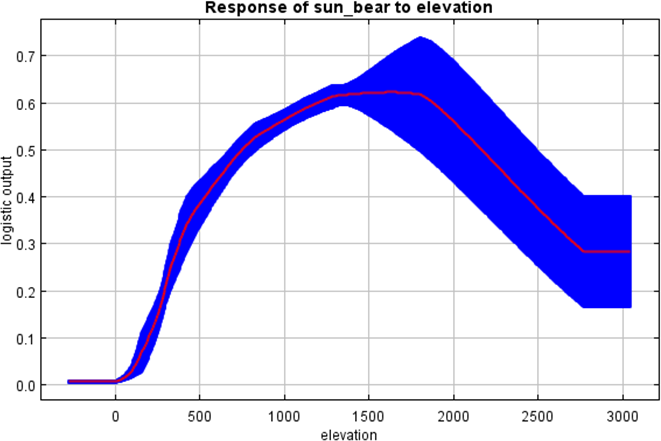
The high probability of sun bear occurrence at elevations of 1,500–2,000 m warrants critical ecological scrutiny, as H. malayanus is evolutionarily and behaviorally established as a lowland forest specialist. This altitudinal pattern strongly suggests a process of anthropogenic displacement rather than a natural habitat preference. In West Sumatra, the lowlands have experienced severe landscape fragmentation due to agricultural expansion, infrastructure development, and monoculture plantations. This intense human footprint has degraded lowland forest patches, effectively driving remaining sun bear populations into steeper, less accessible montane zones where human encroachment is topographically restricted.
While these predictive outputs offer valuable conservation baselines, several inherent model limitations must be acknowledged. First, despite utilizing spatial thinning to reduce sampling bias, field surveys were restricted by terrain accessibility, leaving remote interior pockets undersampled. Second, because independent external validation datasets were unavailable due to regional data constraints, model validation relied strictly on internal bootstrap cross-validation. Finally, the selection of the 10-percentile training presence threshold introduces slight structural uncertainties, as it intentionally excludes the lowest scoring occurrence records, potentially underestimating transitional or marginal habitats. These factors should be taken into care when translating these suitability zones into rigid regulatory boundaries.
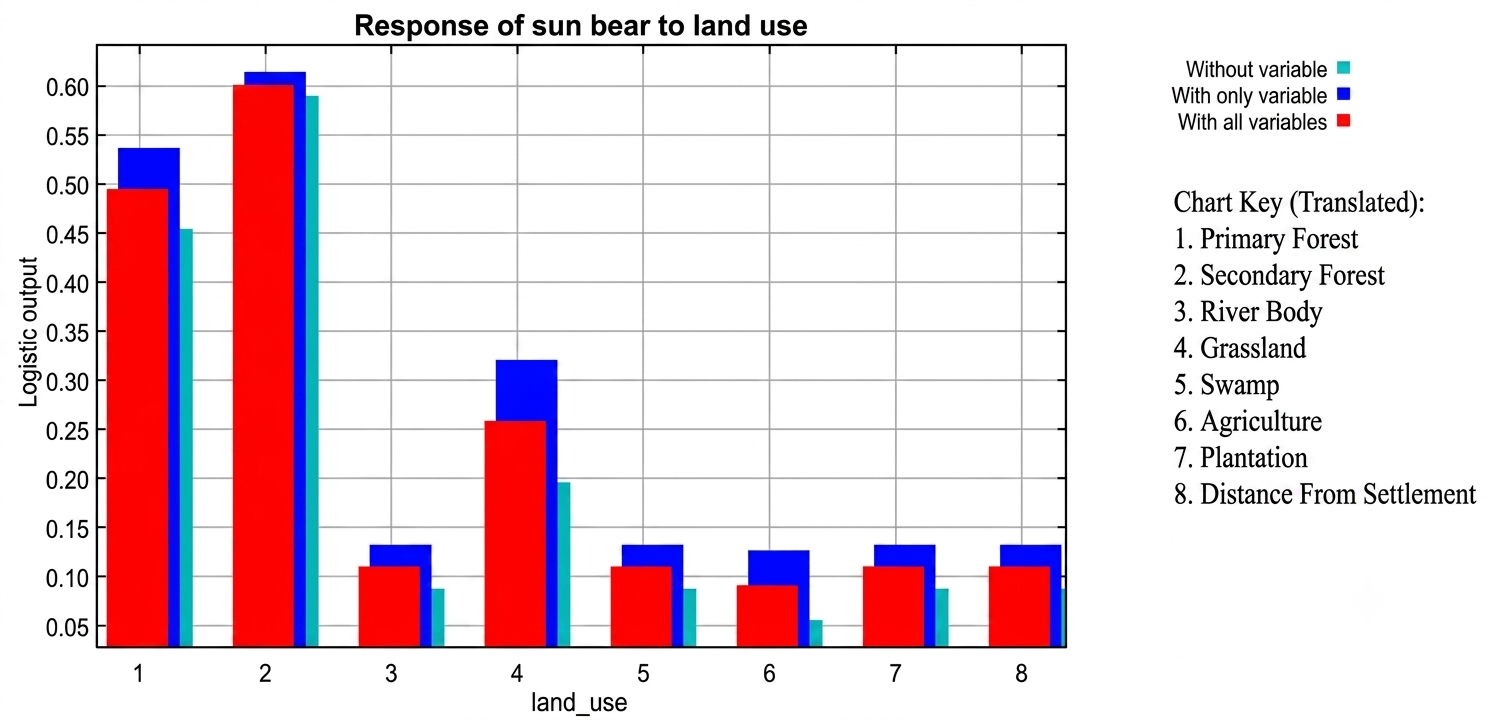
Land use also plays a significant role in determining habitat suitability, as illustrated in Figure 7. The response curves distinguish between three modeling scenarios: without variables (light blue), with a single variable (dark blue), and with all variables included (red). These curves provide insights into both the independent and combined effects of environmental variables on habitat suitability. The results indicate that primary and secondary forests exhibit the highest suitability, suggesting that these habitat types are critical for supporting sun bear populations. This preference is likely driven by the availability of diverse food resources, adequate shelter, and lower levels of disturbance, which are essential for the species’ survival and adaptability.
The response curve for precipitation (Figure 8A) shows that the probability of sun bear occurrence is highest within a rainfall range of approximately 240–260 mm per month. This finding highlights the strong association between sun bears and humid tropical environments. High rainfall promotes dense and diverse vegetation, which in turn supports abundant food resources such as fruits, honey, and other plant materials essential for sun bear foraging.
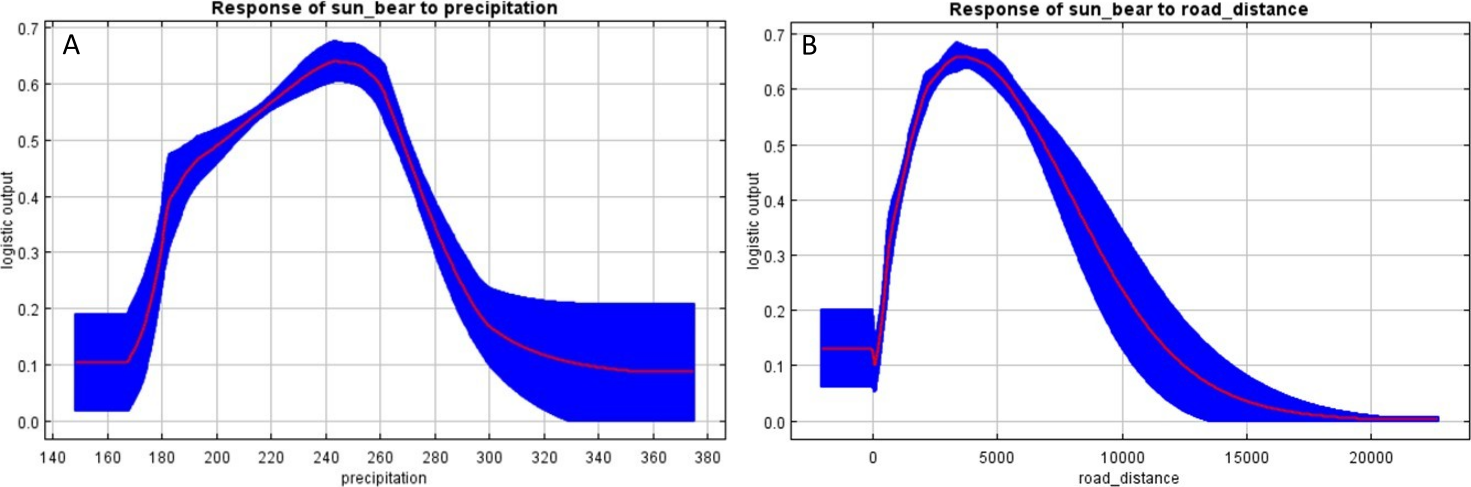
Distance from roads is another important factor influencing habitat suitability (Figure 8B). The model indicates that the probability of occurrence increases at distances of approximately 4–5 km from roads, suggesting that sun bears tend to avoid areas with high human activity. This pattern reflects the negative impact of anthropogenic disturbances, such as habitat fragmentation, noise, and increased risk of human–wildlife conflict, on species distribution. Increased distance from roads likely provides a safer and less disturbed environment, allowing for more natural movement patterns and reduced stress levels.
Overall, the response curve analysis demonstrates that H. malayanus habitat suitability in West Sumatra is strongly influenced by a combination of topographic, climatic, and anthropogenic factors. The species shows a clear preference for higher elevations, forested landscapes (particularly primary and secondary forests), high rainfall conditions, and areas distant from human disturbances. These findings are consistent with ecological expectations for forest-dependent mammals and provide important insights for conservation planning and habitat management strategies.
Contribution of Environmental Variables to Habitat Suitability
The contribution of environmental variables to the MaxEnt model was evaluated using two complementary outputs: (1) percent contribution of each variable to the predictive model, and (2) variable importance assessed through the Jackknife test. These approaches provide insights into the relative influence of each environmental factor on the predicted distribution of H. malayanus.
The percent contribution analysis (Table 3) indicates that elevation is the most influential variable, contributing 31.1% to the model, followed by land use (21.4%), precipitation (15.5%), and distance from roads (11.7%). Additional variables, including distance from settlements (6.1%), Bio 7 (annual temperature range; 5%), distance from conservation areas (2.6%), distance from rivers (2.5%), slope (1.9%), Bio 18 (precipitation of the warmest quarter; 1.4%), and NDVI (0.9%), showed comparatively lower contributions.
| Variable | Percent Contribution (%) |
|---|---|
| Elevation | 31.1 |
| Land Use | 21.4 |
| Precipitation | 15.5 |
| Distance from Roads | 11.7 |
| Distance from Settlements | 6.1 |
| Bio 7 (Annual Temperature Range) | 5.0 |
| Distance from Conservation Areas | 2.6 |
| Distance from Rivers | 2.5 |
| Slope | 1.9 |
| Bio 18 (Precipitation of Warmest Quarter) | 1.4 |
| NDVI (2019) | 0.9 |
The dominant role of elevation observed in this study is consistent with previous findings indicating that sun bears may exhibit higher habitat suitability at elevated areas (22). Field observations further support this result, as claw marks and signs of sun bear activity were recorded at elevations above 1,000 m above sea level. Globally, the elevational distribution of sun bears varies considerably. For example, in India, the species has been recorded up to 3,000 m, with higher occurrence in upland regions (23), potentially due to habitat degradation in lowland areas (24). In contrast, sun bears in western Thailand are generally associated with lowland forests below 1,200 m, although their distribution may extend to higher elevations depending on environmental conditions and human disturbance (25). Records from mainland Southeast Asia indicate that the species can occur at elevations exceeding 2,000 m in certain regions (26). In Indonesia, sun bears are typically found below 1,200 m, but have also been recorded at higher elevations in Sumatra (21, 27, 28). These patterns suggest that elevational use is context-dependent and influenced by local environmental conditions, including climate, vegetation structure, and resource availability.
Land use represents the second most important variable, indicating that H. malayanus strongly prefers primary and secondary forest habitats. This finding aligns with previous studies showing that sun bears are more frequently associated with intact forest interiors, where resource availability and habitat protection are optimal. However, as noted by Augeri (2005), sun bears may also utilize modified landscapes such as plantations or logged forests under certain conditions, reflecting their ecological adaptability.
Precipitation was identified as the third most influential variable, with optimal habitat suitability occurring within a rainfall range of approximately 240–260 mm per month. This result underscores the importance of humid tropical conditions in supporting sun bear populations. High precipitation promotes dense vegetation and fruit production, which are essential food resources for the species. In Southeast Asia, sun bears are primarily associated with tropical rainforest ecosystems characterized by high and relatively stable rainfall throughout the year, including lowland dipterocarp forests (29). In contrast, in regions such as Myanmar, Thailand, Laos, Cambodia, and Vietnam, sun bears coexist with Asiatic black bears in more seasonal environments with extended dry periods (23), indicating ecological flexibility across different climatic regimes.
Distance from roads also plays a significant role in shaping habitat suitability. The model indicates that sun bear presence is most likely at distances of approximately 4–5 km from roads, suggesting avoidance of areas with high human disturbance. This finding differs from Nazeri et al. (22), who reported increasing habitat suitability with greater distance from roads, often exceeding 10 km. The influence of roads on habitat use has been widely documented, as roads can fragment habitats, alter movement patterns, and increase the likelihood of human–wildlife conflict (30).
Similarly, distance from settlementscontributes to habitat suitability, with higher probabilities of occurrence observed at distances of approximately 5 km from human habitation. This pattern reflects the negative impacts of anthropogenic pressures, including land conversion and agricultural expansion, particularly oil palm plantations, which can force sun bears into closer proximity with human settlements (31). Consequently, the risk of human–wildlife conflict tends to increase in areas located near settlements (32).
The contribution of Bio 7 (annual temperature range) indicates that sun bear presence is associated with a temperature range of approximately 9.5 °C, slightly lower than the range of 10–12 °C reported by Nazeri et al. (22). Temperature stability plays an important role in maintaining ecosystem productivity and supporting plant species that serve as food sources (17), although fluctuations in temperature may affect both species behavior and habitat conditions (33).
Other variables, including distance from conservation areas, distance from rivers, slope, and Bio 18, showed relatively low contributions to the model. This suggests that their influence on habitat suitability in West Sumatra is less pronounced compared to primary drivers such as elevation and land use. However, these variables may still play a role in other geographic contexts or under different ecological conditions. For instance, Bio 18 represents precipitation during the warmest quarter, which may influence species distribution in more seasonal environments (34). Additionally, population density and human pressure may further influence habitat suitability and species distribution patterns (35).
NDVI exhibited the lowest contribution (0.9%), suggesting that vegetation index alone may not adequately capture habitat preferences of sun bears in this study. This may be due to the indirect relationship between NDVI values and specific ecological requirements of the species.
In addition to percent contribution analysis, the Jackknife test was used to further assess variable importance. The results of the Jackknife analysis are presented in Figure 9.
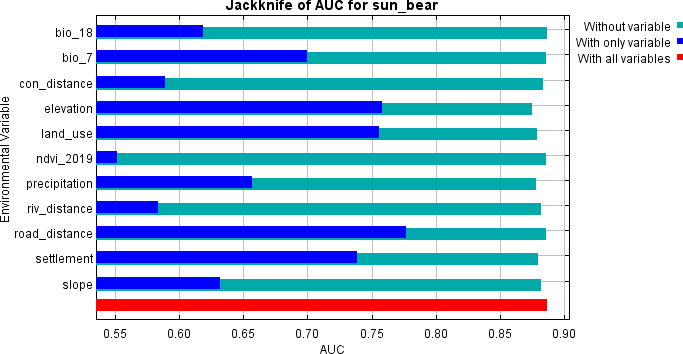
The Jackknife test reveals variation in the importance of environmental variables depending on the evaluation metric. Based on AUC values, distance from roads exhibited the highest contribution, exceeding 0.75. However, when evaluated using training gain and test gain, land use emerged as the most informative variable when used independently, indicating its strong predictive power in isolation. Conversely, the omission of elevation from the model resulted in a substantial decrease in training gain, test gain, and AUC, highlighting its critical role in model performance.
This finding is consistent with previous studies demonstrating that removing highly influential variables leads to a decline in model accuracy (36). Overall, the combined results from percent contribution and Jackknife analysis confirm that elevation, land use, precipitation, and distance from roads are the primary drivers of sun bear habitat suitability in West Sumatra.
Conclusion
This study demonstrates that sun bear (H. malayanus) habitat suitability in West Sumatra is highly heterogeneous and strongly governed by topographic, climatic, and anthropogenic pressures. While our modeling approach provides robust spatial predictions, it remains constrained by a reliance on static environmental layers and internal cross-validation datasets. To address these limitations, future research should integrate landscape connectivity analyses to identify migration corridors, implement localized population density estimations, and conduct temporal habitat assessments to track ongoing climate change and deforestation.
Beyond academic extensions, these high-resolution suitability maps offer immediate, practical utility for regional conservation. Local wildlife authorities, such as the Natural Resources Conservation Agency (BKSDA), can directly operationalize these spatial predictions to update wildlife management zoning and enforce strict protections across vulnerable montane refugia. Specifically, these maps can guide the spatial delineation of landscape corridors and optimize the allocation of seasonal anti-poaching patrols within high-risk, high-suitability zones. Ultimately, managing these land-use changes and implementing targeted human-wildlife conflict mitigation will be paramount to ensuring the long-term persistence of sun bear populations in West Sumatra.
Declarations
Conflict of Interest
The authors declare no conflict of interest.
Data Availability
Data supporting the findings of this study are available from the corresponding author upon reasonable request.
Ethics Statement
Not applicable.
Funding Information
This work received no external funding.
References
- Indonesia R of. Law No. 41 of 1999 on Forestry. Indonesia; 1999.
- Tanjung NS, Sadono D, Wibowo CT. Tingkat Partisipasi Masyarakat dalam Pengelolaan Hutan Nagari di Sumatera Barat. Jupen. 2017;13(1):14. doi: https://doi.org/10.25015/penyuluhan.v13i1.12990
- Noor M. Informasi Dinas Kehutanan Provinsi Sumatera Barat. 2018. Sekilas Hutan Sumbar. Available from: https://dishut.sumbarprov.go.id/details/pages/1#
- Hwang M, Ditmer MA, Teo S, Wong ST, Garshelis DL. Sun Bears Use 14‐Year‐Old Previously Logged Forest More Than Primary Forest in Sabah, Malaysia. Ecosphere. 2021;12(10). doi: https://doi.org/10.1002/ecs2.3769
- Guharajan R, Abrams JF, Abram NK, Lim HY, Clements GR, Deere NJ, et al. Determinants of Sun Bear Helarctos malayanus Habitat Use in Sabah, Malaysian Borneo and Its Predicted Distribution Under Future Forest Degradation and Loss. Biodivers Conserv. 2022;32(1):297-317. doi: https://doi.org/10.1007/s10531-022-02503-9
- Htike MH, Fuller TK, Naing H, Htun S, Griffin CR. Exploring Ecological and Human Influences on Sun Bear Distribution in Htamanthi Wildlife Sanctuary, Northern Myanmar. Raffles Bull Zool 72(Conservation Ecol. 2024;424–37.
- Kunde MN, Martins RF, Premier J, Fickel J, Förster DW. Population and Landscape Genetic Analysis of the Malayan Sun Bear Helarctos malayanus. Conserv Genet. 2019;21(1):123-135. doi: https://doi.org/10.1007/s10592-019-01233-w
- Scotson L, Frederick C, Officer K, Wong WM. Sun Bear (Helarctos malayanus). Cambridge University Press; 2020. doi: https://doi.org/10.1017/9781108692571.009
- Cites. CITES Appendices I, II, and III. J Minim Access Surg. 2015;4(3):85–87.
- Manurung BR. Ancaman Terhadap Beruang Madu (Helarctos malayanus Raffles, 1821). Riau University; 2020.
- Aqila P. Taksonomi Dan Persebaran Beruang Madu. Universitas Lampung; 2015.
- Phillips SJ, Anderson RP, Schapire RE. Maximum Entropy Modeling of Species Geographic Distributions. Ecological Modelling. 2006;190(3-4):231-259. doi: https://doi.org/10.1016/j.ecolmodel.2005.03.026
- Elith J, H. Graham C, P. Anderson R, Dudík M, Ferrier S, Guisan A, et al. Novel Methods Improve Prediction of Species’ Distributions from Occurrence Data. Ecography (Cop). 2006 Apr 29;29(2):129–51.
- Dormann CF, Elith J, Bacher S, Buchmann C, Carl G, Carré G, et al. Collinearity: A Review of Methods to Deal With It and a Simulation Study Evaluating Their Performance. Ecography (Cop). 2013 Jan 18;36(1):27–46.
- Feng X, Park DS, Liang Y, Pandey R, Papeş M. Collinearity in Ecological Niche Modeling: Confusions and Challenges. Ecol Evol. 2019 Sep 20;9(18):10365–76.
- Hu X, Shi Y, Song B, Hu L, Zhao Q, Pang D, et al. Habitat Distribution of Major Wildlife in the Sanjiangyuan National Park Under Climate Scenarios Based on MaxEnt Modeling. Sci Rep. 2025;15(1). doi: https://doi.org/10.1038/s41598-025-23536-4
- Tiara NDB. Strategi Komunikasi Pemasaran Agrowisata Beruang Madu DanLamin Etam Ambors (LEA) Di Kota Balikpapan Untuk Menarik Minat Pengunjung Di Era New Normal. Universitas Islam Indonesia; 2022.
- Alikodra HS. Pengelolaan Satwaliar Jilid I. Bogor: Yayasan Penerbit Fakultas Kehutanan Institut Pertanian Bogor; 2002.
- Lõhmus A, Kont R, Runnel K, Vaikre M, Remm L. Habitat Models of Focal Species Can Link Ecology and Decision-Making in Sustainable Forest Management. Forests. 2020 Jun 30;11(7):721.
- Campos BR, Latif QS, Burnett RD, Saab VA. Predictive Habitat Suitability Models for Nesting Woodpeckers Following Wildfire in the Sierra Nevada and Southern Cascades of California. Condor. 2020 Mar 10;122(1).
- Augeri DM. On the Biogeographic Ecology of the Malayan Sun Bear. University of Cambridge; 2005.
- Nazeri M, Jusoff K, Madani N, Mahmud AR, Bahman AR, Kumar L. Predictive Modeling and Mapping of Malayan Sun Bear (Helarctos malayanus) Distribution Using Maximum Entropy. PLoS ONE. 2012;7(10):e48104. doi: https://doi.org/10.1371/journal.pone.0048104
- Scotson, L., Fredriksson, G., Augeri, D., Cheah, C., Ngoprasert, D. & Wai-Ming, W. IUCN Red List of Threatened Species. 2016. doi: https://doi.org/10.2305/iucn.uk.2017-3.rlts.t9760a45033547.en
- Karanth KK, Nichols JD, Hines JE, Karanth KU, Christensen NL. Patterns and Determinants of Mammal Species Occurrence in India. J Appl Ecol. 2009 Dec 26;46(6):1189–200.
- Ngoprasert D, Steinmetz R, Reed DH, Savini T, Gale GA. Influence of Fruit on Habitat Selection of Asian Bears in a Tropical Forest. J Wildl Manage. 2011 Apr 11;75(3):588–95.
- Steinmetz R, Garshelis DL, Chutipong W, Seuaturien N. The Shared Preference Niche of Sympatric Asiatic Black Bears and Sun Bears in a Tropical Forest Mosaic. PLoS ONE. 2011;6(1):e14509. doi: https://doi.org/10.1371/journal.pone.0014509
- Wong W, Linkie M. Managing Sun Bears in a Changing Tropical Landscape. Diversity and Distributions. 2012;19(7):700-709. doi: https://doi.org/10.1111/ddi.12020
- Wong W, Leader‐Williams N, Linkie M. Quantifying Changes in Sun Bear Distribution and Their Forest Habitat in Sumatra. Animal Conservation. 2012;16(2):216-223. doi: https://doi.org/10.1111/j.1469-1795.2012.00587.x
- Wahyudi A, Saridan A. Eksplorasi Jenis-Jenis Dipterokarpa Potensial di Kalimantan Tengah. J Penelit Ekosist Dipterokarpa. 2017;3(1):23–32.
- Dwifortunata T, Prayogo H, Siahaan S. Keanekaragaman Spesies Avifauna Diurnal di Beberapa Tipe Habitat pada Areal IUPHHK-HTI PT Hutan Ketapang Industri Kabupaten Ketapang. JHL. 2020;8(1). doi: https://doi.org/10.26418/jhl.v8i1.39386
- Tiara DM. Pengaruh Arus Masuk Penduduk Terhadap Ekspansi Pemukiman di Kecamatan Banjarmasin Tengah. SNG. 2019;3:333. doi: https://doi.org/10.24895/sng.2018.3-0.973
- Abidin KZ, Lihan T, Taher TM, Nazri N, Zaini IHA, Mansor MS, et al. Predicting Potential Conflict Areas of the Malayan Sun Bear (Helarctos malayanus) in Peninsular Malaysia Using Maximum Entropy Model. Mammal Study. 2019;44(3):193. doi: https://doi.org/10.3106/ms2018-0064
- Tumanggor, Anjelina M, Paiman A, Wulan C. Aktivitas Harian Dan Pengelolaan Beruang Madu (Helarctos malayanus) Di Tempat Penyelamatan Satwa Balai Konservasi Sumber Daya Alam Jambi. Universitas Jambi; 2022.
- O’Donnel MS, Ignizio DA. Bioclimatic Predictors for Supporting Ecological Applications in the Conterminous United States [Internet]. 2012. (Data Series).
- Fadhli M, Rifardi R, Tarumun S. Pemodelan Perubahan Penggunaan Lahan di Kabupaten Kampar. JIL. 2019;13(2):162. doi: https://doi.org/10.31258/jil.13.2.p.162-178
- Elith J, Phillips SJ, Hastie T, Dudík M, Chee YE, Yates CJ. A Statistical Explanation of MaxEnt for Ecologists. Diversity and Distributions. 2010;17(1):43-57. doi: https://doi.org/10.1111/j.1472-4642.2010.00725.x