RESEARCH ARTICLE
Characterization of Gomphrena globosa L. Flower Extract and Anti-Acne of Formulated Cream Against Cutibacterium acnes
Academic Editor: Garnadi Jafar
Sciences of Pharmacy|Vol. 5, Issue 3, pp. 250-260 (2026)
CC BY 4.0-2026 Authors
Views
Downloads
Shares
Received
May 4, 2026Revised
May 19, 2026Accepted
May 25, 2026Published
Jul 4, 2026
Abstract
Cutibacterium acnes is a cause of acne. Conventional treatments often lead to side effects and bacterial resistance, necessitating natural alternatives. Globe Amaranth (Gomphrena globosa L. ) shows potential as an anti-acne agent. This study employed an in vitro experimental laboratory design to evaluate the anti-acne activity of G. globosa L. flower extract formulated cream against C. acnes using the well diffusion method. Antibacterial activity was tested using KN (base cream), KP (1% clindamycin cream), F1 (10%), F2 (15%), and F3 (20%), and the data were analyzed using SPSS statistical analysis. Results indicated that the ethanolic extract of GA flowers has an IC50 of 85.483 ppm, TPC of 60.456 ± 0.589 mg GAE/g, and TFC of 34.390 ± 0.989 mg QE/g. It exhibited antibacterial activity against C. acnes, with inhibition zone diameters of 6.693 ± 0.2 mm for the 15% formula and 7.382 ± 0.22 mm for the 20% formula. The antibacterial activity is believed to be driven by the presence of secondary metabolites, particularly phenols and flavonoids identified in the extract.
Introduction
Acne is the most commonly encountered skin infection. The most frequent trigger for acne is the proliferation of the bacterium Cutibacterium acnes. This bacterium triggers comedogenesis by activating the sebaceous glands through increased lipogenesis in the sebum, while simultaneously stimulating innate immune mechanisms (1). In 2024, the global prevalence of acne was 20.5%. The highest % was found in the adolescent group (aged 16 to 24 years), reaching 28.3%, and remained significantly high in the adult group (aged 25 to 39 years) at 19.3% (2).
Recommended acne treatments include topical medications such as retinoids, benzoyl peroxide, and antibiotics (3). However, side effects from retinoid use, such as dry skin and peeling, occur frequently. Furthermore, these drugs fall under categories C and X, making them necessary to avoid during pregnancy (4). The side effects of benzoyl peroxide include allergic contact dermatitis, dryness, erythema, and burning sensations (5). Erythromycin is the most commonly used antibacterial in acne treatment due to its ability to reduce C. acnes colonization in the pilosebaceous follicles. Nevertheless, research has shown that approximately 60% of C. acnes strains have developed resistance to erythromycin, a condition that can lead to therapeutic failure (6).
These conditions have driven the need to search for safer alternative treatments with minimal risks, such as traditional medicine. Traditional medicines, including plant-based remedies, consist of substances or combinations of materials that have been used for generations for healing and continue to be practiced in accordance with societal norms (7). With advancements in pharmaceutical science, traditional medicine can be developed into modern dosage forms, such as topical cream preparations. Topical cream formulations may improve the practicality of application and facilitate the distribution of bioactive compounds on the skin surface. Cream formulations are generally well accepted by patients because they are easy to apply, non-greasy, and suitable for prolonged use. Plants containing secondary metabolites including flavonoids, tannins, and antioxidant compounds are known to possess pharmacological activity as anti-acne agents due to their roles in inhibiting bacterial growth, reducing inflammation, and suppressing sebum production. Traditional medicinal plants contain various secondary metabolites, including flavonoids, tannins, and phenolic compounds, which have been reported to exhibit antibacterial, anti-inflammatory, and antioxidant activities that may support anti-acne treatment (8, 9). Among the potential Indonesian plants containing these compounds is the GA (Gomphrena globosa L.).
GA, or more commonly known in Bali as the Ratna flower, is widely found and cultivated by local farmers, ensuring its abundant availability. GA extract demonstrates effective antibacterial inhibition against C. acnes, particularly at a 75% concentration, which yielded a moderate inhibition zone of 11 mm (10). Furthermore, anti-acne activity testing of a GA ointment formulation against Staphylococcus aureus showed that a 9% concentration produced an inhibition zone diameter of 11.4 ± 0.52 mm, also categorized as moderate (11). Research concerning GA extract generally focuses on its pharmacological activities, specifically as an antioxidant or antibacterial agent. However, there are limited studies developing this extract into topical dosage forms. Therefore, this study aimed to develop a topical anti-acne cream containing GA flower extract and evaluate its antibacterial activity against C. acnes in vitro.
Experimental Section
Materials
The GA (Gomphrena globosa L.) used in this study consisted of fresh flowers with the petals still attached to the flower heads, characterized by a bright purple color. The samples were obtained from local farmers in Sanur Kaja Village, Bali Province. The identification was conducted at the Mathematics and Natural Sciences, Laboratory Unit, IAIN Syekh Nurjati Cirebon, under certificate number 24/In.08/LB.1.1/PP.009/02/2026.
Preparation and Extraction
The flower petals were separated from the flower heads and washed under running water. They were then dried using a dehydrator at a temperature of 40 °C until completely dry. Subsequently, the moisture content was measured using a moisture analyzer. The dried plant material was weighed and placed into a maceration vessel. Ethanol 96% was added as a solvent at a ratio of 1:20 (12, 13). The maceration process was conducted for 3 × 24 h, with periodic stirring every 24 h. After the first maceration stage was completed, the mixture was filtered using filter paper. The remaining residue was remacerated using ethanol 96%. The filtrate from the s maceration was then combined with the first filtrate and evaporated in an oven at 50 °C. This process produced a thick extract of GA. To calculate the extraction efficiency, the yield % was determined using the Equation 1 (14).
Phytochemical screening
Flavonoids
A 1 mL aliquot of the extract solution was transferred into a test tube, followed by the addition of three drops of concentrated hydrochloric acid (HCl) and 0.5 g of magnesium ribbon/turnings. The mixture was observed for any color changes, where the appearance of an orange coloration indicated the presence of flavonoids (15).
Tannins
Approximately 0.5 g of the extract was dissolved and boiled in 20 mL of distilled water within a test tube. After boiling, the mixture was filtered, and a few drops of iron (III) chloride (FeCl3) solution were added to the filtrate. The formation of a distinctive blue-black color was recorded as a positive result for the presence of tannins (11).
Saponins
The presence of saponins was determined by placing 0.5 g of the extract into a test tube and adding an appropriate volume of hot distilled water. The mixture was then shaken vigorously. The formation of a persistent foam layer that remained stable for more than 10 min indicated a positive result for saponins (11).
Terpenoids
A total of 2 g of the extract was subjected to the Liebermann-Burchard test. The extract was treated with the Liebermann-Burchard reagent, and the formation of a reddish-brown or purple ring at the interface was used to confirm the presence of terpenoids (15).
Determination of Total Flavonoid Content
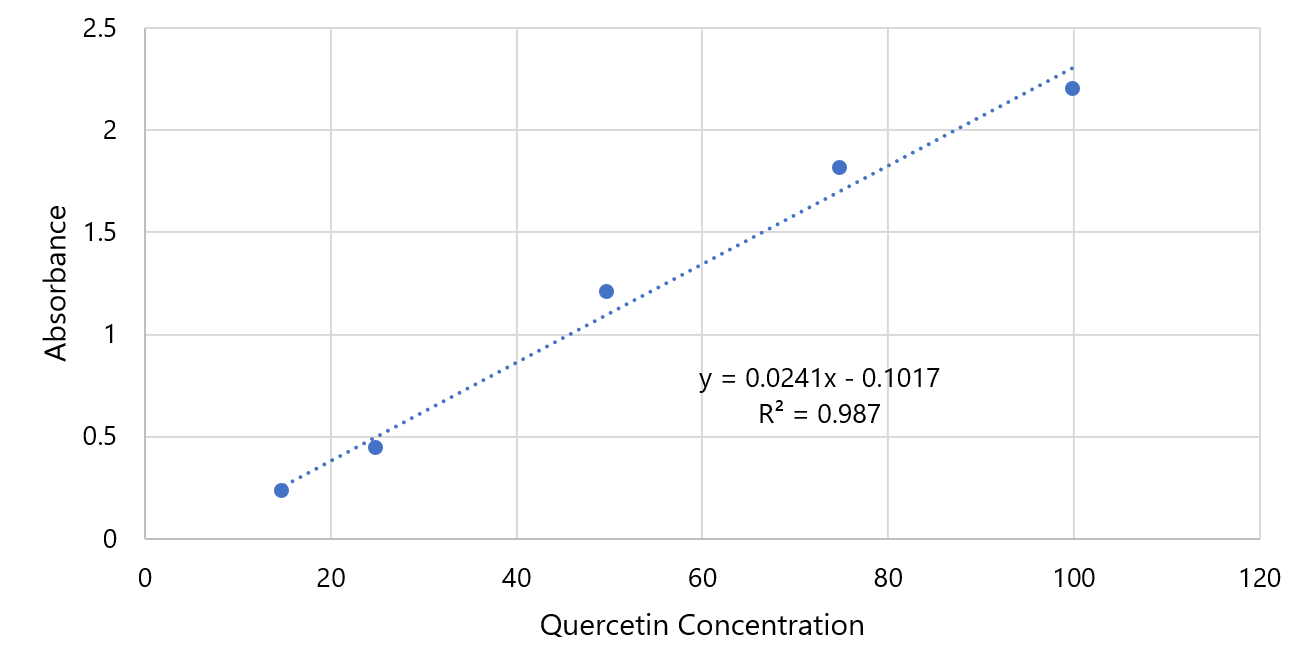
A quercetin stock solution (1000 ppm) was prepared by dissolving 10 mg of quercetin in 10 mL of 96% ethanol. This solution was diluted to 100 ppm, from which a series of working standards (15, 25, 50, 75, and 100 ppm) were prepared using 96% ethanol. For color development, 1 mL of the 100 ppm standard was mixed with 1 mL of 10% AlCl3 and 1 mL of 5% acetic acid. After 30 min of incubation, the λmax was determined. The absorbance of the serial working standards was then measured at this λmax to construct the calibration curve. The GA extract was dissolved in 96% ethanol to obtain a 100 ppm test solution. 1 mL of this solution was reacted with 1 mL of 10% AlCl3 and 1 mL of 5% acetic acid, then incubated for 30 min. The absorbance was measured at λmax in triplicate. The TFC was calculated and expressed as mg of quercetin equivalent per g of extract (mg QE/g) (16). The absorbance values were recorded, and the TFC was calculated using Equation 2 (17), where TFC = total flavonoid content, C = quercetin concentration obtained from the calibration curve (mg/L), V = total volume of the extract solution (L), DF = dilution factor, and m = weight of the extract used (g).
Determination of Total Phenolic Content
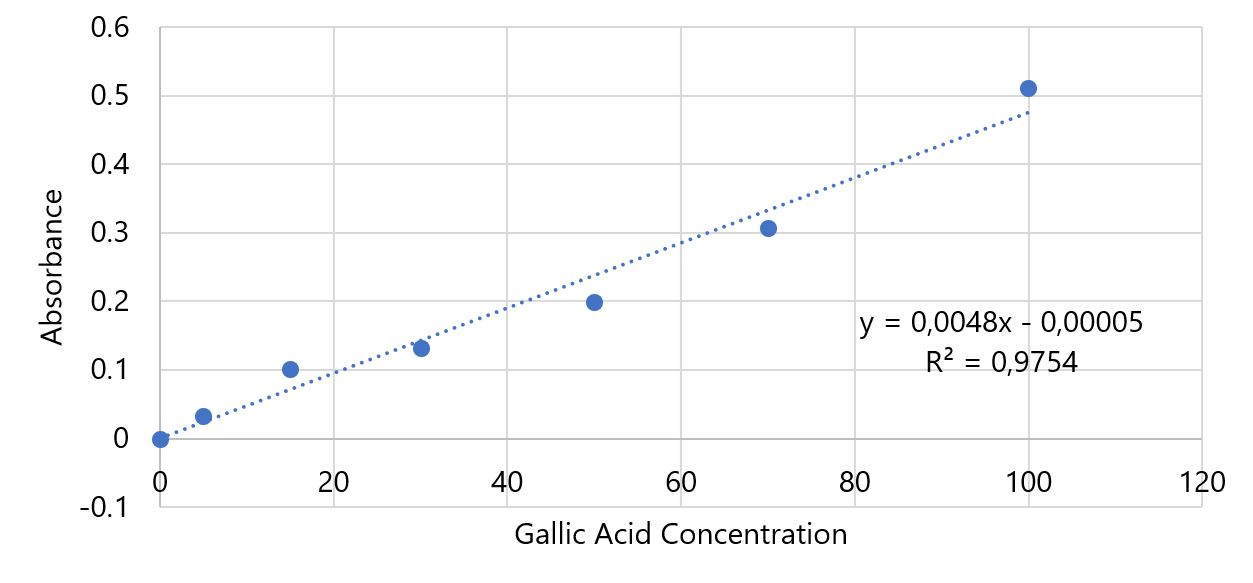
A 7.5% Folin-Ciocalteu reagent and a 1% NaOH solution were prepared using distilled water. Gallic acid was used as the reference standard, with a stock solution of 400 ppm (10 mg in 25 mL methanol) subsequently diluted to a series of working standards (5, 15, 30, 50, 70, and 100 ppm). To determine the λmax, 1 mL of the 70 ppm gallic acid standard was reacted with 5 mL of 7.5% Folin-Ciocalteu reagent for 8 min, followed by the addition of 4 mL of 1% NaOH. After a 1 h incubation, the absorbance was scanned around 730 nm. The same procedure was applied to all working standards to construct the calibration curve. The extract (0.2 g) was dissolved in 20 mL of methanol and stirred magnetically for 30 min to obtain a 1000 ppm solution. This solution was then diluted to 100 ppm. 1 mL of the sample was reacted with the Folin-Ciocalteu reagent and NaOH using the same incubation parameters as the standards. The absorbance was measured at λmax, in triplicate. The total phenolic content was expressed as mg of gallic acid equivalent per g of extract (mg GAE/g). The absorbance values were recorded, and the TPC was calculated using Equation 3 (18), where TPC = total phenolic content, C = gallic acid concentration obtained from the calibration curve (mg/L), V = total volume of the extract solution (L), DF = dilution factor, and m = weight of the extract used (g).
Antioxidant Activity Assay
The antioxidant activity of GA extract was evaluated using the DPPH (2, 2-diphenyl-1-picrylhydrazyl) radical scavenging assay. A stock extract solution (1000 ppm) was prepared in 96% ethanol and subsequently diluted to a 100 ppm working solution. A series of test concentrations (10, 15, 20, 25, 30, 35, 40, 45, 50, and 55 ppm) were then prepared. For the radical solution, a 100 ppm DPPH stock was prepared and diluted to a 40 ppm working solution. The λmax was determined by scanning the 40 ppm DPPH solution within the range of 400–800 nm, using 96% ethanol as the blank. To measure the control absorbance, 2 mL of 40 ppm DPPH was mixed with 2 mL of 96% ethanol, vortexed, and incubated for 30 min before measuring its absorbance at λmax. For the antioxidant test, 2 mL of the 40 ppm DPPH solution was mixed with 2 mL of each extract concentration. The mixtures were vortexed and incubated in the dark for 30 min. The absorbance was then measured using a UV-Vis spectrophotometer at the determined λmax. The % of inhibition was determined using Equation 4 (19). The IC50 value was determined through linear regression analysis IC50, where the sample concentration was plotted on the x-axis and the % of inhibition on the y-axis. A lower IC50 value indicates stronger antioxidant activity (13).
Cream Formulation and Physical Quality Evaluation
The cream formulations are detailed in Table 1. The preparation followed a standard fusion method. The oil phase (stearic acid, cetyl alcohol, and propylparaben) and the aqueous phase (triethanolamine, glycerin, methylparaben, propylene glycol, and distilled water) were heated separately to 70°C until fully melted. The aqueous phase was then gradually added to the oil phase under continuous stirring to ensure a uniform emulsion. Separately, the ethanolic extract of GA was diluted with 96% ethanol and homogenized in a pre-heated mortar to prevent clumping. The cream base was incorporated incrementally into the extract while being stirred constantly until a homogeneous preparation was achieved. The final cream was then transferred into appropriate containers for further evaluation (20).
| Ingredients | Concentration (%) | Function | ||
|---|---|---|---|---|
| F1 | F2 | F3 | ||
| GA Extract (Gomphrena globosa L. ) | 10 | 15 | 20 | Active ingredient |
| TEA (Triethanolamine) | 2 | 2 | 2 | Emulsifying agent, alkalizing agent |
| Stearic acid | 8 | 8 | 8 | Creamy base, emulsifying agent |
| Propylene glycol | 7 | 7 | 7 | Humectant |
| Cetyl alcohol | 4 | 4 | 4 | Emulsifying agent, stiffening agent |
| Glycerine | 4 | 4 | 4 | Humectant |
| Methylparaben | 0.2 | 0.2 | 0.2 | Preservative |
| Propylparaben | 0.02 | 0.02 | 0.02 | Preservative |
| Ethanol 96% | qs. | qs. | qs. | Extract solvent |
| Aquadest | 10 | 10 | 10 | Vehicle |
Organoleptic Test
The evaluation was systematically conducted through a rigorous visual and sensory assessment of the GA extract cream, specifically focusing on key organoleptic parameters such as color and aroma. The final observation results indicated that each prepared formulation demonstrated excellent physical and chemical stability, with no significant changes in color or aroma throughout the entire 21-day storage period (21).
Homogeneity Test
Performed by applying 1 g of the cream onto a glass plate. The formulation is considered homogeneous if it shows no visible signs of clumping particles or unmixed components. This test was conducted on days 0, 7, 14, and 21 of the storage period (21).
pH Measurement
Determined by diluting 1 g of the cream with 10 mL of distilled water in a beaker. The probe of a digital pH meter was then immersed into the diluted mixture, and the stabilized value displayed on the monitor was recorded. The evaluation was conducted on days 0, 7, 14, and 21 of the study (21).
Spreadability Test
Conducted by placing 0.5 g of the cream formulation onto the center of a transparent glass plate or watch glass layered with graph paper. A s glass plate was placed on top and allowed to stand for 60 s. Subsequently, weights of 50 g, 100 g, and 150 g were added sequentially, with each load applied for 60 s. The spreadability was determined by measuring the average diameter or the area of distribution after each weight addition. The evaluation was conducted on days 0, 7, 14, and 21 of the study (21).
Antibacterial Activity Assay
The antibacterial inhibition zone of the GA extract cream was evaluated using the well diffusion method. A 0, 2 mL bacterial suspension of C. acnes was inoculated into a petri dish containing 20 mL of sterile, molten Mueller Hinton Agar (MHA) that had not yet solidified. The dish was swirled gently to ensure a homogeneous mixture of the bacteria and the medium before being allowed to solidify. Subsequently, three wells were created in the agar with equidistant spacing. Each well was filled with 50 µL of the respective samples: the extract creams at concentrations of 10%, 15%, and 20%, clindamycin cream 1% as the positive control, and cream base as the negative control. The plates were then incubated at 37°C for 24 h under anaerobic conditions. The antibacterial activity was determined by measuring the diameter of the clear inhibition zones formed around each well (22).
Data Analysis
The physical quality parameters of the cream were analyzed descriptively and presented in narrative and tabular formats. For the antibacterial activity, statistical analysis was performed using SPSS software. Data normality was assessed using the Shapiro-Wilk test, with a significance level set at p > 0, 05. Since the data were not normally distributed, the Kruskal-Wallis test was employed to determine significant differences in inhibition zones across formulas, followed by the Mann-Whitney test for post-hoc pairwise comparisons.
Results and Discussion
Extraction
A total of 1.977 g of GA petals were obtained for drying using a dehydrator at 40 °C until a dried plant material was formed. Drying at 40 °C effectively preserves phytochemicals while significantly reducing drying time compared to shade dryingfter drying (23). A 177.57 g of dried plant material was obtained. The moisture content was measured using a moisture analyzer, yielding a value of 8.05%. Other studies have shown that GA flowers possess a moisture content of 8.17%, indicating that these research results are relatively comparable and fall within the appropriate range (12). Since the GA dried plant material already possessed a small size and soft texture, further size reduction was not performed. The influence of particle size on extract yield shows no significant difference between coarse and fine powders (24). In this study, a ratio of 1:20 was employed, meaning each 1 g of material was extracted with 20 mL of solvent (12, 13). This process produced 32.02 g of viscous extract, with a yield % of 18.03%. The yield value indicates the quantity of compounds successfully transferred from the plant material into the solvent; therefore, a higher yield signifies that a greater amount of chemical components has been dissolved and extracted (23)
Phytochemical screening
The phytochemical screening results indicated that the ethanolic extract of GA tested positive for all groups of secondary metabolites evaluated (see Table 2). Other studies utilizing the same extraction method also reported the presence of these identical secondary metabolites (12). This consistency supports the finding that GA contains secondary metabolites with potential antibacterial properties.
| Phytochemical | Observation | Result |
|---|---|---|
| Flavonoid | Orange colour | Presence |
| Tannins | Blue-black colour | Presence |
| Saponin | Foaming more than 1 min | Presence |
| Terpenoid | Brown ring at the junction of two layers and the upper layer turns green | Presence |
Determination of Total Flavonoid Content
The determination of TFC was conducted using the colorimetric method, where in the sample was reacted with AlCl3 under acidic conditions. AlCl3 forms a complex with flavonoids, such as quercetin, causing the solution to turn yellow and allowing it to be measured within the visible light spectrum. The addition of acetic acid serves to maintain acidic conditions, ensuring the stability of the color formation. Quercetin was utilized as the standard because it belongs to the flavonoid class (25). The determination of the λmax yielded a result of 415 nm with an absorbance value of 2.199 (see Figure 1). In this study, the results of the TFC were 20.144 ± 0.096 mgQE/g (see Table 3). This indicates that each 1 g of extract or sample contains flavonoids equivalent to 20.144 mg of Quercetin Equivalent.
| Sample (100 ppm) | Sample Absorbance | x concentration (mg/L) | TFC (mgQE/g) | TFC ± SD |
|---|---|---|---|---|
| 1 | 0.019 | 5.008 | 20.033 | 20.144 ± 0.096 |
| 2 | 0.02 | 5.05 | 20.199 | |
| 3 | 0.02 | 5.05 | 20.199 |
Determination of Total Phenolic Content
The TPC was determined using the Folin-Ciocalteu method, which relies on the reduction of phosphomolybdic-phosphotungstic reagents by phenolic compounds in an alkaline environment to form a blue-colored complex. The intensity of this color, measured spectrophotometrically, is directly proportional to the concentration of phenolics present (26, 27). Gallic acid served as the standard reference. The λmax for gallic acid was found to be 756.5 nm with an absorbance of 0.349 (see Figure 2). The analysis revealed a TPC of 60.32 ± 0.48 mgGAE/g as seen in Table 4, indicating that each g of extract contains phenolic compounds equivalent to 60.32 mg of Gallic Acid Equivalent (GAE).
| Sample (100 ppm) | Sample Absorbance | x concentration (mg/L) | TPC (mgGAE/g) | TPC ± SD |
|---|---|---|---|---|
| 1 | 0.072 | 15.010 | 60.042 | 60.32 ± 0.48 |
| 2 | 0.073 | 15.219 | 60.875 | |
| 3 | 0.072 | 15.010 | 60.042 |
Antioxidant Activity Assay
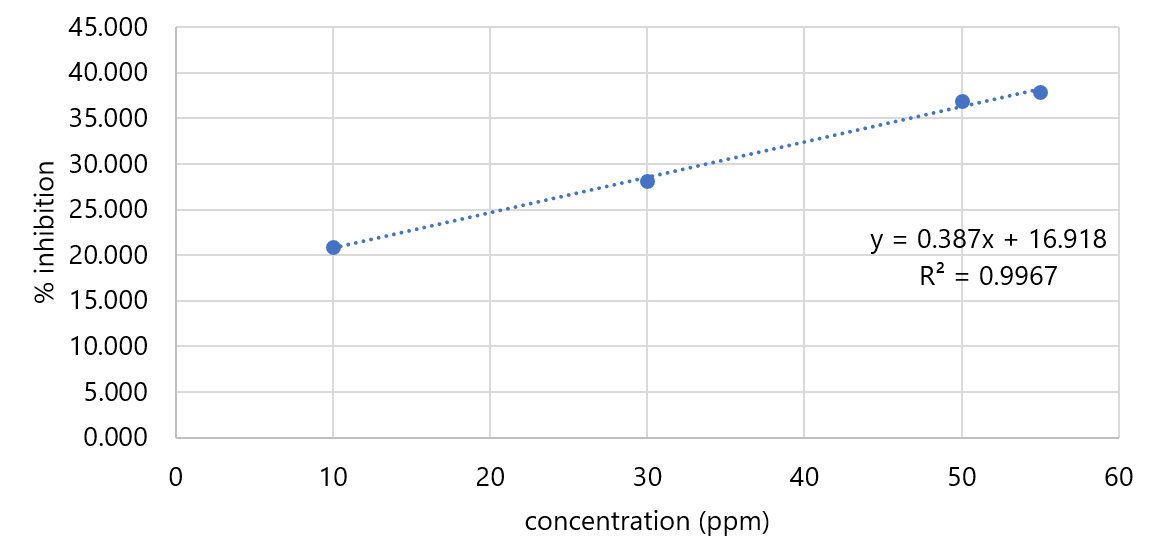
This antioxidant activity is presumed to stem from secondary metabolite contents, such as flavonoids, which exert antioxidant effects by donating hydrogen atoms and scavenging free radicals (28). The λmax for the 40 ppm DPPH solution, measured within the 400–800 nm range, was determined to be 517 nm with an absorbance value of 0.769 (see Table 5). Subsequently, the DPPH absorbance at the 517 nm wavelength was recorded at 0.398. The IC50 value of the GA ethanolic extract was derived from the linear regression equation of concentration versus % inhibition (see Figure 3). The calculation for the IC50 value is presented below. With an IC50 value of 85.483 ppm, the ethanolic extract of globe amaranth flower exhibited antioxidant activity. Differences in IC50 values compared to previous studies, which reported values ranging from 49.9 ppm to 62.50 μg/mL, may be influenced by variations in extraction methods and experimental condition (13, 29). This further validates the species as a significant natural antioxidant resource.
| Concentration (ppm) | Absorbance | Average Absorbance | Standard Deviation | % Inhibition | ||
|---|---|---|---|---|---|---|
| 1 | 2 | 3 | ||||
| 10 | 0.315 | 0.314 | 0.315 | 0.315 | 0.001 | 20.938 |
| 30 | 0.286 | 0.285 | 0.287 | 0.286 | 0.001 | 28.141 |
| 50 | 0.251 | 0.252 | 0.251 | 0.251 | 0.001 | 36.851 |
| 55 | 0.247 | 0.249 | 0.246 | 0.247 | 0.002 | 37.856 |
Cream Formulation and Physical Quality Evaluation
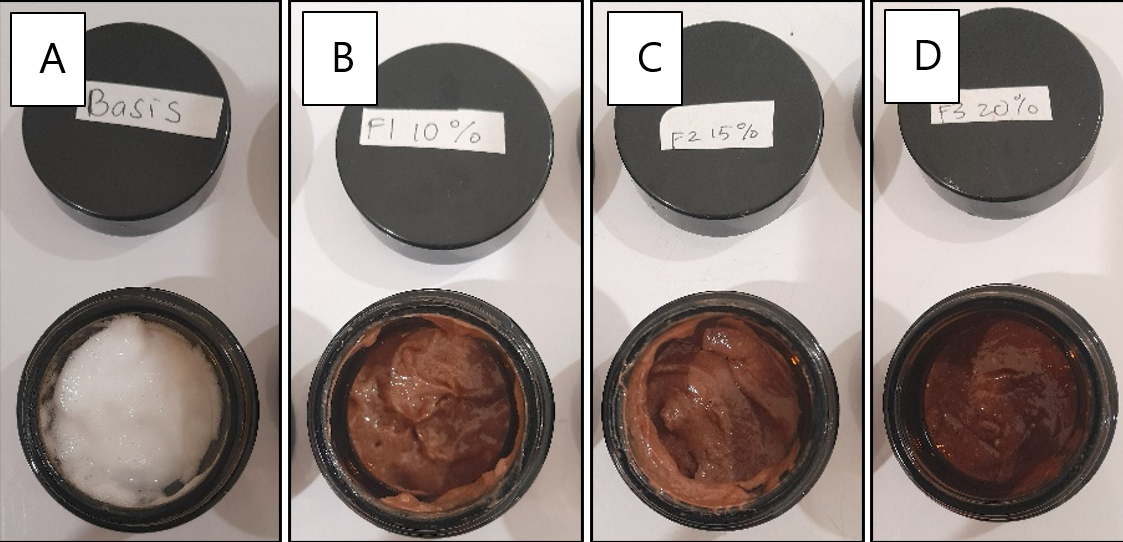
All physical quality parameters complied with the required standards. The pH values were within the SNI 16-4399: 1996 range of 4.5–8.0, and the spreadability values fell within the ideal range of 5-7 cm (30). Physical quality parameter of the GA extract cream can be seen in Table 6 and the visual image can be seen in Figure 4.
| Characteristics | Formulation | Results on Day - | Information | |||
|---|---|---|---|---|---|---|
| 0 | 7 | 14 | 21 | |||
| Texture | F1 | Semisolid | Semisolid | Semisolid | Semisolid | qualify |
| F2 | Semisolid | Semisolid | Semisolid | Semisolid | ||
| F3 | Semisolid | Semisolid | Semisolid | Semisolid | ||
| Color | F1 | light brown | light brown | light brown | light brown | qualify |
| F2 | brown | brown | brown | brown | ||
| F3 | dark brown | dark brown | dark brown | dark brown | ||
| Aroma | F1 | like extract | like extract | like extract | like extract | qualify |
| F2 | like extract | like extract | like extract | like extract | ||
| F3 | like extract | like extract | like extract | like extract | ||
| Homogeneity | F1 | homogeneous | homogeneous | homogeneous | homogeneous | qualify |
| F2 | homogeneous | homogeneous | homogeneous | homogeneous | ||
| F3 | homogeneous | homogeneous | homogeneous | homogeneous | ||
| pH | F1 | 6.55 | 6.59 | 6.60 | 6.63 | SD = 0.033 |
| F2 | 6.31 | 6.32 | 6.34 | 6.38 | SD = 0.031 | |
| F3 | 6.12 | 6.16 | 6.20 | 6.27 | SD = 0.064 | |
| Spreadability (cm) | F1 | 5.5 | 5.6 | 5.5 | 5.5 | SD = 0.050 |
| F2 | 5.7 | 5.6 | 5.5 | 5.5 | SD = 0.096 | |
| F3 | 5.8 | 5.7 | 5.7 | 5.6 | SD = 0.082 | |
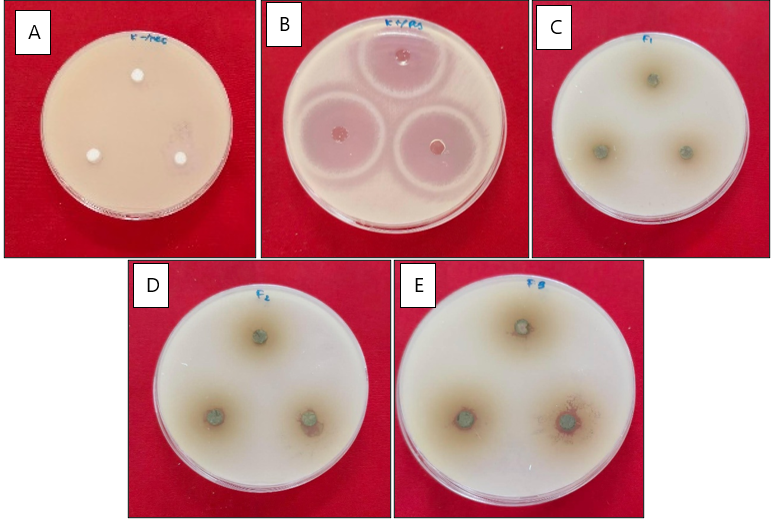
Antibacterial Activity Assay
The antibacterial assay revealed that the negative control (base cream) and Formula 1 (10% concentration) exhibited no inhibitory activity (see Table 7). However, Formula 2 and Formula 3 produced inhibition zones, with Formula 3 showing the highest inhibition zone diameter of 7.815 mm (see Figure 5). This concentration dependent response suggests that higher extract concentrations may enhance antibacterial activity, although the inhibition remained lower than the positive control (1% clindamycin cream). The potent bioactivity of the GA extract is supported by its significant antioxidant capacity (IC50 = 85.483 ppm) and high phenolic and flavonoid content (60.32 mg GAE/g and 20.144 mg QE/g, respectively). These compounds play a crucial role in anti-acne mechanisms; antioxidants suppress inflammatory cytokines and sebum production (9), while phenols and flavonoids disrupt C. acnes cell membranes and inhibit vital bacterial enzymes (31). Furthermore, the presence of tannins, saponins, and terpenoids contributes to bacterial growth suppression through lipase inhibition and increased membrane permeability, leading to cell lysis (8, 32).
| Sample | Average (mm) ± SD | Category |
|---|---|---|
| K- | 0 ± 0 | No inhibition |
| 0 ± 0 | No inhibition | |
| 0 ± 0 | No inhibition | |
| K+ | 27.9 ± 1.27 | Very strong |
| 28.8 ± 0.25 | Very strong | |
| 28.0 ± 0.30 | Very strong | |
| F1 | 0 ± 0 | No inhibition |
| 0 ± 0 | No inhibition | |
| 0 ± 0 | No inhibition | |
| F2 | 6.69 + 0.33 | Moderate |
| 7.10 ± 0.25 | Moderate | |
| 6.62 ± 0.02 | Moderate | |
| F3 | 6.93 ± 0.14 | Moderate |
| 8.01 ± 0.29 | Moderate | |
| 7.25 ± 0.24 | Moderate |
The antibacterial assay revealed that the negative control (base cream)
and Formula 1 (10% concentration) exhibited no inhibitory activity. However,
Formula 2 and Formula 3 produced inhibition zones, with Formula 3 showing the
highest inhibition zone diameter of 7.815 mm. This concentration dependent response suggests that higher extract concentrations may
enhance antibacterial activity, although the inhibition remained lower than the
positive control (1% clindamycin cream). The potent bioactivity of the GA extract is supported by its
significant antioxidant capacity (IC50 = 85.483 ppm) and high
phenolic and flavonoid content (60.456 mg GAE/g and 34.390 mg QE/g,
respectively). These compounds play a crucial role in anti-acne mechanisms;
antioxidants suppress inflammatory cytokines and sebum production, while
phenols and flavonoids disrupt C. acnes cell membranes and inhibit vital
bacterial enzymes. Furthermore, the presence of tannins, saponins, and
terpenoids contributes to bacterial growth suppression through lipase
inhibition and increased membrane permeability, leading to cell lysis.
Data Analysis
Statistical analysis using the Kruskal-Wallis test showed a significant effect of formula variation on inhibition zone diameters (p = 0.008). To determine the specific differences between groups, a Mann-Whitney U test was performed, as shown in the Table 8.
| Category | Significance (p) | Result | Information |
|---|---|---|---|
| K+ and F1 | 0.037 | < 0.05 | Significantly different |
| K+ and F2 | 0.050 | ≥ 0.05 | Not significantly different |
| K+ and F3 | 0.050 | ≥ 0.05 | Not significantly different |
F1 differed significantly from K+, whereas F2 and F3 maintained no significant difference with the positive control. Comparatively, our 15% and 20% cream formulations demonstrated inhibitory effects equivalent to the 25% raw extract reported by Veronica et al. (2020). This suggests that the cream base may enhance the delivery and activity of the bioactive compounds, potentially allowing lower concentrations to produce comparable effects. Therefore, the cream formulation may offer practical advantages in topical application compared to unformulated extracts.
Conclusion
In conclusion, the ethanolic extract of globe amaranth (Gomphrena globosa L. ) contains essential secondary metabolites, including flavonoids, tannins, saponins, and terpenoids. Quantitative analysis revealed a total flavonoid content of 20.144 ± 0.096 mg QE/g and a total phenolic content of 60.32 ± 0.48 mg GAE/g, which contribute to its strong antioxidant activity IC50 = 85.483 ppm. Furthermore, antibacterial assays against Cutibacterium acnes demonstrated that while the 10% cream formulation lacked inhibitory effects, the 15% and 20% concentrations exhibited moderate antibacterial activity with mean inhibition zones of 6.693 mm and 7.382 mm, respectively. These findings suggest that the formulated cream has significant potential as a natural anti-acne agent.
Abbreviations
C. acnes = Cutibacterium acnes; GA = Globe Amaranth; TFC = Total Flavonoid Content; TPC = Total Phenolic Content; SD = Standard Deviation; λmax = maximum Absorption Wavelength.
Declarations
Conflict of Interest
The author(s) declare no conflict of interest.
Data Availability
All data generated or analyzed during this study are included in this published article.
Ethics Statement
Not applicable.
Funding Information
This work received no external funding.
References
- Mawardi P, Ardiani I, Primisawitri PP, Nareswari A. Dual role of Cutibacterium acnes in acne vulgaris pathophysiology. Bali Med J. 2021;10(2):486-490. doi: https://doi.org/10.15562/bmj.v10i2.2358
- Saurat JH, Halioua B, Baissac C, Cullell NP, Ben Hayoun Y, Aroman MS, et al. Epidemiology of acne and rosacea: A worldwide global study. Journal of the American Academy of Dermatology. 2024;90(5):1016-1018. doi: https://doi.org/10.1016/j.jaad.2023.12.038
- Reynolds RV, Yeung H, Cheng CE, Cook-Bolden F, Desai SR, Druby KM, et al. Guidelines of care for the management of acne vulgaris. Journal of the American Academy of Dermatology. 2024;90(5):1006.e1-1006.e30. doi: https://doi.org/10.1016/j.jaad.2023.12.017
- Leung AK, Barankin B, Lam JM, Leong KF, Hon KL. Dermatology: how to manage acne vulgaris. Dic. 2021;10:1-18. doi: https://doi.org/10.7573/dic.2021-8-6
- Geng R, Sibbald RG. Acne Vulgaris: Clinical Aspects and Treatments. Adv Skin Wound Care. 2024;37(2):67-75. doi: https://doi.org/10.1097/asw.0000000000000089
- Vasam M, Korutla S, Bohara RA. Acne vulgaris: A review of the pathophysiology, treatment, and recent nanotechnology based advances. Biochemistry and Biophysics Reports. 2023;36:101578. doi: https://doi.org/10.1016/j.bbrep.2023.101578
- Marisca Evalina Gondokesumo, Nabbilah Amir. Peran Pengawasan Pemerintah Dan Badan Pengawas Obat Dan Makanan (BPOM) Dalam Peredaran Obat Palsu di Negara Indonesia (Ditinjau dari Undang-Undang Nomor 36 Tahun 2009 dan Peraturan Kepala Badan Pengurus Obat dan Makanan). Ph. 2021;:91-107. doi: https://doi.org/10.30649/ph.v21i2.16
- Koch W, Zagórska J, Michalak-Tomczyk M, Karav S, Wawruszak A. Plant Phenolics in the Prevention and Therapy of Acne: A Comprehensive Review. Molecules. 2024;29(17):4234. doi: https://doi.org/10.3390/molecules29174234
- Kwack MH, Ha DL, Lee WJ. Preventative effects of antioxidants on changes in sebocytes, outer root sheath cells, and Cutibacterium acnes -pretreated mice by particulate matter: No significant difference among antioxidants. Int J Immunopathol Pharmacol. 2022;36. doi: https://doi.org/10.1177/03946320221112433
- Veronica E, Suyantari SAA, Swari WD, Purwaningrum NMA, Satyarsa ABS, Jawi IM, et al. Effectiveness of antibacterial extract of kenop (gomphrena globosa) flower extract against growth of propionibacterium acnes bacteria. Indo J. HeSci. 2020;4(2):115. doi: https://doi.org/10.24269/ijhs.v4i2.2620
- Suleman AW. Formulasi dan Uji Aktivitas Sediaan Salep Antijerawat Ekstrak Etanol Bunga Kenop (Gomphrena globosa) terhadap Staphylococcus aureus. Inpharnmed. 2024;7(2):135. doi: https://doi.org/10.21927/inpharnmed.v7i2.3277
- Kusmiati K, Priadi D, Rahayu RKR. Antibacterial Activity Test, Evaluation of Pharmacognosy and Phytochemical Screening of Some Extracts of Globe Amaranth (Gomphrena globosa). J. Pure App. Chem. Res. 2017;6(1):27-33. doi: https://doi.org/10.21776/ub.jpacr.2017.006.01.288
- Susilaningrum DF, Wijayanti N. Antioxidant potential and cytotoxic assay of ethanol extract of Gomphrena globosa L. flower. AIP Conference Proceedings. 2020;2260:040010. doi: https://doi.org/10.1063/5.0015685
- Suena, Ni MDS, et al. Formulation and Antioxidant Activity Test of Centella asiatica Herba Extract and Moringa oleifera Leaves Extract as An Anti-Aging Emulgel. Tjnpr. 2024;8(3): 6525-6536 . doi: https://doi.org/10.26538/tjnpr/v8i3.9
- Esmat AU, Mittapally S, Begum S. GC-MS Analysis of Bioactive Compounds and Phytochemical Evaluation of the Ethanolic Extract of Gomphrena globosa L. Flowers. J. Drug Delivery Ther. 2020;10(2):53-58. doi: https://doi.org/10.22270/jddt.v10i2.3914
- Cahyaningsih E, Yuda PESK, Santoso P. SKRINING FITOKIMIA DAN UJI AKTIVITAS ANTIOKSIDAN EKSTRAK ETANOL BUNGA TELANG (Clitoria ternatea L.) DENGAN METODE SPEKTROFOTOMETRI UV-VIS. Jinto. 2019;5(1). doi: https://doi.org/10.36733/medicamento.v5i1.851
- Fitriyati L, Widyaningsih W, Hayu Nurani L, Utami D. Potential uses of Teki Grass (Cyperus rotundus L.) Tubers as Antioxidants in Diabetes Mellitus: In vitro Studies. Rjpt. 2024;17(7):3169-3176. doi: https://doi.org/10.52711/0974-360x.2024.00495
- Laela D. Verifikasi Metode Penetapan Kadar Fenol Total Cara Folin-Ciocalteu. Vol. 4. 2025 Aug;4(2). doi:10.25047/plp.v4i2.6193
- Suena NMDS, Antari NPU. UJI AKTIVITAS ANTIOKSIDAN MASERAT AIR BIJI KOPI (Coffea canephora) HIJAU PUPUAN DENGAN METODE DPPH (2,2-difenil-1-pikrilhidrazil). Jinto. 2020;6(2):111-117. doi: https://doi.org/10.36733/medicamento.v6i2.1106
- Suena N, Nayaka N, Wardani I, Antari N. Bilimbi (Averrhoa bilimbi L.) Leaf Extract Cream: Formulation and Efficacy in Accelerating Wound Healing in Male White Mice [Internet]. Vol. 14. 2024;14(2):223–35. doi:10.22435/jki.v14i2.6661
- Rudiyat A, Yulianti R, Indra I. FORMULASI KRIM ANTI JERAWAT EKSTRAK ETANOL KULIT PISANG KEPOK (Musa balbisiana colla). jkbth. 2020;20(2):170-180. doi: https://doi.org/10.36465/jkbth.v20i2.609
- Ghorbani A, Eghlima G, Farzaneh M, Rezghiyan A. Effect of drying methods on mucilage, anthocyanin content, and antioxidant activity of black hollyhock (Alcea rosea var. nigra). BMC Plant Biol. 2025;25(1):478. doi: https://doi.org/10.1186/s12870-025-06524-8
- Savrikar SS, Sabnis U, Sabnis M. EFFECT OF PARTICLE SIZE ON YIELD OF PLANT EXTRACT. Int J Pharm Sci Res. 2024;15(7):2064–71. doi:10.13040/IJPSR.0975-8232.15(7).2064-71
- Asmorowati H. Penetapan kadar flavonoid total buah alpukat biasa (Persea americana Mill.) dan alpukat mentega (Persea americana Mill.) dengan metode spektrofotometri UV-Vis. Jif. 2019;15(2):51-63. doi: https://doi.org/10.20885/jif.vol15.iss2.art1
- Fachriyah E, Kusrini D, Haryanto IB, Wulandari SMB, Lestari WI, Sumariyah S. Phytochemical Test, Determination of Total Phenol, Total Flavonoids and Antioxidant Activity of Ethanol Extract of Moringa Leaves (Moringa oleifera Lam). J. Kim. Sains Apl. 2020;23(8):290-294. doi: https://doi.org/10.14710/jksa.23.8.290-294
- Andriani D, Murtisiwi L. Penetapan kadar fenolik total ekstrak etanol bunga telang (clitoria ternatea l.) dengan spektrofotometri uv vis. cendekia. j. pharm. 2018;2(1):32-38. doi: https://doi.org/10.31596/cjp.v2i1.15
- Hassanpour S, Doroudi A. Review of the antioxidant potential of flavonoids as a subgroup of polyphenols and partial substitute for synthetic antioxidants. Avicenna Journal of Phytomedicine. Mashhad University of Medical Sciences; 2023. p. 354–76. doi:10.22038/AJP.2023.21774
- Ramadhan R, Sari AA. The Effect of Extraction Methods on Total Flavonoid Content and Antioxidant Activity of Kenop (Gomphrena globosa). Jps. 2025:2356-2361. doi: https://doi.org/10.36490/journal-jps.com.v8i4.1111
- Purwaningsih NS, Romlah SN, Choirunnisa A. Literature Review Uji Evaluasi Sediaan Krim. Edu Masda j. 2020;4(2):108. doi: https://doi.org/10.52118/edumasda.v4i2.102
- Sun C, Na Y, Wang Z, Zhu T, Liu X. Phytochemicals, promising strategies combating Cutibacterium acnes. Front. Pharmacol. 2024;15: 1476670. doi: https://doi.org/10.3389/fphar.2024.1476670
- Alina P, Kiełb Ewa P, František Z. Antimicrobial activity of saponin-containing plants: review. Jdvar. 2023;12(2):121-127. doi: https://doi.org/10.15406/jdvar.2023.12.00336