RESEARCH ARTICLE
Economic Pillar of SDGs and Regional Economic Growth: Panel Evidence from Java Island, Indonesia
Sustainable Economy|Vol. 2, Issue 1, pp. 10-19 (2026)
CC BY 4.0-2026 Authors
Views
Downloads
Shares
Received
Jan 28, 2026Revised
Apr 21, 2026Accepted
May 10, 2026Published
May 22, 2026
Abstract
This study examines the relationship between Sustainable Development Goals (SDGs) economic pillar indicators and regional economic performance across Java Island, Indonesia, during the 2015–2022 period. Using panel data regression analysis, the study investigates the influence of electricity accessibility, open unemployment rate, manufacturing industry growth, income inequality, and internet usage on regional economic growth. The findings reveal that manufacturing industry growth is positively and statistically significantly associated with regional economic performance, indicating the important contribution of industrial sector expansion to economic development in Java Island. In contrast, internet usage demonstrates a negative and statistically significant association with economic growth. This result should be interpreted cautiously because it may reflect structural disparities, unequal digital productivity, or consumption-oriented internet behavior rather than a direct negative causal effect on economic performance. Meanwhile, electricity accessibility, open unemployment rate, and income inequality do not show statistically significant relationships with regional economic growth during the observed period. Overall, the findings suggest that sectoral productivity and structural economic transformation play a more substantial role than basic infrastructure indicators in shaping regional economic performance. These results contribute to the growing literature on SDGs-based economic development and provide practical insights for policymakers in formulating more balanced, inclusive, and sustainable regional development strategies. Strengthening productive sectors while improving the quality of digital utilization may support long-term economic resilience and sustainable development achievement across regions in Indonesia more effectively overall. Future studies are encouraged to include environmental, educational, and institutional indicators to provide broader explanations of regional economic sustainability in Indonesia today.
Keywords:
Introduction
Economic growth remains a central objective of national development, as it reflects an economy’s capacity to expand production, increase income per capita, and improve societal welfare through structural transformation and equitable distribution (1). In developing countries, this objective extends beyond output expansion to include institutional modernization, technological progress, and social transformation that collectively underpin sustainable development. However, conventional growth models have often prioritized resource exploitation with limited consideration of environmental sustainability and social equity, resulting in persistent challenges such as environmental degradation, climate change, and widening socioeconomic disparities. These issues have intensified the urgency to integrate sustainability principles into development strategies, particularly within the framework of the Sustainable Development Goals (SDGs), which aim to harmonize economic, social, and environmental dimensions (2).
Indonesia provides a relevant case, as it has maintained relatively stable economic growth reaching 5.31% in 2022 yet continues to face structural challenges related to inequality, unemployment, and regional disparities (3). This paradox is especially evident in Java Island, which contributes more than half of national economic output but does not consistently exhibit the highest growth rates, suggesting that economic concentration alone does not guarantee inclusive and sustainable development.
Addressing these challenges requires a comprehensive understanding of the economic pillar of the SDGs, which includes access to energy, labor market conditions, industrial development, income distribution, and digital connectivity. While progress has been made in SDG implementation, significant disparities remain across regions and indicators in Indonesia (4, 5). In Java, near-universal electrification reflects substantial infrastructure development, yet variations in unemployment, manufacturing performance, income inequality, and internet penetration indicate persistent structural imbalances. From a theoretical perspective, these indicators are closely linked to economic growth but operate through complex and interrelated mechanisms. Electricity access supports production and industrialization (6). employment conditions reflect the economy’s capacity to generate productive activities, and the manufacturing sector plays a central role in driving productivity, technological advancement, and economic expansion (7). Nevertheless, empirical evidence suggests that manufacturing productivity in Java remains relatively constrained compared to other regions (8). Furthermore, income inequality and digital transformation introduce additional complexity, as they may simultaneously promote growth while also exacerbating disparities, depending on structural conditions (9). These dynamics highlight the limitations of partial or single-indicator approaches in explaining regional economic performance.
Despite the growing body of literature, several critical gaps remain. Existing studies tend to examine SDG indicators in isolation, with limited attention to their combined and potentially interacting effects within a unified analytical framework. Moreover, empirical research focusing specifically on Java Island as Indonesia’s economic core remains relatively scarce, particularly studies that integrate structural, industrial, and digital dimensions simultaneously. The role of digitalization, in particular, has not been sufficiently explored in regional growth analysis, especially in terms of its potentially non-linear or context-dependent effects. In response to these gaps, this study proposes an integrated empirical approach that examines the influence of SDGs economic pillar indicators namely electricity accessibility, open unemployment rate, manufacturing industry growth, income inequality, and internet usage on regional economic growth in Java during 2015–2022. Using panel data regression models, including Common Effect, Fixed Effect, and Random Effect specifications, this study aims to provide a more comprehensive and balanced understanding of sustainable economic dynamics. The findings are expected to contribute to the literature by offering a more integrated perspective on the SDGs economic pillar and to inform policy strategies for achieving inclusive and sustainable regional development.
Methodology
Study Design and Analytical Framework
This study employs a quantitative explanatory research design to examine the relationship between Sustainable Development Goals (SDGs) indicators within the economic pillar and regional economic growth in Java Island, Indonesia. The quantitative approach is selected because it enables the testing of theoretical relationships among variables through statistical inference using numerical data. Specifically, this study focuses on the influence of electricity accessibility, open unemployment rate, manufacturing industry growth, income inequality, and internet usage on economic growth. These variables represent the economic pillar of the SDGs, namely Goals 7, 8, 9, 10, and 17, which collectively reflect structural dimensions of sustainable economic development.
The analytical framework is constructed based on panel data econometrics, integrating cross-sectional and time-series dimensions to capture both spatial and temporal variations in economic performance across provinces in Java Island. Panel data analysis is particularly appropriate because it allows for controlling unobserved heterogeneity among regions and improving estimation efficiency compared to purely cross-sectional or time-series models. The research model is designed to evaluate both partial and simultaneous effects of SDGs indicators on economic growth, thereby providing a comprehensive assessment of sustainable development dynamics at the regional level.
Population, Sample, and Data Structure
The population of this study consists of all provinces located on Java Island, Indonesia. The sample includes six provinces: DKI Jakarta, West Java, Central Java, DI Yogyakarta, East Java, and Banten. These provinces are selected using a census approach because they represent the complete administrative units within the study area, ensuring full regional coverage. The dataset comprises balanced panel data with a time span from 2015 to 2022, resulting in 48 observations (6 provinces × 8 years).
The study utilizes secondary data derived from official national institutions, including the Central Bureau of Statistics (Badan Pusat Statistik, BPS) and the National Development Planning Agency (Bappenas) for SDGs-related indicators. Secondary data are chosen because they provide standardized, reliable, and comparable statistical measurements across regions and time periods, which are essential for rigorous econometric analysis. In addition, a literature review is conducted to support theoretical justification and variable selection, drawing on academic journals, books, and policy documents relevant to sustainable development and economic growth.
Variables and Operational Definitions
The dependent variable in this study is economic growth (Y), measured by the growth rate of Gross Regional Domestic Product (GRDP) at constant prices, which reflects the real expansion of regional economic output. The independent variables are defined as follows: electricity accessibility (X1), measured by the electrification ratio; open unemployment rate (X2), measured as the percentage of unemployed individuals in the labor force; manufacturing industry growth (X3), measured by the growth rate of manufacturing sector GRDP; income inequality (X4), measured using the Gini ratio; and internet usage (X5), measured as the percentage of individuals using the internet. These indicators are selected because they represent key dimensions of the SDGs economic pillar and are widely used in empirical studies on sustainable development and economic performance.
The operationalization of variables is designed to ensure consistency with national statistical standards and SDGs monitoring frameworks. By integrating these indicators into a single econometric model, this study captures both structural and technological determinants of economic growth, thereby extending previous research that often focuses on isolated variables rather than an integrated SDGs framework.
These variables were selected because they represent the core dimensions of the SDGs economic pillar and have been widely applied in empirical studies examining the relationship between structural development indicators and economic growth. Their inclusion allows for capturing both traditional and emerging determinants of regional economic performance within a unified analytical framework.
Econometric Model Specification and Estimation Procedure
To examine the relationship between SDGs indicators and economic growth, this study employs a panel data regression model. The model used in this study is presented in Equation (1) as follows:
where Yitdenotes economic growth in province i at time t; α represents the intercept; β1…β5 are the coefficients of the independent variables; X1it to X5it denote electricity accessibility, open unemployment rate, manufacturing industry growth, income inequality, and internet usage, respectively; and it\varepsilon_{it} t is the error term. This equation corresponds to the regression model introduced in the methodological framework of the study and serves as the basis for empirical estimation.
Three alternative panel data estimation models are applied: the Common Effect Model (CEM), Fixed Effect Model (FEM), and Random Effect Model (REM). The CEM assumes homogeneous intercepts across cross-sectional units, while the FEM allows for individual-specific intercepts to capture unobserved heterogeneity among provinces. The REM treats individual effects as random variables, which is appropriate when cross-sectional units are assumed to be randomly drawn from a larger population. Each model provides different assumptions regarding the relationship between the individual effects and explanatory variables, thereby influencing the consistency and efficiency of the estimation results.
The selection of the most appropriate model is conducted through a series of specification tests, including the Chow test, Hausman test, and Lagrange Multiplier test, following standard panel data econometric procedures. The Chow test is used to determine whether the Fixed Effect Model is preferable to the Common Effect Model by examining the presence of individual-specific effects. Subsequently, the Hausman test is employed to compare the Fixed Effect Model and Random Effect Model in order to identify whether the individual effects are correlated with the independent variables. In addition, the Lagrange Multiplier test is applied to evaluate whether the Random Effect Model is more appropriate than the Common Effect Model. The final model selected from these tests is expected to provide the most efficient and consistent estimation for analyzing the influence of SDGs economic pillar indicators on economic growth across provinces over the study period (10).
Diagnostic Tests and Model Validation
To ensure the robustness and validity of the estimated model, a series of diagnostic tests were conducted. Multicollinearity was assessed using the Variance Inflation Factor (VIF), with no indication of serious multicollinearity among the independent variables. Heteroskedasticity was examined using the Breusch–Pagan test, and appropriate corrections were applied where necessary. Autocorrelation was evaluated using the Durbin–Watson statistic, suggesting no major autocorrelation issues in the model.
These diagnostic procedures complement the subsequent hypothesis testing, including t-tests for individual parameter significance and F-tests for joint significance. The coefficient of determination (R²) was also employed to evaluate the explanatory power of the model. Overall, these procedures follow standard econometric practices and enhance the reliability and interpretability of the regression results.
Data Analysis
Data processing and econometric estimation are conducted using panel regression techniques. The analysis begins with descriptive statistics to identify patterns and trends in SDGs indicators across provinces and time periods, followed by regression analysis to examine the direction and magnitude of relationships between variables. The results are interpreted in light of sustainable development theory and empirical evidence from previous studies. Nevertheless, it is acknowledged that the model may be subject to limitations related to omitted variables and data constraints, which should be considered when interpreting the empirical results.
Results and Discussion
Descriptive Patterns of SDGs Economic Indicators and Economic Growth in Java Island
This section presents the empirical dynamics of economic growth and SDGs economic pillar indicators across provinces in Java Island during the period 2015–2022. The descriptive trends are illustrated in Figure 1 to Figure 6, which depict the evolution of electrification ratio, open unemployment rate, manufacturing industry growth, income inequality, internet usage, and economic growth.
Java Island represents the economic core of Indonesia, characterized by a high concentration of population and economic activity, thereby providing an important context for analyzing regional economic dynamics and disparities.
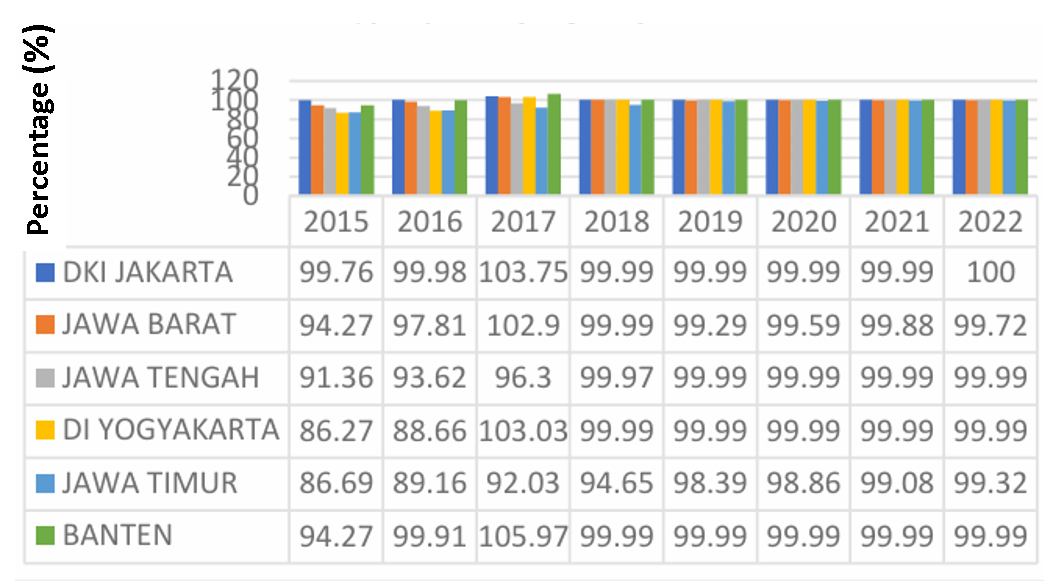
The electrification ratio in Java Island shows a consistently upward trend, approaching universal access in most provinces. As depicted in Figure 1, provinces such as DKI Jakarta, West Java, Central Java, and DI Yogyakarta achieved electrification ratios close to or exceeding 99% by 2022, indicating that electricity access has reached a mature stage. For instance, DKI Jakarta achieved a 100% electrification ratio in 2022, reflecting the government’s commitment to expanding electricity infrastructure. However, variations across provinces remain evident, particularly in East Java during the earlier years of observation. This pattern suggests that while infrastructure development has progressed significantly, disparities in access and utilization persist across regions.
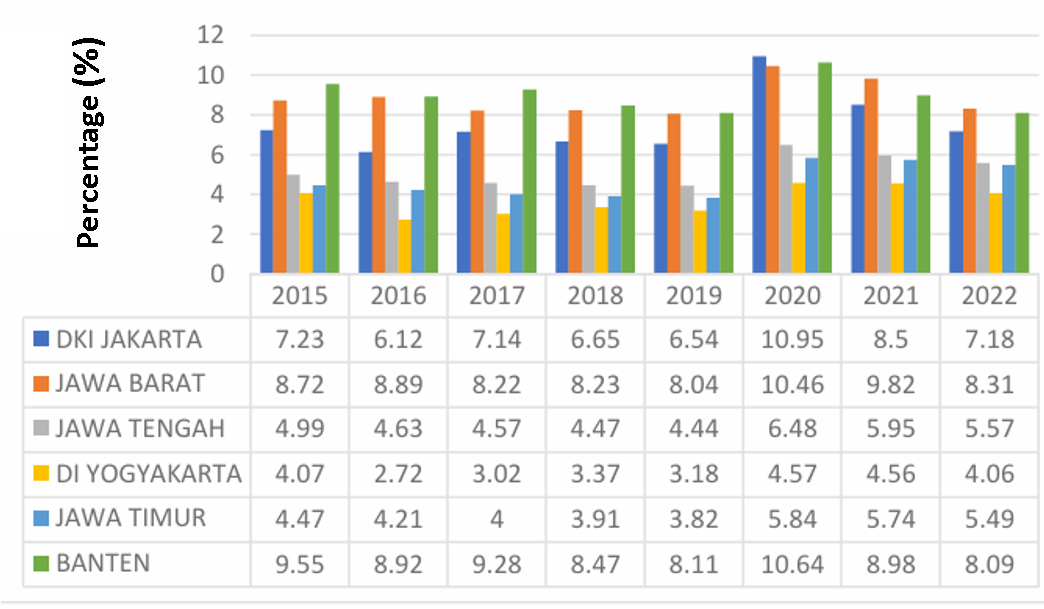
The open unemployment rate exhibits notable fluctuations across provinces, as illustrated in Figure 2. Provinces such as DKI Jakarta, West Java, and Banten consistently recorded unemployment rates above the national average, reflecting the demographic pressure and labor market competition in urbanized regions. For example, Banten recorded the highest unemployment rate in 2020, reaching 10.64%, driven by economic slowdown and industrial relocation. These findings suggest that labor market dynamics in Java Island are shaped by urbanization, industrial restructuring, and macroeconomic shocks, particularly during the COVID-19 pandemic.
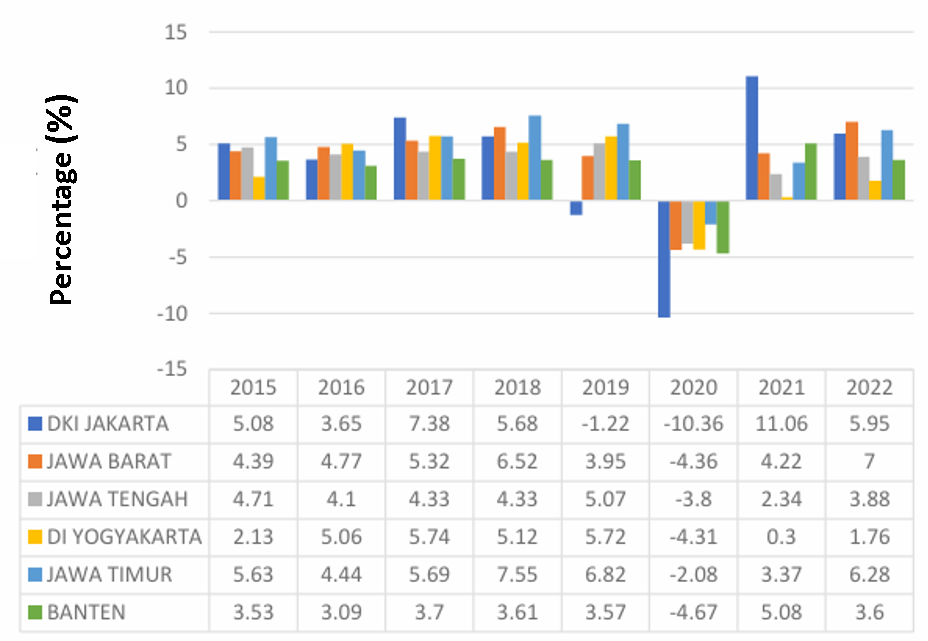
Manufacturing industry growth, depicted in Figure 3, shows heterogeneous patterns across provinces and time periods. Provinces such as West Java, Central Java, DI Yogyakarta, and East Java experienced varying degrees of industrial expansion, while others faced contraction during certain periods, particularly in 2020. For instance, DKI Jakarta experienced a significant decline in manufacturing growth in 2020 (-10.36%), followed by a strong recovery in 2021 (11.06%). These fluctuations highlight the sensitivity of the manufacturing sector to global economic conditions, technological change, and policy interventions.
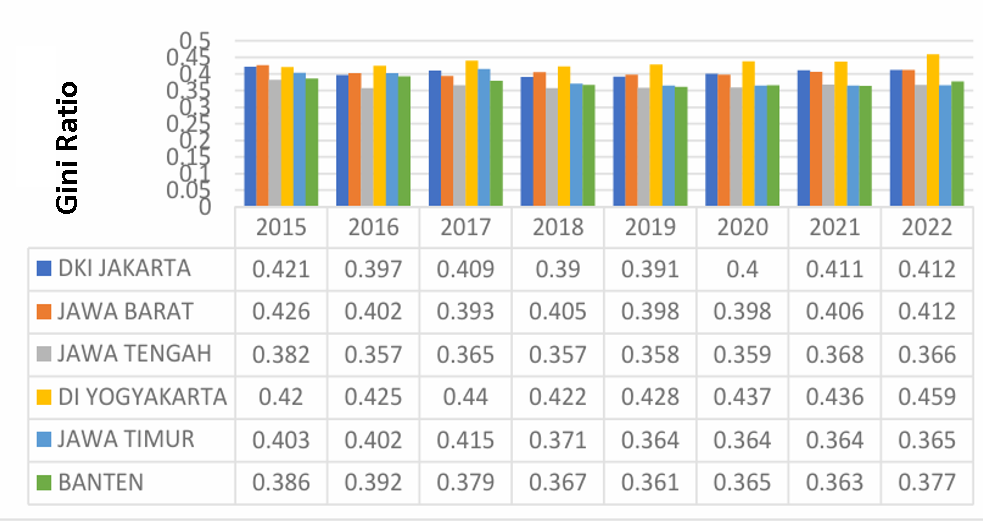
Income inequality, measured by the Gini ratio and illustrated in Figure 4 remains a persistent challenge in Java Island. DI Yogyakarta consistently recorded the highest Gini ratio, reaching 0.459 in 2022, indicating severe inequality relative to other provinces. This phenomenon may be attributed to the concentration of economic growth in the tourism and education sectors, which disproportionately benefit middle- and upper-income groups (13, 14). The persistence of inequality despite economic growth underscores the structural nature of disparities in Java Island.
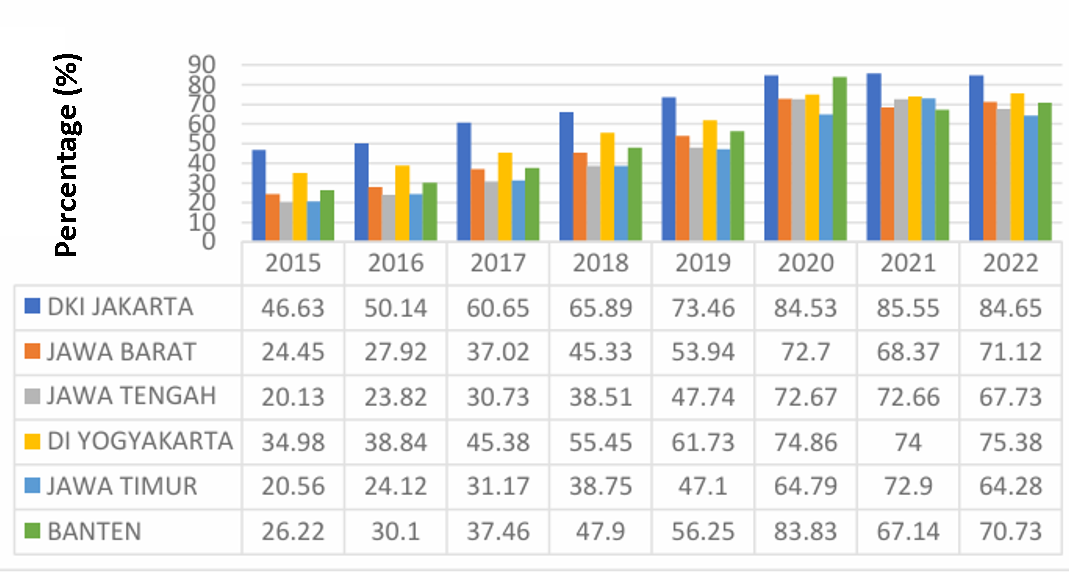
Internet usage, depicted in Figure 5, increased significantly across all provinces, reflecting rapid digitalization and technological diffusion. DKI Jakarta consistently recorded the highest proportion of internet users, increasing from 46.63% in 2015 to 84.65% in 2022, while East Java recorded the lowest levels in both years. These trends suggest that digital access has expanded substantially but remains uneven across provinces.
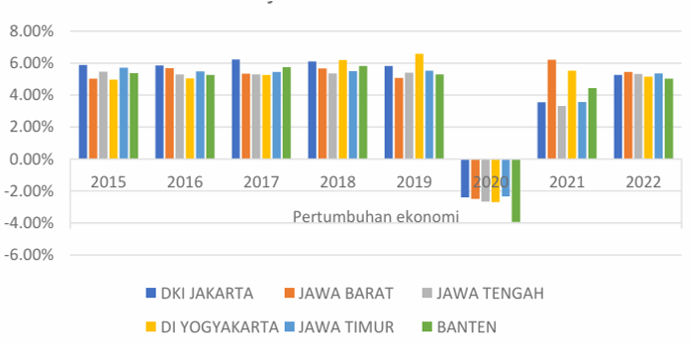
Economic growth, illustrated in Figure 6, exhibits considerable variation across provinces and years. The most significant decline occurred in 2020 due to the COVID-19 pandemic, with Banten recording the largest contraction (-3.08%) and DKI Jakarta experiencing a relatively smaller decline (-2.29%). This pattern suggests that provinces with stronger technological capacity and human capital were better able to adapt to economic disruptions. Overall, the descriptive analysis reveals complex interactions between infrastructure, labor markets, industrial development, inequality, digitalization, and economic growth.
Panel Data Model Selection and Econometric Specification
To examine the relationship between SDGs economic pillar indicators and economic growth, this study employs panel data regression analysis. The selection of the most appropriate model is based on a sequence of specification tests, namely the Chow test, Hausman test, and Lagrange Multiplier test, as reported in Table 1 to Table 8. These tests were conducted to determine whether the Common Effect Model (CEM), Fixed Effect Model (FEM), or Random Effect Model (REM) was the most suitable approach for estimating the relationship among variables. The panel data approach was chosen because it combines both cross-sectional and time-series data, allowing the analysis to capture variations across provinces and over time more effectively. Furthermore, panel data regression provides more informative data, greater variability, and higher efficiency in estimation compared to using only cross-sectional or time-series data separately.
| Effects Test | Statistic | d. f. | Prob. |
|---|---|---|---|
| Cross-section F | 1.469917 | (5, 37) | 0.2231 |
| Cross-section Chi-square | 8.696899 | 5 | 0.1218 |
| Source: EViews 12 output (processed data), 2024. | |||
| Test Summary | Chi-Sq. Statistic | d. f. | Prob. |
|---|---|---|---|
| Cross-section random | 7.349583 | 5 | 0.1959 |
| Source: EViews 12 output (processed data), 2024. | |||
| Test Type | Cross-section | Time | Both |
|---|---|---|---|
| Breusch–Pagan (Statistic) | 0.545697 | 5.087331 | 5.633028 |
| Breusch–Pagan (Prob. ) | 0.4601 | 0.0241 | 0.0176 |
| Source: EViews 12 output (processed data), 2024. | |||
The Chow test results suggest that the probability value of the cross-section F statistic is 0.2231, which exceeds the 5% significance level. This finding implies that the Common Effect Model (CEM) is initially preferred over the Fixed Effect Model (FEM). The Hausman test further reveals a probability value of 0.1959, indicating that the Random Effect Model (REM) is statistically more appropriate than the Fixed Effect Model. The Lagrange Multiplier test yields a Breusch–Pagan probability value of 0.0176, which is below the 5% significance level, confirming that the Random Effect Model is more appropriate than the Common Effect Model.
Based on these results, the Random Effect Model is selected as the most appropriate specification for the panel regression analysis. This model captures unobserved heterogeneity across provinces while maintaining estimation efficiency under the assumption that individual effects are uncorrelated with the explanatory variables (15).
Regression Results and Individual Effects
The Random Effect Model estimation results are presented in Table 4, while the individual effects across provinces are reported in Table 5. The regression equation is specified in Equation (2) as follows:
where Yit denotes economic growth, ELit electrification ratio, TPTit open unemployment rate, IMit manufacturing industry growth, RGit income inequality, and PINit internet usage.
| Dependent Variable: Economic Growth (Y) Method: Panel EGLS (Cross-section random effects) Sample Period: 2015–2022 Periods Included: 8 Cross-sections Included: 6 Total Balanced Observations: 48 | |||||
|---|---|---|---|---|---|
| Panel Regression Results | |||||
| Variable | Coefficient | Std. Error | t-Statistic | Prob. | |
| C (Constant) | -9.056740 | 7.461907 | -1.213730 | 0.2316 | |
| EL (Electrification Ratio) | 0.092720 | 0.070347 | 1.318036 | 0.1946 | |
| TPT (Open Unemployment Rate) | -0.072945 | 0.111648 | -0.653350 | 0.5171 | |
| IM (Manufacturing Industry Growth) | 0.508191 | 0.066857 | 7.601159 | 0.0000 | |
| RG (Gini Ratio) | 12.82163 | 8.684284 | 1.476418 | 0.1473 | |
| PIN (Internet Users) | -0.037827 | 0.015163 | -2.494757 | 0.0166 | |
| Effects Specification | |||||
| Effects Type | S. D. | Rho | |||
| Cross-section random | 1.66E-07 | 0.0000 | |||
| Idiosyncratic random | 1.544258 | 1.0000 | |||
| Weighted Statistics | |||||
| Indicator | Value | Indicator | Value | ||
| Root MSE | 1.484376 | R-squared | 0.709115 | ||
| Mean dependent var | 4.340625 | Adjusted R-squared | 0.674486 | ||
| S. D. dependent var | 2.781346 | S. E. of regression | 1.586865 | ||
| Sum squared resid | 105.7618 | F-statistic | 20.47741 | ||
| Durbin–Watson stat | 2.303552 | Prob (F-statistic) | 0.000000 | ||
| Unweighted Statistics | |||||
| Indicator | Value | ||||
| R-squared | 0.709115 | ||||
| Mean dependent var | 4.340625 | ||||
| Sum squared resid | 105.7618 | ||||
| Durbin–Watson stat | 2.303552 | ||||
| Source: EViews 12 output (processed data), 2024. | |||||
| Variable / Cross-section | Coefficient | Individual Effect |
|---|---|---|
| Regression Coefficients | ||
| C (Constant) | -9.056739 | |
| EL (Electrification Ratio) | 0.0927204 | |
| TPT (Open Unemployment Rate) | -0.072945 | |
| IM (Manufacturing Industry Growth) | 0.508191 | |
| RG (Gini Ratio) | 12.821634 | |
| PIN (Internet Users) | -0.037826 | |
| Random Effects (Cross-section) | ||
| Banten | 3.843246 | -5.213493 |
| DKI Jakarta | 5.16553 | -3.891209 |
| West Java | -3.097136 | -3.004415 |
| Central Java | -1.048283 | -10.105022 |
| East Java | -6.481361 | -15.5381 |
| DI Yogyakarta | 6.745493 | -2.311246 |
The results suggest that electricity accessibility has a positive coefficient (0.092720) but is statistically insignificant (p = 0.1946). The open unemployment rate exhibits a negative coefficient (-0.072945) and is also statistically insignificant (p = 0.5171). In contrast, manufacturing industry growth is positively and statistically significantly associated with economic growth (β = 0.508191; p = 0.0000). Income inequality has a positive but statistically insignificant coefficient (β = 12.82163; p = 0.1473), while internet usage is negatively and statistically significantly associated with economic growth (β = -0.037827; p = 0.0166).
The individual effects analysis reveals substantial heterogeneity across provinces. For instance, DKI Jakarta exhibits an individual effect of -3.891209, West Java -3.004415, Central Java -10.105022, DI Yogyakarta -2.311246, East Java -15.5381, and Banten -5.213493. These values suggest that provincial characteristics significantly influence economic growth outcomes, reflecting differences in industrial structure, infrastructure, labor markets, and socio-economic conditions. This result should therefore be interpreted with caution.
Hypothesis Testing and Model Performance
The results of the individual significance tests (t-tests) are reported in Table 6. The findings suggest that manufacturing industry growth and internet usage significantly influence economic growth, while electricity accessibility, open unemployment rate, and income inequality do not exert significant partial effects.
| Variable | Coefficient t | Std. Error | t-Statistic | Prob. |
|---|---|---|---|---|
| C (Constant) | -9.056740 | 7.461907 | -1.213730 | 0.2316 |
| EL (Electrification Ratio) | 0.092720 | 0.070347 | 1.318036 | 0.1946 |
| TPT (Open Unemployment Rate) | -0.072945 | 0.111648 | -0.653350 | 0.5171 |
| IM (Manufacturing Industry Growth) | 0.508191 | 0.066857 | 7.601159 | 0.0000 |
| RG (Gini Ratio) | 12.82163 | 8.684284 | 1.476418 | 0.1473 |
| PIN (Internet Users) | -0.037827 | 0.015163 | -2.494757 | 0.0166 |
| Source: EViews 12 output (processed data), 2024. | ||||
The simultaneous significance test (F-test), presented in Table 7, shows that the probability value of the F-statistic is 0.000000, indicating that all independent variables jointly exert a statistically significant effect on economic growth. This result demonstrates that SDGs economic pillar indicators collectively are associated with regional economic performance in shaping regional economic performance.
| Statistic | Value |
|---|---|
| F-statistic | 20.47741 |
| Prob (F-statistic) | 0.000000 |
| Source: EViews 12 output (processed data), 2024. | |
The explanatory power of the model is assessed using the coefficient of determination (R²), as reported in Table 8. The adjusted R² value of 0.674486 indicates that approximately 67.44% of the variation in economic growth can be explained by the selected SDGs indicators, while the remaining 32.56% is attributable to other factors not included in the model.
| Indicator | Value |
|---|---|
| R-squared | 0.709115 |
| Adjusted R-squared | 0.674486 |
Electricity Accessibility and Economic Growth
The positive but insignificant relationship between electricity accessibility and economic growth suggests that electrification in Java Island has reached a saturation stage. At this stage, additional improvements in electricity access no longer generate substantial economic gains. This phenomenon may be attributed to the near-universal electrification ratio achieved in several provinces, particularly DKI Jakarta.
Furthermore, disparities in electricity distribution and utilization across provinces may limit the economic impact of electrification. Although electricity consumption has increased, its contribution to productive economic activities may be constrained by structural factors, such as uneven industrial development and technological capacity. This finding is consistent with previous studies reporting that electricity availability has a positive but statistically insignificant effect on economic growth (16, 17).
From a theoretical perspective, this result aligns with Keynesian and Cobb–Douglas frameworks, which suggest that energy consumption contributes positively to economic growth but may exhibit diminishing returns in the long run. As economies reach a certain level of infrastructure maturity, additional energy inputs may yield limited marginal productivity gains.
Open Unemployment Rate and Economic Growth
The negative but insignificant effect of the open unemployment rate on economic growth indicates that labor market conditions in Java Island do not directly translate into variations in economic performance. High unemployment levels reduce household consumption, weaken investment, and constrain production, thereby exerting downward pressure on economic growth. However, the absence of statistical significance suggests that other structural factors may play a more dominant role in determining economic growth.
This finding is consistent with Okun’s law, which posits a negative relationship between unemployment and economic growth, although the magnitude of the effect may vary across contexts (18). Empirical evidence from previous studies also indicates that unemployment may not significantly influence economic growth in certain regional contexts (19, 20).
Manufacturing Industry Growth and Economic Growth
Manufacturing industry growth emerges as the most influential determinant of economic growth in Java Island. The positive and statistically significant coefficient indicates that industrial expansion plays a central role in driving regional economic performance. The manufacturing sector contributes significantly to GDP, employment, and technological innovation, thereby enhancing economic growth.
The strong role of manufacturing in Java Island reflects the region’s high concentration of industrial activities, with more than 65% of manufacturing firms, 73% of manufacturing labor, and 51.99% of foreign investment located in Java (21). This finding is consistent with the Harrod–Domar growth model, which emphasizes the role of investment and industrial expansion in economic growth (22).
Income Inequality and Economic Growth
The positive but insignificant effect of income inequality on economic growth reflects the complex relationship between inequality and economic performance. In Java Island, industrial agglomeration and spatial concentration of economic activities generate disparities in income distribution across regions. Although inequality does not significantly constrain economic growth in the short term, it poses long-term risks to social cohesion and sustainable development.
This phenomenon is consistent with the argument that economic agglomeration leads to spatial income disparities (21). Moreover, persistent inequality in provinces such as DI Yogyakarta highlights the structural nature of disparities in Java Island’s development trajectory.
Internet Usage and Economic Growth
One of the most striking findings of this study is the negative and statistically significant relationship between internet usage and economic growth. While digitalization is generally expected to enhance productivity and economic performance, the results suggest that increased internet usage in Java Island is associated with lower economic growth.
This paradox may be explained by several factors. First, internet usage may be dominated by consumption-oriented activities rather than productive economic engagement. Second, digital inequality across provinces may limit the economic benefits of internet expansion. Third, the economic impact of digital infrastructure may exhibit a time lag, such that investments in digital technology do not immediately translate into measurable economic gains.
Integrated Interpretation within the SDGs Framework
Overall, the findings of this study demonstrate that SDGs economic pillar indicators exert both direct and indirect effects on economic growth in Java Island. While manufacturing industry growth plays a dominant role, other indicators exhibit limited or contradictory effects. This suggests that sustainable economic development in Java Island is shaped by the interaction of multiple structural factors, including infrastructure, labor markets, industrial capacity, inequality, and digitalization.
The simultaneous significance of all variables indicates that the SDGs economic pillar constitutes an integrated system in shaping economic growth. However, the partial insignificance of several variables reveals structural gaps in Java Island’s development trajectory, where economic growth increases despite constraints in key sustainable development indicators.
Conclusion
This study examines the relationship between SDGs economic pillar indicators and economic growth in Java Island during 2015–2022 using panel data regression analysis. The findings show that manufacturing industry growth is positively and statistically significantly associated with economic growth, while internet usage is negatively and significantly associated with economic growth, which should be interpreted with caution as it may reflect underlying structural and behavioral factors rather than a direct causal relationship. In contrast, electricity accessibility, open unemployment rate, and income inequality do not show statistically significant relationships. Overall, the results suggest that structural and sectoral dynamics may play a more important role than basic infrastructure indicators in shaping regional economic performance, providing insights for more balanced and sustainable development strategies.
Declarations
Conflict of Interest
The author declares no conflicting interest.
Data Availability
All data generated or analyzed during this study are included in this published article.
Ethics Statement
Ethical approval was not required for this study.
Funding Information
The author declares that no financial support was received for the research, authorship, and/or publication of this article.
References
- Salasatun Siti Fatimah, Astuti Rahayu. Pengaruh Pembangunan Bandara Yogyakarta International Airport (YIA) Terhadap Pertumbuhan Ekonomi Kabupaten/Kota Provinsi D.I. Yogyakarta 2017-2022. Inisiatif. 2023;2(2):105-120. doi: https://doi.org/10.30640/inisiatif.v2i2.727
- Programme UND. Sustainable Development Goals. New York: UNDP; 2021.
- Statistik BP. Pertumbuhan ekonomi Indonesia tahun 2022 dan proyeksi 2023. Jakarta; 2023.
- Sastryawanto H. Analisis Sustainable Development Goals (SDGs) Kabupaten Bojonegoro Tahun 2017. Jisa. 2017;17(1)[No Pages]. doi: https://doi.org/10.30742/jisa.v17i1.381
- Roziika A, Nurwati RN. Pengaruh Penerapan Sustainable Development Goals Terhadap Kependudukan Di Indonesia Dalam Membangun Perekonomian Nasional. Universitas Padjadjaran; 2020.
- Putra CP, Tuegeh M, Tumaliang H, Patras LS. Analisa Pertumbuhan Beban Terhadap Ketersediaan Energi Listrik di Sistem Kelistrikan Sulawesi Selatan. J Tek Elektro dan Komput. 2014;3(2):19–30.
- Rahman T. Pengaruh Realisasi Belanja Daerah Dan Upah Minimum Terhadap Tingkat Pengangguran Di Provinsi Lampung Dalam Perspektif Ekonomi Islam. Eqien. 2023;12(03):374-383. doi: https://doi.org/10.34308/eqien.v12i03.1428
- Sari RDP, Oktora SI. Determinan Produktivitas Tenaga Kerja Industri Manufaktur Besar dan Sedang di Pulau Jawa. Jepi. 2021;21(2):185-203. doi: https://doi.org/10.21002/jepi.v21i2.1298
- Sidqiy A, Amar S. Faktor – Faktor Yang Mempengaruhi Pemerataan Pendapatan di Indonesia. Ecosains. 2020;9(1):48. doi: https://doi.org/10.24036/ecosains.11549957.00
- Madsen JB. Book review: Basic Econometrics, Damodar N. Gujarati, McGraw-Hill, New York, 1995, ISBN 0-07-025214-9 (paperback), pp. 838. Price US$74.95, £23.50 (paperback). J. Appl. Econ. 1998;13(2):209-212. doi: https://doi.org/10.1002/(sici)1099-1255(199803/04)13:2<209::aid-jae488>3.0.co;2-u
- Padang L, Murtala M. Pengaruh jumlah penduduk miskin dan tingkat pengangguran terbuka terhadap pertumbuhan ekonomi di indonesia. j. ekonomika indonesia. 2020;9(1):9. doi: https://doi.org/10.29103/ekonomika.v9i1.3167
- Tanjung AA, Syafii M, Tarigan SB, Harahap WG. Analisis Pengaruh Ekonomi Digital Terhadap Pertumbuhan Ekonomi di Indonesia: Model Data Panel. ekuitas. 2022;4(2):567-575. doi: https://doi.org/10.47065/ekuitas.v4i2.2223
- Anshori M, Iswati S. Metodologi penelitian kuantitatif. 1st ed. Surabaya: Airlangga University Press; 2019.
- Kumala SL. Perkembangan Ekonomi Berbasis Digital Di Indonesia. esensi. 2022;1(2):109-117. doi: https://doi.org/10.52421/jurnal-esensi.v1i2.190
- Madsen JB. Book review: Basic Econometrics, Damodar N. Gujarati, McGraw-Hill, New York, 1995, ISBN 0-07-025214-9 (paperback), pp. 838. Price US$74.95, £23.50 (paperback). J. Appl. Econ. 1998;13(2):209-212. doi: https://doi.org/10.1002/(sici)1099-1255(199803/04)13:2<209::aid-jae488>3.0.co;2-u
- Nugraha G, Akbar MF, Hamsani H. Pengaruh Listrik, Modal, dan Tenaga Kerja Terhadap PDRB Di Provinsi Kepulauan Bangka Belitung. equity. 2022;10(1):36-45. doi: https://doi.org/10.33019/equity.v10i1.94
- Husna Z, Idris I. Pengaruh konsumsi energi dan rezim terhadap pertumbuhan ekonomi di indonesia. Jkep. 2019;1(2):401. doi: https://doi.org/10.24036/jkep.v1i2.6207
- Pakri P. Analisis hubungan kausalitas pengangguran, inflasi dan pertumbuhan ekonomi di indonesia (data time series 2010-2019). Pareto. 2023;5(2):99. doi: https://doi.org/10.32663/pareto.v5i2.3440
- Iqbal M, Junaidi J, Hardiani H. Analisis pengaruh tingkat pengangguran, pertumbuhan penduduk, tingkat kemiskinan dan indeks pembangunan manusia terhadap pertumbuhan ekonomi di Kabupaten Tanjung Jabung Barat. Jels. 2018;7(3):144-157. doi: https://doi.org/10.22437/jels.v7i3.11941
- Ardian R, Syahputra M, Desmawan D. Pengaruh pertumbuhan ekonomi terhadap tingkat pengangguran terbuka di indonesia. Ebismen. 2022;1(3):190-198. doi: https://doi.org/10.58192/ebismen.v1i3.90
- Nugroho YD, Wahyuni KT. Aglomerasi dan dinamika industri manufaktur pada era revolusi industri 4.0 di koridor ekonomi jawa. semnasoffstat. 2020;2019(1):687-699. doi: https://doi.org/10.34123/semnasoffstat.v2019i1.251
- Anggapratama R, Irnawati D. Dampak Penggunaan Kredit Perbankan dan Pertumbuhan Industri Manufaktur terhadap Pertumbuhan Ekonomi Indonesia. joe. 2023;5(3):9691-9701. doi: https://doi.org/10.31004/joe.v5i3.1784