RESEARCH ARTICLE
Green Economy Transition and Labor Productivity Dynamics in Indonesia: Evidence from 2014–2023 Time-Series Analysis
Sustainable Economy|Vol. 2, Issue 1, pp. 1-9 (2026)
CC BY 4.0-2026 Authors
Views
Downloads
Shares
Received
Feb 25, 2026Revised
Mar 31, 2026Accepted
May 11, 2026Published
May 20, 2026
Abstract
Indonesia faces the dual challenge of sustaining economic growth while reducing environmental pressure in line with the Sustainable Development Goals (SDGs). Evidence regarding how green economy indicators relate to labor productivity in Indonesia remains limited, particularly during the post-SDG period. This study contributes by integrating green economy indicators with macroeconomic determinants of labor productivity within a unified empirical framework. The study analyzes selected green economy indicators and examines the relationship between labor productivity and key macroeconomic variables in Indonesia during 2014–2023 using a quantitative time-series approach. Descriptive analysis and Ordinary Least Squares regression are applied to annual national data. Results show that emission intensity declined from 5.1 to 4.0 and final energy intensity from 0.43 to 0.34, indicating improved environmental efficiency, while GDP per capita increased from approximately USD 3,600 to USD 4,870. Regression results indicate that labor force size is negatively associated with labor productivity (β = −0.4711; p = 0.0216), suggesting that increases in labor supply may reduce average productivity when not supported by skills and capital. GDP per capita is positively associated with productivity (β = 3.95 × 10⁻⁷; p = 0.0380), reflecting the role of structural upgrading and technological progress. Energy consumption is not statistically significant (p = 0.9545), indicating a weakening link between energy use and productivity. The model explains 62.49% of productivity variation (R² = 0.6249). Findings should be interpreted cautiously because of the small sample size. These findings support Indonesia’s transition toward a sustainable green economy through productivity-driven and environmentally efficient economic development.
Introduction
The global development paradigm is undergoing a fundamental transformation as nations confront the intertwined challenges of economic growth, environmental degradation, and social inequality (1). Although global economic expansion has been sustained, it has often been accompanied by rising carbon emissions, ecosystem degradation, and widening productivity gaps (2). The traditional growth model, frequently measured through conventional Gross Domestic Product (GDP), has been criticized for neglecting environmental externalities and resource depletion, resulting in what is commonly referred to as “brown growth (3). ” This approach is increasingly viewed as incompatible with sustainable development objectives. In response, the international community adopted the Millennium Development Goals (MDGs) in 2000 and subsequently transitioned to the Sustainable Development Goals (SDGs) in 2015, marking a paradigm shift toward a more integrated, inclusive, and environmentally conscious development framework (4). Indonesia, as one of the world’s largest emerging economies and among the top global greenhouse gas emitters, faces a dual challenge: sustaining economic growth and labor productivity while simultaneously reducing environmental pressures (5). Recent evidence shows that while Indonesia’s SDG performance has improved, key challenges persist in climate action, sustainable cities, and ecosystem protection (6). Moreover, the country’s energy structure continues to rely heavily on fossil fuels, while renewable energy consumption remains comparatively low (7). These conditions reinforce the urgency of transitioning toward a green economy that balances productivity and sustainability (8).
Labor productivity is a key determinant of long-term growth, income, and national competitiveness (9). However, productivity growth in developing economies, including Indonesia, often depends on energy-intensive production structures and carbon-intensive industrialization (10). While such growth has supported employment and income, it has also increased energy demand and emission intensity (11). Existing policy instruments, including environmental regulations, carbon value mechanisms, and SDG-aligned development strategies, have sought to address these trade-offs (12). However, most empirical studies still examine economic growth, energy use, environmental quality, or labor productivity in isolation (13, 14). As a result, limited attention has been given to how green economy indicators jointly influence labor productivity, particularly in the Indonesian context (15). Consequently, earlier studies have not sufficiently measured how environmental efficiency, lower energy intensity, and economic expansion jointly shape productivity outcomes. This study addresses that limitation by developing an integrated model that links productivity performance with macroeconomic and green economy variables.
The explanatory variables used in this study are theoretically relevant to labor productivity. Labor force size reflects labor availability and potential scale effects, although excessive labor supply may reduce average productivity when not supported by sufficient skills and technology. GDP per capita represents the level of economic development, capital accumulation, and technological progress that can improve worker efficiency. Energy consumption captures the productive role of energy in supporting mechanization, industrial activity, and modern services, although inefficient use may generate environmental costs and diminishing returns (16). Based on these factors, this study examines whether improvements in Indonesia’s green economy indicators after the SDG adoption are associated with higher sectoral labor productivity. It is hypothesized that higher income levels tend to enhance productivity, while labor force size and energy consumption exert significant effects depending on labor quality and energy efficiency conditions. Improved green economy performance is also expected to support productivity growth.
This study provides an integrated assessment of green economy development in Indonesia by focusing on the economic pillar of sustainability and its relationship with labor productivity. It analyzes key indicators such as emission intensity, energy intensity, income per capita, and sectoral productivity trends in agriculture, industry, and services during the post-SDG period. Furthermore, an econometric model is employed to estimate the effects of labor force size, GDP per capita, and energy consumption on labor productivity. By combining descriptive and quantitative approaches, this study contributes by offering a more concise measurement of green economy performance and its linkage to productivity within a sustainability framework. Ultimately, the study aims to provide evidence-based insights for advancing a low-carbon and productivity-driven economic transformation aligned with Indonesia’s SDG commitments.
Methodology
Study Design
This study applies a quantitative time-series design. The analysis consists of descriptive statistical evaluation and econometric estimation. Descriptive analysis examines annual movements of selected green economy indicators. Econometric analysis estimates the relationship between labor productivity and macroeconomic variables using a log-linear regression specification. Given that the dataset consists of only 10 annual observations, the econometric analysis is primarily exploratory, and the results are interpreted as indicative patterns rather than robust generalizable findings.
Data Sources and Sample
The unit of analysis is the Indonesian national economy. The dataset consists of annual observations from 2014 to 2023. All variables are secondary data obtained from official statistical institutions, including the Indonesian Central Bureau of Statistics and sectoral ministries. Only variables with complete observations for the entire study period are included. Monetary variables are converted into constant prices to remove inflation effects. The short time span reflects data availability constraints for consistent post-SDG indicators, but it also limits the statistical power of the analysis.
Variables and Measurement
Labor productivity is measured as real Gross Domestic Product divided by total employment, while the labor force is defined as the total economically active population and Gross Domestic Product per capita is calculated as real GDP divided by total population. Energy consumption is measured as total final energy use, emission intensity is defined as total greenhouse gas emissions divided by real GDP, and final energy intensity is calculated as total final energy consumption divided by real GDP. Sectoral productivity indicators are computed as value added per worker in the agricultural, industrial, and service sectors. The selection of labor force, GDP per capita, and energy consumption is based on economic theory, where labor availability, level of development, and productive energy input are considered key determinants of labor productivity. All variables included in the regression model are transformed into natural logarithmic form to allow elasticity interpretation and to reduce scale variation across series. The regression is formulated as seen in Equation 1, where LP denotes labor productivity, LF denotes labor force, GDPpc denotes GDP per capita, EC denotes energy consumption, and ε denotes the error term.
Estimation Procedure
Data are compiled into a balanced annual time-series dataset and ratio indicators are computed according to their operational definitions, after which stationarity of each variable is tested using the Augmented Dickey–Fuller test and first differencing is applied when non-stationarity at level is detected. In addition, when variables are integrated in the same order, cointegration testing is conducted to examine the existence of a long-run equilibrium relationship among variables. If cointegration is confirmed, an Error Correction Model (ECM) is considered to capture short-run adjustments toward long-run equilibrium. However, the small sample size may reduce the reliability of unit root and cointegration tests, so the results are interpreted with caution. The decision to estimate OLS is therefore based on whether the transformed or level variables satisfy stationarity and cointegration requirements.
The regression model is estimated using the Ordinary Least Squares method, with multicollinearity assessed through the Variance Inflation Factor, heteroskedasticity tested using the Breusch–Pagan test, and autocorrelation evaluated using the Durbin–Watson statistic; when heteroskedasticity is detected, robust standard errors are applied, and all estimations are conducted under the classical linear regression assumptions. Potential endogeneity between GDP per capita and labor productivity is acknowledged, since higher productivity may also contribute to higher income levels. Therefore, coefficient estimates are interpreted as statistical associations rather than strict causal effects. Possible omitted variable bias and structural breaks, including external shocks during the sample period, are recognized as limitations of the model. Overall, the limited number of observations constrains the robustness of statistical inference and reduces confidence in hypothesis testing outcomes.
Data Analysis
Descriptive statistics include mean, standard deviation, minimum, maximum, and annual growth rates, while statistical significance of individual regression coefficients is evaluated using t-statistics, joint significance is assessed using the F-statistic, model explanatory power is measured using the coefficient of determination, and statistical inference is conducted at the 5 percent significance level. Given the small sample, emphasis is placed on coefficient direction, magnitude, and economic interpretation rather than solely on statistical significance. Detailed results of stationarity and diagnostic tests are presented in the Results section.
Results
Demographic and Labor Market Trends
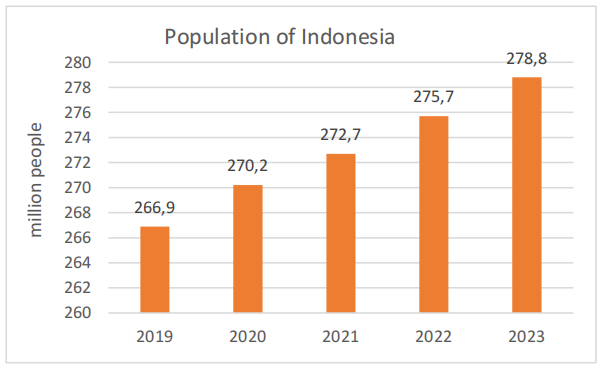
Indonesia’s population increased from 266.9 million in 2019 to 278.8 million in 2023, indicating sustained demographic expansion during the study period. According to the 2020 Population Census, the total population reached 270.2 million, with a relatively balanced gender composition. The working-age population (15–64 years) constitutes the largest demographic segment and continues to expand, contributing to growth in labor supply. The trend in total population over the period 2019–2023 is presented in Figure 1.
Labor market dynamics during the post-pandemic period are summarized in Table 1. The data indicate a consistent increase in the size of the labor force and total employment between 2021 and 2023, accompanied by a decline in open unemployment. These trends reflect an expansion of labor supply alongside improved employment absorption. The reduction in open unemployment suggests gradual stabilization of labor market conditions following the COVID-19 economic shock. These developments provide important context for understanding changes in aggregate labor productivity during the study period.
| Component | 2021 | 2022 | 2023 |
|---|---|---|---|
| Labor Force | 140.15 | 143.73 | 147.71 |
| Employed | 131.05 | 135.30 | 139.85 |
| Open Unemployment | 9.10 | 8.42 | 7.86 |
Economic Development in Indonesia from the Old Order to the Present Era
Indonesia’s long-term economic trajectory has undergone several structural transitions, from early macroeconomic instability in the 1960s, to stabilization and growth during the New Order, recovery after the 1998 crisis, and more recent structural reforms. While these phases are important for historical context, this study focuses primarily on the post-2014 period, which aligns with the SDG framework and the availability of consistent green economy indicators. During the same period, GDP per capita stagnated and exhibited downward pressure, reflecting declining purchasing power and structural imbalances. The macroeconomic conditions during 1962–1966 are illustrated in Figure 2.
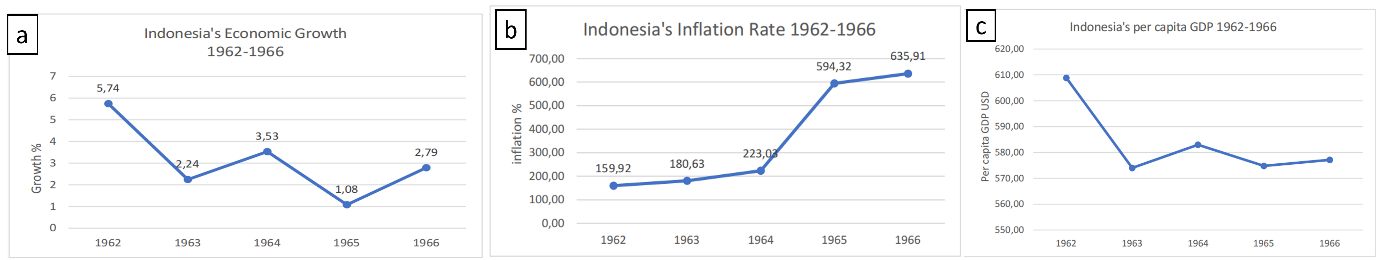
The transition to the New Order under President Soeharto marked a shift toward macroeconomic stabilization and institutional restructuring. Economic policy emphasized inflation control, exchange rate stabilization, fiscal consolidation, and the attraction of foreign investment. Development planning was implemented through multi-year national development programs (REPELITA), with priority given to infrastructure expansion, agricultural intensification, and industrialization. These policy adjustments laid the foundation for subsequent economic recovery and sustained growth in later decades.
Overall, the comparison between the early 1960s and the New Order period highlights a shift from macroeconomic instability to stabilization-oriented policy frameworks. Inflationary pressures and limited income growth marked the early phase, whereas subsequent reforms prioritized macroeconomic discipline and structural development. These transitions form an important historical context for understanding Indonesia’s long-term economic transformation.
Economic Adjustment during the Reform Era (1998–2004)
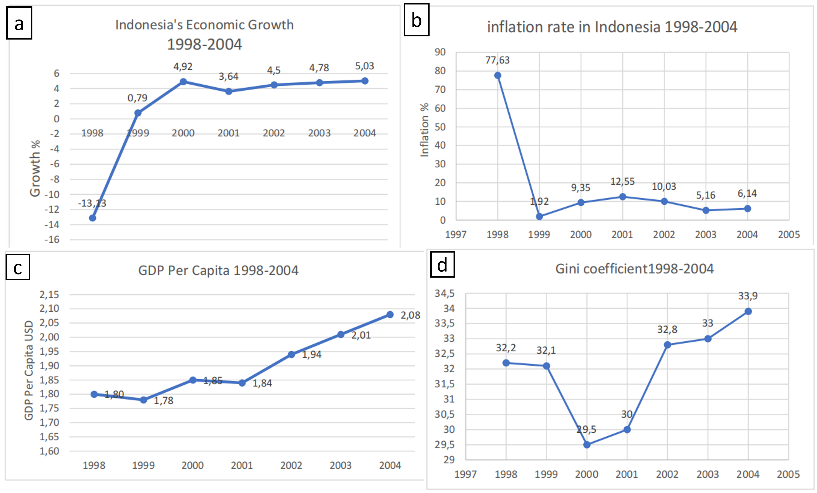
The Reform Era began in the aftermath of the 1997–1998 Asian Financial Crisis, which resulted in a severe economic contraction in 1998, with real GDP declining by 13.13 percent. The crisis was accompanied by sharp currency depreciation, financial sector instability, and a surge in inflation, which reached 77.63 percent in 1998.
Economic recovery commenced in 1999, with GDP growth returning to positive territory at 0.79 percent and accelerating to 4.92 percent in 2000. Between 2001 and 2004, economic growth stabilized within the range of 3.64 to 5.03 percent, indicating gradual macroeconomic normalization. Over the same period, inflation declined substantially from its crisis peak, although temporary increases were observed in 2000–2001.
GDP per capita, which declined during the crisis, gradually recovered between 1999 and 2004, reflecting improved macroeconomic stability. However, income distribution exhibited increasing inequality toward the end of the period, as indicated by the upward movement in the Gini ratio from 29.5 in 2000 to 33.9 in 2004.
The macroeconomic trends during the Reform Era are presented in Figure 3.
Economic Performance during the SBY Administration (2004–2014)
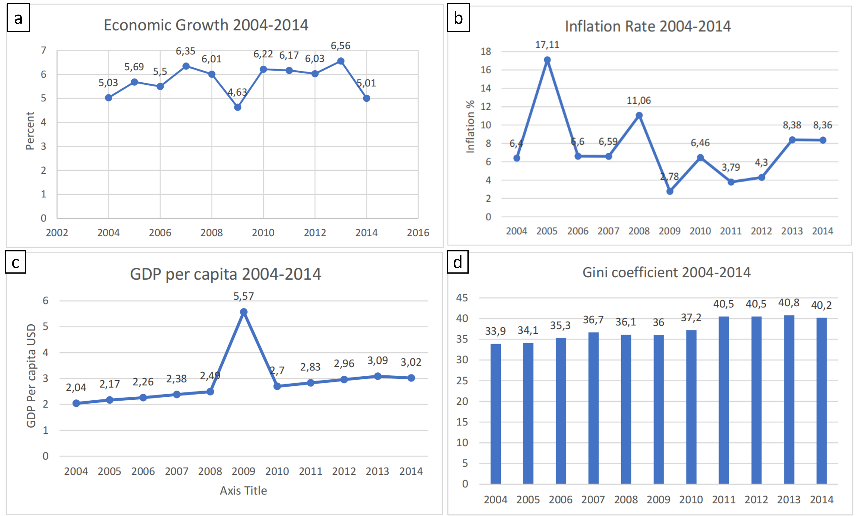
During the administration of President Susilo Bambang Yudhoyono (2004–2014), Indonesia experienced sustained macroeconomic stability and moderate, relatively consistent economic growth. Real GDP growth averaged approximately 5–6 percent annually over the period, with a temporary slowdown to 4.63 percent in 2009 amid the global financial crisis. Growth subsequently recovered and remained above 6 percent in several years before moderating to 5.01 percent in 2014.
Inflation exhibited episodic volatility, notably in 2005 and 2013–2014, largely associated with domestic fuel price adjustments and global commodity price fluctuations. Outside these episodes, inflation remained within a moderate range. GDP per capita increased over the decade, reflecting rising aggregate income levels, although a structural break appears in 2009, likely attributable to methodological revision or currency adjustment.
Despite sustained growth, income inequality increased during this period. The Gini ratio rose from 33.9 in 2004 to a peak of 40.8 in 2013, before slightly declining in 2014. This upward trend indicates widening income dispersion during a period of aggregate economic expansion.
Macroeconomic trends during 2004–2014 are presented in Figure 4.
Economic Dynamics during the Jokowi Administration (2014–Present)
During the administration of President Joko Widodo (2014–present), economic policy has emphasized infrastructure development, regulatory reform, and structural transformation. Public investment in transport infrastructure, logistics networks, and connectivity has been positioned as a key instrument for enhancing productivity and supporting medium-term growth. In parallel, regulatory reforms aimed at improving the investment climate and simplifying business licensing procedures were introduced to stimulate private sector activity.
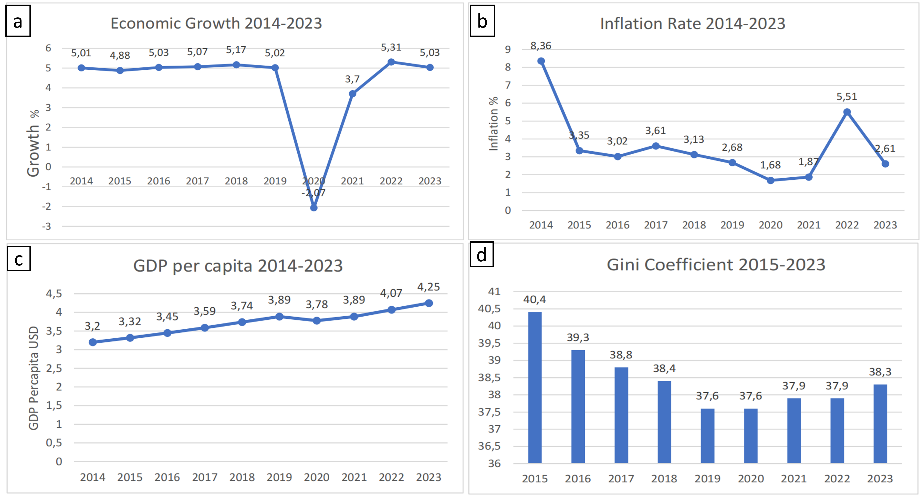
Between 2014 and 2019, real GDP growth remained relatively stable at approximately 5 percent annually. In 2020, the COVID-19 pandemic led to an economic contraction of 2.07 percent, reflecting disruptions in domestic demand, global trade, and supply chains. Economic recovery began in 2021 and accelerated in 2022, with growth returning above 5 percent before stabilizing in 2023.
Inflation remained generally moderate during 2015–2019, declined during the pandemic period due to weakened demand, and temporarily increased in 2022 amid global supply pressures and domestic price adjustments. GDP per capita exhibited a gradual upward trend over the decade, with a temporary slowdown during 2020.
Income inequality, as measured by the Gini ratio, declined between 2015 and 2019, remained relatively stable during the pandemic period, and showed slight fluctuations in subsequent years. Overall, the period is characterized by macroeconomic resilience amid external shocks and structural policy adjustments. Macroeconomic trends during 2014–2023 are presented in Figure 5.
Trends in Green Economy Indicators and Productivity (2014–2023)
During 2014-2023, Indonesia showed gradual progress in several green economy indicators. Emission intensity declined from approximately 5.1 to 4.0, while final energy intensity decreased from 0.43 to 0.34. These trends indicate improving carbon efficiency and more efficient energy use, suggesting an early stage of relative decoupling between economic growth and environmental pressure. Over the same period, Gross National Income (GNI) per capita increased from around USD 3,600 to USD 4,870, despite a temporary contraction during the COVID-19 pandemic in 2020.
Sectoral productivity exhibited heterogeneous patterns. Agricultural productivity fluctuated, reflecting climate variability and structural constraints. Industrial labor productivity declined sharply during the pandemic but recovered in 2021-2022. In contrast, service-sector productivity increased steadily, likely supported by digitalization and the expansion of knowledge-based economic activities (17).
These patterns indicate a gradual shift toward a more service-oriented and efficiency-driven growth structure, which is relevant for interpreting the regression results.
Multiple Linear Regression Results
This study employs Ordinary Least Squares (OLS) to estimate the relationship between labor productivity and selected macroeconomic variables in Indonesia during 2014-2023 (18).
The baseline model included Total Labor Force (JTK), GDP per Capita (PDB_PK), Energy Consumption (KE), and University Graduates (LU). In the initial estimation, none of the explanatory variables were statistically significant at conventional levels.
This lack of significance is likely influenced by the small sample size and multicollinearity, rather than the absence of underlying economic relationships.
Variance Inflation Factor (VIF) testing indicated substantial multicollinearity in the baseline specification (19). To improve model parsimony and coefficient stability under a small-sample framework, the variable University Graduates was excluded in the adjusted model.
This adjustment improves statistical stability but also reduces the model’s ability to capture human capital effects, which should be considered when interpreting the results. The final regression model is expressed in Equation 2. The adjusted model produced an R² value of 0.6249, indicating that approximately 62.49% of the variation in labor productivity is explained by the included regressors.
Interpretation of Estimated Coefficients
Total Labor Force (JTK) has a negative and statistically significant coefficient (p = 0.0216). This indicates that labor force expansion is associated with lower average labor productivity, ceteris paribus (20). A plausible explanation is productivity dilution, where labor growth exceeds the pace of capital deepening, technological upgrading, or skill formation. Additional employment concentrated in low-productivity sectors may also reduce average output per worker.
GDP per Capita (PDB_PK) has a positive and statistically significant coefficient (p = 0.0380). This suggests that higher income levels are associated with stronger labor productivity, potentially reflecting better infrastructure, improved institutions, technological diffusion, and stronger human capital quality (21). GDP per capita may therefore capture broader structural upgrading effects.
Energy Consumption (KE) shows a negative but statistically insignificant coefficient (p = 0.9545) (22). This implies that aggregate energy use was not systematically associated with productivity changes during the observation period. Efficiency improvements, cleaner production processes, and the rising role of less energy-intensive service sectors may weaken the traditional energy-productivity linkage.
Given the limited number of observations, these coefficients should be interpreted as indicative relationships rather than robust statistical evidence.
Model Diagnostics
Classical assumption tests indicate no serious econometric violations in the final specification. VIF values were below the conventional threshold of 10, while heteroskedasticity and autocorrelation tests were statistically insignificant.
Nevertheless, the short time-series dimension (n = 10) requires cautious interpretation, as small samples may reduce estimator precision and statistical power.
Discussion
This study evaluates how selected macroeconomic and green economy-related variables are associated with labor productivity in Indonesia during 2014–2023.
The declining trends in emission intensity and energy intensity suggest that Indonesia has made gradual progress toward more resource-efficient growth (23). These improvements help explain why aggregate energy consumption did not significantly relate to labor productivity in the regression model. As efficiency rises, productivity gains may increasingly come from technology, management quality, and sectoral transformation rather than higher energy input alone (24).
A notable finding is the negative association between labor force size and productivity. This result should not be interpreted mechanically as indicating that more workers reduce productivity. Instead, it may reflect structural imbalances where labor supply grows faster than productive job creation, capital accumulation, or skills upgrading. In such conditions, additional workers may be absorbed into low-value-added or informal activities, thereby lowering average productivity.
The shift from insignificant baseline estimates to significant coefficients in the adjusted model highlights sensitivity to model specification. Under small-sample conditions, multicollinearity can obscure statistical relationships by inflating standard errors. Once overlap among regressors was reduced, coefficient estimates became more stable. Accordingly, the findings should be viewed as conditional associations rather than definitive causal effects.
The positive association between GDP per capita and labor productivity indicates that income growth remains closely linked to structural modernization. Higher income periods are commonly associated with stronger infrastructure provision, technological adoption, better institutions, and improved workforce quality (21). This suggests that productivity growth in Indonesia is more strongly connected to qualitative economic upgrading than to labor quantity expansion.
From a sustainability perspective, the results imply that achieving long-term green growth requires combining environmental efficiency with productivity-enhancing transformation (25). Policies should therefore prioritize human capital development, innovation capability, industrial upgrading, renewable energy adoption, and expansion of high-value service sectors. Overall, the findings consistently point toward the importance of structural transformation and efficiency improvement rather than factor accumulation alone.
Employment expansion alone is unlikely to generate sustainable productivity gains unless accompanied by better skills, capital deepening, and technological progress. Similarly, environmental transition policies will be more effective when integrated with labor market upgrading and inclusive growth strategies (26, 27).
Several limitations should be acknowledged. The study uses a short annual time series, which restricts statistical inference. In addition, important determinants such as capital stock, research and development intensity, institutional quality, and education outcomes were not explicitly included. Future studies should employ longer time horizons, provincial panel data, and dynamic estimation methods to provide more robust evidence.
Overall, the findings suggest that Indonesia is undergoing a gradual transition toward a more efficient and income-driven growth model. However, sustaining this transition will depend on whether productivity growth can be supported by structural upgrading, human capital enhancement, and deeper green economic transformation consistent with the SDGs 2030 agenda.
Conclusion
This study indicates that Indonesia experienced gradual progress toward a green economy transition during 2014–2023, as reflected in declining emission intensity and energy intensity, together with rising income levels and improvements in several sectoral productivity indicators. The econometric results suggest that labor productivity was positively associated with GDP per capita and negatively associated with labor force expansion, while energy consumption did not show a statistically significant relationship within the estimated model. These findings should be interpreted as statistical associations rather than causal relationships. The positive relationship between GDP per capita and labor productivity may indicate the importance of broader structural upgrading, including improvements in infrastructure, technology adoption, and workforce quality, whereas the negative coefficient of labor force expansion may reflect productivity dilution when employment growth is not accompanied by sufficient capital deepening or skill enhancement. However, these conclusions should be interpreted cautiously given several methodological limitations, including the short observation period, small sample size, macro-level data aggregation, possible omitted variables, and potential model sensitivity to specification changes. Accordingly, the results provide indicative rather than definitive evidence regarding the determinants of productivity in Indonesia. From a policy perspective, the findings tentatively suggest that productivity-oriented green growth strategies may be more effective when focused on human capital development, technological upgrading, and resource efficiency rather than relying solely on labor expansion or higher energy use, although stronger policy conclusions require further evidence from longer time-series or panel-data analyses. Overall, the study highlights that Indonesia’s progress toward the SDGs may depend on balancing economic upgrading, productivity improvement, and environmental efficiency within a more inclusive and sustainable development framework.
Declarations
Conflict of Interest
The authors declare no conflicting interest.
Data Availability
All data generated or analyzed during this study are included in this published article.
Ethics Statement
Ethical approval was not required for this study.
Funding Information
The author(s) declare that no financial support was received for the research, authorship, and/or publication of this article.
References
- Petrenko L, Puzko S, Lavrenenko V, Gernego I. Fostering Sustainable Packaging Industry: Global Trends and Challenges. Ejsd. 2024; 13 (2): 63. doi: https://doi. org/10.14207/ejsd.2024.v13n2p63
- GDP and CO2 emissions: Record temperatures heighten urgency to break the link [Internet]. UN Trade and Development (UNCTAD). 2025 [cited 2026 May 13]. Available from: https://unctad. org/news/gdp-and-co2-emissions-record-temperatures-heighten-urgency-break-link
- Tenaw D. Green and traditional productivity growth with natural capital: The role of resource depletion, environmental damages and sectoral composition. Resources Policy. 2025; 103: 105544. doi: https://doi. org/10.1016/j. resourpol.2025.105544
- Fukuda-Parr S. Sustainable Development Goals (SDGs) and the promise of a transformative agenda. London: Routledge; 2023. doi: https://doi. org/10.4324/9781003266365-58
- Yudaruddin R, Hafsari P, Suharsono S, Budiman PW, Purnomo AH, Nugroho BA, et al. Impact of Financial Development on Greenhouse Gas Emissions in Indonesia: A Comprehensive Analysis (2000-2019). Ijeep. 2023; 13 (6): 45-55. doi: https://doi. org/10.32479/ijeep.14931
- Dede Sri Martini, Silvia Sri Wulandari, Ichsan Fauzi Rachman. Prospek dan Tantangan Pendidikan Inklusi di Indonesia dalam Mewujudkan Sustainable Development Goals (SDGs) 2030. Guruku. 2025; 3 (2): 210-218. doi: https://doi. org/10.59061/guruku. v3i2.994
- Gabriella Losa Pongtuluran, Ni Putu Wiwin Setyari. Pengaruh Konsumsi Energi Terbarukan dan Tidak Terbarukan terhadap Emisi Karbon di Indonesia. Jupsim. 2026; 5 (1): 636-652. doi: https://doi. org/10.55606/jupsim. v5i1.6358
- Khan RZ, Razak LA, Premaratne G. Green growth and sustainability: A systematic literature review on theories, measures and future directions. Cleaner and Responsible Consumption. 2025; 17: 100274. doi: https://doi. org/10.1016/j. clrc.2025.100274
- Surya Putra W, Budiasih. Determinants of Economic Growth and Labor Productivity in Indonesia. edaj. 2024; 13 (3): 366-383. doi: https://doi. org/10.15294/edaj. v13i3.5110
- Gunarto T, Hadiyati S, Hudani MM, Ciptawaty U, Afif FY. Growth, Industrial Structure, and Carbon Emissions in ASEAN: A Panel Data Analysis. Jrie. 2025; 5 (3): 173-189. doi: https://doi. org/10.23969/jrie. v5i3.342
- Adrian MA. Analisis Pengaruh Aktivitas Ekonomi terhadap Peningkatan Emisi Karbon: Studi Empiris Empat Negara ASEAN. Jei. 2024; 12 (2): 187-202. doi: https://doi. org/10.52813/jei. v12i2.379
- Tamasiga P, Onyeaka H, Bakwena M, Ouassou EH. Pricing the future: unveiling the effects of carbon pricing on socio-economic outcomes and energy poverty. International Journal of Sustainable Energy. 2024; 43 (1): 2362334. doi: https://doi. org/10.1080/14786451.2024.2362334
- Purnama H, Gunarto T, Budiarty I. Effects of energy consumption, economic growth and urbanization on indonesian environmental quality. Ijeep. 2020; 10 (6): 580-587. doi: https://doi. org/10.32479/ijeep.10586
- Setiawati RIS, Imamah F. Government Strategy in Addressing the Impact of Economic Growth and Energy Consumption on Environmental Degradation. jasf. 2024; 6 (2): 343-363. doi: https://doi. org/10.33005/jasf. v6i2.495
- Wijayanti YR, Sari IC. Reinvigorating Sustainable Green Economics in Indonesia: Exploring the Nexus between Global Green Economy Index and SDG 8. JISDeP. 2024; 5 (3): 203-216. doi: https://doi. org/10.46456/jisdep. v5i3.612
- Wang CN, Nguyen TTV, Chiang CC, Le HD. Evaluating renewable energy consumption efficiency and impact factors in Asia-pacific economic cooperation countries: A new approach of DEA with undesirable output model. Renewable Energy. 2024; 227: 120586. doi: https://doi. org/10.1016/j. renene.2024.120586
- Lubis DA. Produktivitas Tenaga Kerja Pertanian dan Industri Pengolahan: Lesson Learned Pandemi Covid-19. j. manaj. STIE. Muhammadiyah. Palopo. 2021; 7 (2): 45. doi: https://doi. org/10.35906/jurman. v7i2.892
- Maulana M. Determinan Produktivitas Tenaga Kerja di Indonesia. Pedr. 2024; 2 (1): 1-15. doi: https://doi. org/10.26593/pedr. v2i1.7366
- Anwar K, Goejantoro R, Prangga S. Pengelompokan Kabupaten/Kota Di Pulau Kalimantan Berdasarkan Indikator Indeks Pembangunan Manusia Tahun 2020 Menggunakan Optimasi K-Means Cluster Dengan Principle Component Analysis (PCA). J. Eksponensial. 2022; 13 (2): 131. doi: https://doi. org/10.30872/eksponensial. v13i2.1053
- Lestari I, Solihah N, Fina Audilla Y, Nilasari A. Pengaruh jumlah penduduk, pendidikan, dan upah terhadap pengangguran terbuka di jawa timur. Indep. : J. Econ. 2024; 4 (2): 140-148. doi: https://doi. org/10.26740/independent. v4i2.65037
- Maulana M. Determinan Produktivitas Tenaga Kerja di Indonesia. Pedr. 2024; 2 (1): 1-15. doi: https://doi. org/10.26593/pedr. v2i1.7366
- Montalbano P, Nenci S, Vurchio D. Energy Efficiency and Productivity: A Worldwide Firm-level Analysis. The Energy Journal. 2022; 43 (5): 93-116. doi: https://doi. org/10.5547/01956574.43.5.pmon
- Zhong S, Su B, He J, Ng TS. Moving towards a net-zero emissions economy in Indonesia. Science of The Total Environment. 2025; 1001: 180542. doi: https://doi. org/10.1016/j. scitotenv.2025.180542
- Thawley C, Crystallin M, Verico K. Towards a Higher Growth Path for Indonesia. Bulletin of Indonesian Economic Studies. 2024; 60 (3): 247-282. doi: https://doi. org/10.1080/00074918.2024.2432035
- Firdiana Nur Auliya, Nurhadi Nurhadi. Menuju Ekonomi Hijau Yang Berkelanjutan: Tantangan Dan Peluang Untuk Stabilitas Lingkungan Dan Ekonomi Jangka Panjang. Pengabmas. 2023; 5 (2): 97-102. doi: https://doi. org/10.57214/pengabmas. v5i2.304
- Ningsih SR. Pengaruh Teknologi Terhadap Produktivitas Tenaga Kerja di Indonesia. Benefit. 2024; 2 (1): 1-9. doi: https://doi. org/10.70437/benefit. v2i1.341
- Handoko S, Sakti SA, Purwanti AR. Dampak Pelatihan dan Penggunaan Teknologi Digital terhadap Motivasi Kerja dan Produktivitas Kerja Generasi Z Karyawan Perusahaan Swasta di Yogyakarta. Akmenika. 2025; 22 (1): 1089-1104. doi: https://doi. org/10.31316/akmenika. v22i1.7789