
RESEARCH ARTICLE
Detection of Porcine Gelatin in Jelly Soft Candies Using Near-Infrared Spectroscopy and Chemometrics
Academic Editor: Putri Widyanti Harlina
Halal Science|Vol. 1, Issue 1, pp. 1-6 (2025)
Views
Downloads
Shares
Received
May 3, 2025Revised
Jun 4, 2025Accepted
Jun 15, 2025Published
Jun 18, 2025
Abstract
Introduction
Gelatin is a water-soluble polypeptide obtained from the partial hydrolysis of collagen, a structural protein found in animal skin, bones, and connective tissue (1). It is widely used in the food and pharmaceutical industries for its gelling, stabilizing, and texturizing properties (2-5). Most gelatin is derived from porcine skin (6, 7). In Indonesia, a significant portion of gelatin, including porcine-based gelatin, is imported from Europe and the United States. While Indonesia does not produce its gelatin, it relies on imports to meet its needs, with roughly 4800 tons imported annually (8). This raises significant concerns for Muslim consumers, as Islamic dietary laws strictly prohibit ingredients derived from pigs (9). Ensuring the halal status of gelatin-containing food products is essential for religious observance and public trust, consumer protection, and regulatory compliance (10, 11). However, detecting porcine gelatin, especially in processed foods like jelly soft candy, presents a major analytical challenge due to its chemical similarity to other animal-based gelatins (12).
Jelly soft candy is a chewy confectionery made using hydrocolloids such as gelatin, agar, pectin, starch, and carrageenan (13-15). These ingredients are processed, aged, and molded before packaging, making identifying gelatin sources critical for halal assurance. Several analytical methods have been developed to authenticate gelatin sources, including reversed-phase high-performance liquid chromatography (RP-HPLC), HPLC with mass spectrometry, and chemometric-enhanced HPLC (16). Although sensitive, these techniques are time-consuming, destructive, and require complex sample preparation. To date, no published research has applied near-infrared (NIR) spectroscopy for detecting porcine gelatin in jelly soft candy.
This study proposes a novel, rapid, and non-destructive method for porcine gelatin detection using NIR spectroscopy combined with chemometric analysis. NIR spectroscopy offers key advantages, such as minimal sample preparation, fast analysis, and low reagent usage. Coupled with chemometric techniques like Partial Least Squares (PLS) regression and Linear Discriminant Analysis (LDA), this approach allows for both qualitative classification and quantitative estimation of porcine gelatin content. These multivariate methods enhance selectivity by reducing interference from other spectral components, making them suitable for complex food matrices. This study introduces a practical tool for routine halal verification and regulatory enforcement in the food industry by addressing gaps in current detection techniques.
Experimental Section
Materials
The materials utilized in this study included bovine gelatin (food grade, Brataco Chemical, Indonesia), porcine gelatin (Type A, Sigma-Aldrich, Merck KGaA, Germany), sucrose (food grade, Gulaku, Indonesia), glucose syrup (food grade, DKSH, Indonesia), citric acid (analytical grade, Merck, Germany), distilled water (produced in-house, laboratory-grade), and commercially available jelly soft candy samples (various brands, Indonesia).
The instrumentation comprised a near-infrared (NIR) spectrophotometer (Bruker Alpha II, Bruker Optik GmbH, Germany) with OPUS software for spectral acquisition. Chemometric analysis was performed using The Unscrambler X version 10.2 (CAMO Software AS, Norway). Additional equipment included Xematest Pork Detection Strips (Product No. X.366.2, Xema Co. Ltd., Ukraine), an analytical balance (Precisa 360 ES Series, Precisa Gravimetrics AG, Switzerland), refrigeration units (Polytron, Indonesia) for sample storage, and standard laboratory glassware (Pyrex, Corning Inc., USA).
Procedure
Sample Preparation
Jelly soft candy standards were prepared using a standardized formulation to ensure consistency and reproducibility. Each batch (± 3 g) consisted of 10% gelatin (either bovine or porcine), 20% glucose syrup, 40% sucrose, 0.5% citric acid, 0.1% flavoring, 0.01% coloring, and distilled water to make up 100% by weight. All ingredients were accurately weighed using an analytical balance. Gelatin was first dissolved in hot distilled water at 60–70 °C under continuous stirring. Sucrose, glucose syrup, citric acid, flavoring, and coloring agents were then sequentially added. The mixture was heated to 90–100 °C until fully homogenized and poured into silicone molds. The molded samples were set at room temperature for 30 min and refrigerated until a firm, chewy texture was achieved. Sample thickness was standardized to ± 0.25 cm for NIR analysis. Three types of samples were prepared: (1) bovine gelatin-only (0% porcine), (2) porcine gelatin-only (100% porcine), and (3) mixtures containing both bovine and porcine gelatin in known proportions (10% to 90% porcine in 10% increments).
Sample Designation and Dataset Division
Samples were divided into a training set and a test set. The training set comprised 10 bovine gelatin samples (0% porcine) and 10 mixed samples with porcine gelatin concentrations ranging from 10% to 100% in 10% increments (n = 1 per level). The test set consisted of five independently prepared samples: one pure bovine (0%), one pure porcine (100%), and three mixed samples (10%, 50%, and 70% porcine). This design provided a controlled baseline (bovine-only), a positive control (porcine-only), and intermediate concentrations to evaluate the robustness and predictive capability of the classification and quantification models. All samples were prepared following identical procedures to ensure consistency.
NIR Spectroscopy Acquisition
Spectral data were acquired using a Bruker Alpha NIR spectrometer (Bruker Optik GmbH, Germany) equipped with an integrating sphere and a halogen light source. Each jelly sample was placed directly on the sample holder, ensuring full coverage of the sampling window. Spectra were recorded in diffuse reflectance mode over a spectral range of 4000–700 cm⁻¹, with a resolution of 4 cm⁻¹ and 32 scans per sample to improve signal-to-noise ratio. Background spectra were collected before each measurement session to correct for instrument and environmental variations.
Two spectral datasets were generated: Dataset 1 comprised the full spectral range (4000–700 cm⁻¹) for initial exploratory analysis and model development. Dataset 2 consisted of spectra within a selected window (1660–1200 cm⁻¹), recommended by a previous study (17), targeting functional group absorptions characteristic of amide I and II bands, which provide greater discriminatory power between porcine and bovine gelatin. Prior to chemometric analysis, all spectral data were processed using OPUS software (Bruker Optik GmbH, Germany).
Chemometric Modeling
Chemometric analysis was performed using The Unscrambler X version 10.2 (CAMO Software AS, Norway). Spectral preprocessing included baseline correction, standard normal variate (SNV) normalization, and second derivative transformation (Savitzky–Golay, 15-point window, 2nd-order polynomial) to reduce noise and correct for light scattering effects.
Two classification models were developed: Partial Least Squares Discriminant Analysis (PLS-DA) and Linear Discriminant Analysis (LDA). Model performance was evaluated using cross-validation with a leave-one-out (LOO) approach within the training dataset to prevent overfitting. Model quality for PLS-DA was assessed based on the coefficient of determination for calibration (R²cal), coefficient of determination for validation (R²val), root mean square error of calibration (RMSEC), and root mean square error of prediction (RMSEP). For LDA, classification performance was evaluated using recognition ability (the percentage of correctly classified samples in the training set) and prediction ability (the percentage of correctly classified samples in the independent test set).
The optimal model was selected based on the highest combined recognition and prediction accuracy, with an ideal model achieving values approaching 100%. Final model selection prioritized the classification model that demonstrated superior performance in distinguishing between bovine and porcine gelatin-containing jelly samples, supported by internal cross-validation and independent external validation.
Control and Validation Method
Control samples included pure bovine gelatin (0% porcine) and pure porcine gelatin (100% porcine) formulations, serving as negative and positive controls, respectively. These controls ensured that the classification models were based on genuine spectral differences rather than sample variability. To validate the NIR-chemometric predictions, results were compared with a qualitative immunochromatographic assay using Xematest Pork Detection Strips (Product No. X.366.2, Xema Co. Ltd. , Ukraine). Testing followed the manufacturer’s protocol, involving the immersion of the strip into an aqueous extract of each jelly sample, with a visual interpretation of results within 10 min.
Market Sample Testing
To evaluate the applicability of the developed method, commercial jelly soft candy samples were collected from local supermarkets in Jember City, including Golden Market, Carrefour, and Roxy Mall, using a total sampling approach. All market samples were analyzed under the same NIR acquisition conditions and processed using the optimal chemometric model established during model development. The results were further validated using the Xematest Pork Detection Kit to confirm external predictive accuracy.
Results
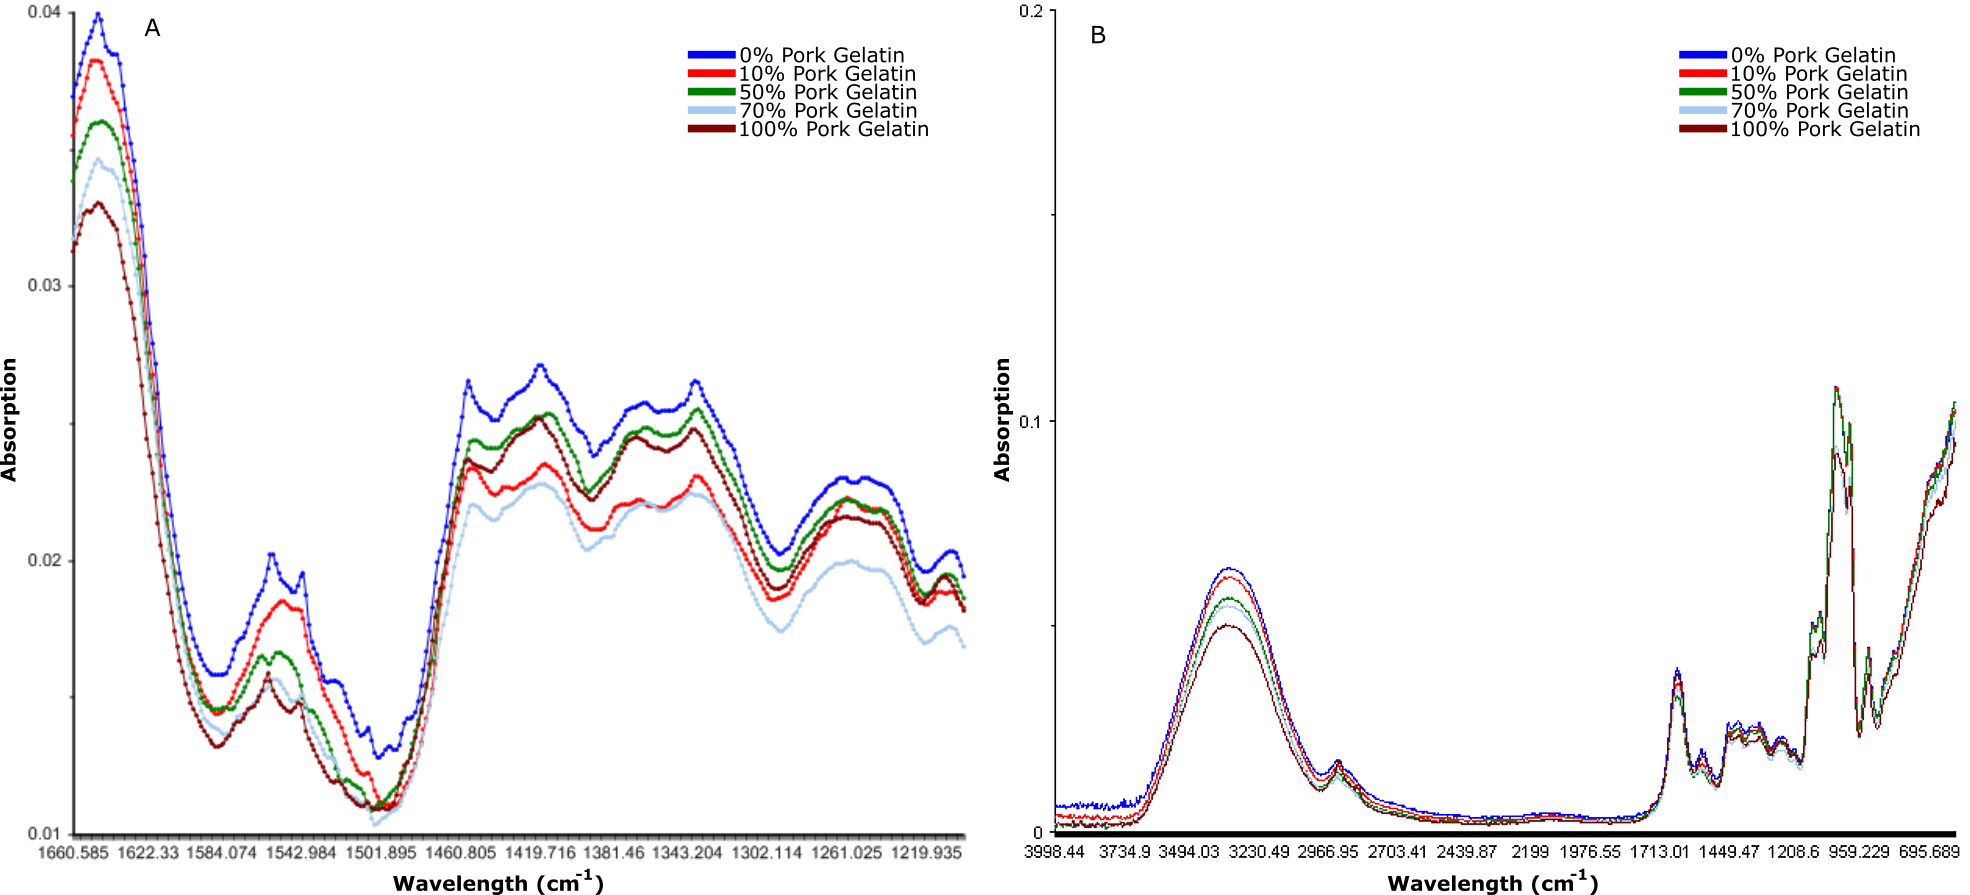
Standardized jelly soft candy samples were scanned using NIR spectroscopy and divided into two datasets for analysis. Dataset 1 covered the full spectral range (4000–700 cm⁻¹), while Dataset 2 focused on the targeted fingerprint region (1660–1200 cm⁻¹) based on known discriminatory bands for porcine and bovine gelatin as shown in Figure 1 (25).
Among the models evaluated, the Linear Discriminant Analysis (LDA) applied to Dataset 1 yielded the best classification performance, with a recognition ability of 90% and a prediction ability of 100%. Dataset 2, focused on the amide region, provided slightly improved internal classification with a recognition ability of 96% and prediction ability of 100%, as shown in Table 1. These results indicate that the chemometric models, especially LDA, demonstrated high discriminatory power for detecting porcine gelatin content in jelly matrices with minimal misclassification.
| Data Set | LDA | |
|---|---|---|
| % Recognition | % Prediction | |
| 1 | 90% | 100% |
| 2 | 96% | 100% |
The performance of the chemometric models was further assessed through visual analysis of calibration and classification plots. Figure 2A illustrates the model characteristics for the training set, including the Partial Least Squares (PLS) regression model displaying R² values for calibration and validation and the Linear Discriminant Analysis (LDA) model showing classification accuracy. The PLS model achieved an R²cal of 0.982 and R²val of 0.980, indicating a strong correlation between predicted and actual values. The LDA model exhibited a classification accuracy of 100% on the training data, confirming the model’s ability to distinguish between samples containing bovine and porcine gelatin reliably.
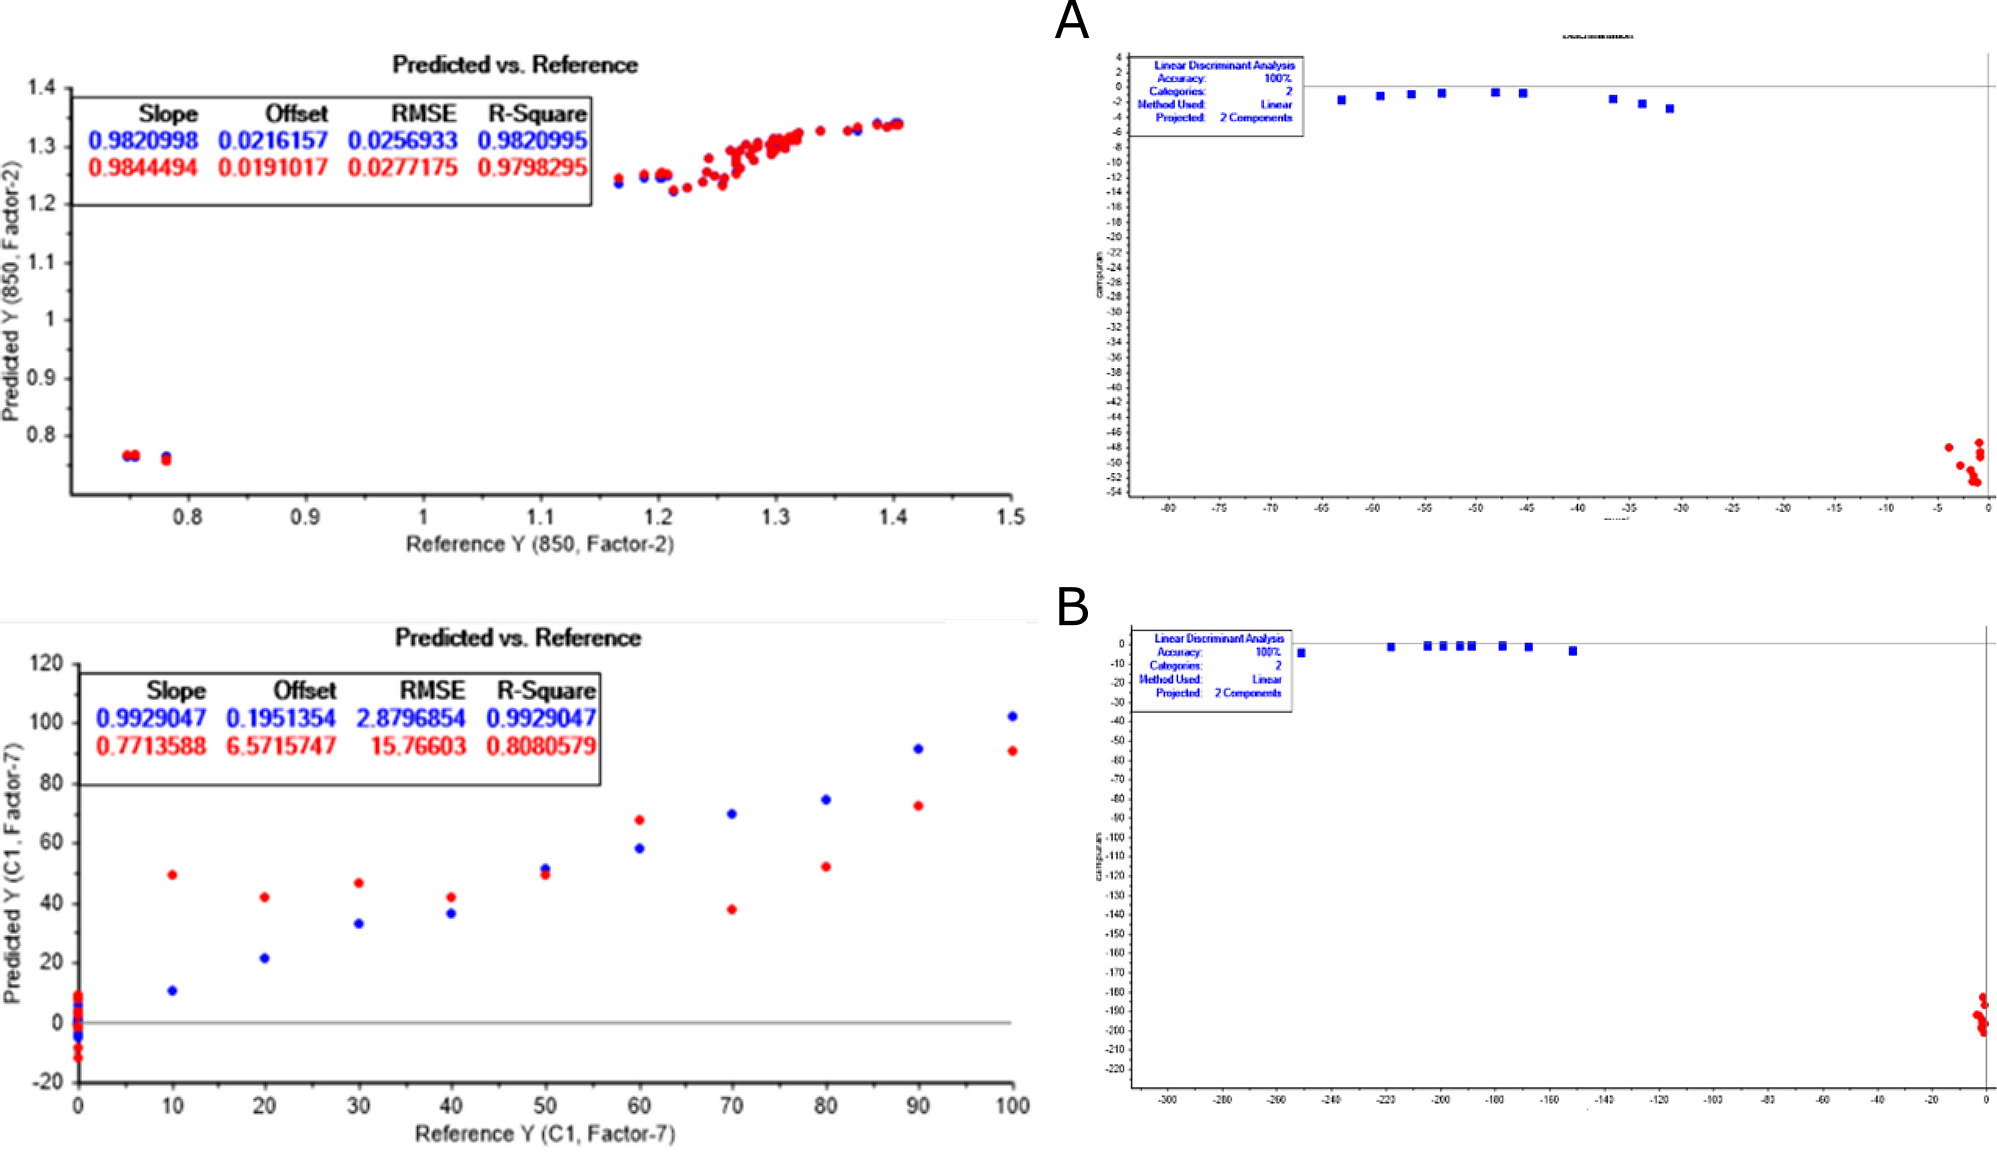
Figure 2B presents the performance metrics for the test set, with similar visualizations for PLS regression and LDA classification. The PLS model for the test data showed R² values of 0.992, supporting its generalization capability. Meanwhile, the LDA model achieved an accuracy of 100% in predicting test samples, consistent with results observed in the training phase. These visualizations reinforce the robustness and predictive reliability of the selected chemometric approach, particularly when using the LDA classification model.
Based on the Linear Discriminant Analysis data, the %recognition and %prediction values of each model formed are obtained, namely Data Set 1 and Data Set 2, as shown in Table 1.
Regarding spectral interpretation, key absorption bands within the 1660–1200 cm⁻¹ region contributed significantly to class separation. These include peaks around ~1650 cm⁻¹ (amide I, C=O stretching) and ~1540 cm⁻¹ (amide II, N-H bending and C-N stretching), which are known to differ subtly in intensity and position between porcine and bovine gelatin due to variations in their protein structures and amino acid composition.
Five commercial jelly soft candy samples (labeled A–E) were analyzed to validate the classification model's performance. These samples were obtained via total sampling from various supermarkets in Jember City. The optimized NIR-LDA model predicted all five commercial samples as negative for porcine gelatin. These predictions were cross-validated using the Xematest Pork immunochromatographic strip test, which also returned negative results for all samples. The congruence between NIR-chemometric predictions and the Xematest Pork results supports the reliability and applicability of the proposed method for routine halal verification.
Discussion
This study demonstrates the successful application of Near-Infrared (NIR) spectroscopy combined with chemometric analysis to discriminate between bovine and porcine gelatin in jelly soft candies. The spectral data were divided into two sets: the full spectral range (4000–700 cm⁻¹) and a targeted fingerprint region (1660–1200 cm⁻¹), which, according to literature, effectively captures differences in protein and peptide bond absorption, critical for distinguishing gelatin sources.
The spectra obtained aligned with theoretical expectations. Specifically, the 3600–3200 cm⁻¹ region showed lower intensity for porcine gelatin, which can be attributed to its higher moisture content (18). This is consistent with previous studies where water content influenced O-H absorption intensity. The 1660–1200 cm⁻¹ region, representing amide I and II bands, showed notable variance between the two gelatin types, likely due to compositional differences in amino acids.
The training set spectra generated for each data set are used to form calibration and classification models. The formation of classification models using PLS is displayed in the form of regression values. The purpose of using the PLS model is to reduce the impact of the number of predictors irrelevant to the diversity of the data to estimate the predictor error to improve the model's ability (19).
The PLS results obtained R-squared and RMSE values, where the R-squared value shows how close the relationship between the real or reality value and the predicted value of the instrument used (20). According to international harmonization, if the R-Square value is closer to 1, the expected relationship of the model will be better. The RMSE (Root Mean Square Error) value is the error value in the model. The smaller the RMSE value, the better the model. The R-square value obtained in both data is good because it is close to 1, but the RMSE value is still high.
The training set spectrum of each dataset is then classified using PLS and LDA chemometric classification models. It uses two categories: pure jelly soft candy and mixed jelly soft candy. The pure jelly soft candy category is intended to indicate the halalness of jelly soft candy, whereas jelly soft candy in this category is predicted to contain only cow gelatin. In contrast, the mixed jelly soft candy category indicates suspicion of the halalness of jelly soft candy, where jelly soft candy may contain a mixture of pork gelatin. The discrimination is displayed in the form of mapping or prediction tables. In general, the relationship between absorbance value and the number of compounds is linear; the higher the absorbance value, the higher the compound levels (21). Likewise, the wavelengths used in measurements also affect the relationship between absorbance values and the number of compounds.
Longer wavelengths will have higher absorbance values (22). Subsequently, a classification model was established utilizing the training set data. The spectra derived from each dataset within the training set were employed to formulate a chemometric classification model, specifically employing Linear Discriminant Analysis (LDA). LDA hinges on the dataset’s capacity to effectively categorize or discriminate one class from another, with a higher degree of precision indicative of superior dataset performance (23). Two distinct datasets were delineated based on the dataset's spectra. The accuracy and effectiveness of the LDA can be measured using the cross-validation method, which can determine how well the LDA can predict a group. The prediction effectiveness can be measured using the mean square error to determine how well the LDA identifies unknown values (24). Consequently, a systematic evaluation was conducted to discern the most optimal model that establishes a meaningful association between categories and discriminants. The results, in the form of mapping, present a distinct segregation between the categories of spectra in the dataset.
Subsequently, testing was conducted to assess the model’s ability to distinguish between the two types of material, as evident in the recognition capability values for samples in the training set and the predictive ability of LDA for samples in the test set. It was found that the LDA model of data set 1 resulted in RMSEC and RMSEP values of 0.0257 (R2cal = 0.98) and 0.0277 (R2val = 0.97), respectively. Meanwhile, the LDA model of data set 2 resulted in RMSEC and RMSEP values of 2.87 (R2cal = 0.9931) and 0.0124 (R2val = 0.9919), respectively. LDA, RMSEC, and RMSEP values are parameters used to evaluate the performance of LDA models. LDA values indicate the ability of the LDA model to discriminate between clusters. In contrast, RMSEC and RMSEP show the average error between the prediction and actual values for calibration and prediction data. When RMSEC values are lower than RMSEP, then LDA models are better at predicting values for calibration data than predictive data. Whereas if RMSEC is higher than RMSEP, then LDA models are better at predicting values of prediction data than calibration data (25).
Compared to conventional methods like PCR or ELISA, which require extensive sample preparation, reagents, and longer analysis time, the NIR-chemometric approach offers significant advantages in speed, non-destructiveness, and minimal reagent use (26). While ELISA can detect very low levels of porcine DNA, it does not perform well with highly processed or hydrolyzed samples where DNA may degrade (27). Conversely, NIR focuses on functional group vibrations, enabling better performance in complex matrices like candy (28).
Nonetheless, this study is not without limitations. The diversity of samples was restricted to those available in one region (Jember City), and the models were only tested against porcine and bovine gelatin. Spectral overlap with other animal-derived gelatin sources (e.g., fish, chicken) was not evaluated (29). Future work should explore the model's generalizability across broader gelatin sources and food products.
In terms of practical implications, this method can be seamlessly integrated into quality assurance workflows within the food industry. Its speed and simplicity make it suitable for high-throughput screening, particularly in halal certification and food fraud prevention. Given the affordability of NIR instruments and the increasingly user-friendly chemometric software, this technique is also scalable and economically feasible for regulatory agencies and manufacturers in developing regions.
Finally, the validation of our model using Xematest Pork, yielding consistent negative results across both methods, reinforces the reliability of the NIR-chemometric approach in real-world applications. This convergence of results underscores the method's potential as a frontline tool in halal verification and food integrity testing.
Conclusion
This study showed that Near-Infrared (NIR) spectroscopy combined with chemometric analysis is reliable for detecting porcine gelatin in jelly soft candy. All five market samples tested from Jember Regency were confirmed free of porcine gelatin, consistent with the Xematest Pork assay results. The models demonstrated high accuracy, proving the method’s potential for halal verification. This approach offers a fast, non-destructive, and practical solution for routine quality control. Further research should apply this method to a wider range of food products to strengthen its use in halal authentication.
Abbreviations
SNI = Indonesian national standard; HPLC = High Performance Liquid Chromatography; NIR = Near Infrared Spectroscopy; PLS = Partial Least Square; LDA= Linear Discriminant Analysis; RMSE = Root Mean Square Error.
Declarations
Acknowledgment
Thank you for all the suggestions and feedback that reviewers have given to our manuscripts. Hopefully what we are working on can benefit society, nation and religion.
Conflict of Interest
The authors declare no conflicting interest.
Data Availability
The unpublished data is available upon request to the corresponding author.
Ethics Statement
Not applicable.
Funding Information
The author(s) declare that no financial support was received for the research, authorship, and/or publication of this article.
References
- Dille MJ, Haug IJ, Draget KI. Gelatin and collagen. In: Handbook of Hydrocolloids. Elsevier; 2021. p. 1073–97.
- Bagal‐Kestwal DR, Pan MH, Chiang B. Properties and Applications of Gelatin, Pectin, and Carrageenan Gels. In: Bio Monomers for Green Polymeric Composite Materials. Wiley; 2019. p. 117–40.
- Zhang W, Li M, Chen J, Chen Y, Liu C, Wu X. A Review of Modified Gelatin: Physicochemical Properties, Modification Methods, and Applications in the Food Field. J Agric Food Chem. 2024 Sep 25;72(38):20705–21.
- Rather JA, Akhter N, Ashraf QS, Mir SA, Makroo HA, Majid D, et al. A comprehensive review on gelatin: Understanding impact of the sources, extraction methods, and modifications on potential packaging applications. Food Packag Shelf Life. 2022 Dec;34:100945.
- Alipal J, Mohd Pu’ad NAS, Lee TC, Nayan NHM, Sahari N, Basri H, et al. A review of gelatin: Properties, sources, process, applications, and commercialisation. Mater Today Proc. 2021;42:240–50.
- Uddin SMK, Hossain MAM, Sagadevan S, Al Amin M, Johan MR. Halal and Kosher gelatin: Applications as well as detection approaches with challenges and prospects. Food Biosci. 2021 Dec;44:101422.
- Hammam Nawwaruddin H’, Rohman A, Laksitorini MD. Porcine-Derived Ingredients in Cosmetic Products and its Halal Authentication Method within Complex Matrices [Internet]. Vol. 2024, J.Food Pharm.Sci.
- Setyabudi L, Pambudi AW, Gunawan S. Study of the Potential and Critical Point Milkfish Bone-Based Gelatin as an Alternative to Substitute Non-halal Gelatin. Vol. 4, Halal Research. 2024.
- Samsudin N, Elgharbawy AAM, Abualsunun WA. Using Halal Gelatin and Gelatinous Substitutes in Pharmaceutical Preparations. In: Solving Halal Industry Issues Through Research in Halal Sciences. Singapore: Springer Nature Singapore; 2024. p. 195–213.
- Hamonangan J, Sakti M. The Consumer Protection Efforts through the Inclusion of Non-Halal Information on Food Products. Law Development Journal. 2024 Jun 3;6(2):252.
- Hermawan A. Consumer Protection Perception of Halal Food Products in Indonesia. KnE Social Sciences. 2020;
- Abdullah Amqizal HI, Al-Kahtani HA, Ismail EA, Hayat K, Jaswir I. Identification and verification of porcine DNA in commercial gelatin and gelatin containing processed foods. Food Control. 2017 Aug;78:297–303.
- Soedirga LC, Marchellin M. Physicochemical Properties of Jelly Candy Made with Pectin from Red Dragon Fruit Peel in Combination with Carrageenan. Caraka Tani: Journal of Sustainable Agriculture. 2021;37(1).
- He H, Bian H, Xie F, Chen L. Different effects of pectin and κ-carrageenan on the multiscale structures and in vitro digestibility of extruded rice starch. Food Hydrocoll. 2021;111.
- Wulan N, Vega ZA, Putra FS, Hutami R. Kajian Gelatin sebagai Bahan Tambahan Pangan Pembentuk Gel (Gelling Agent) dalam Produk Permen Soft Candy atau Jelly Candy. Karimah Tauhid. 2024;3(11).
- Hameed AM, Asiyanbi-H T, Idris M, Fadzillah N, Mirghani MES. A Review of Gelatin Source Authentication Methods. Trop Life Sci Res. 2018;29(2):213–27.
- Jannat B, Ghorbani K, Shafieyan H, Kouchaki S, Behfar A, Sadeghi N, et al. Gelatin speciation using real-time PCR and analysis of mass spectrometry-based proteomics datasets. Food Control. 2018 May;87:79–87.
- Gelatin Manufacturers Institute of America. Gelatin Handbook [Internet]. Vol. 563, US Customer Service.
- Syukron Amin M. Pengkajian metode Near Infrared (NIR) untuk evaluasi mutu pakan ayam broiler secara cepat dan akurat.
- Yilmaz MT, Kesmen Z, Baykal B, Sagdic O, Kacar O, Yetim H, et al. A novel method to differentiate bovine and porcine gelatins in food products: NanoUPLC-ESI-Q-TOF-MSE based data independent acquisition technique to detect marker peptides in gelatin. Food Chem. 2013;141(3):2450–8.
- Che Man YB, Mirghani MES. Detection of lard mixed with body fats of chicken, lamb, and cow by Fourier Transform Infrared Spectroscopy. JAOCS, Journal of the American Oil Chemists’ Society. 2001;78(7):753–61.
- Brereton RG, Jansen J, Lopes J, Marini F, Pomerantsev A, Rodionova O, et al. Chemometrics in analytical chemistry—part II: modeling, validation, and applications. Anal Bioanal Chem. 2018 Oct 1;410(26):6691–704.
- Sima IA, Andrási M, Sârbu C. Chemometric assessment of chromatographic methods for herbal medicines authentication and fingerprinting. J Chromatogr Sci. 2018 Jan 1;56(1):49–55.
- Zhang H, Sun H, Wang L, Wang S, Zhang W, Hu J. Near Infrared Spectroscopy Based on Supervised Pattern Recognition Methods for Rapid Identification of Adulterated Edible Gelatin. Journal of Spectroscopy. 2018;2018.
- Amat-Ur-rasool H, Symes F, Tooth D, Schaffert LN, Elmorsy E, Ahmed M, et al. Potential nutraceutical properties of leaves from several commonly cultivated plants. Biomolecules. 2020 Nov 1;10(11):1–22.
- Alhajj M, Zubair M, Farhana A. Enzyme Linked Immunosorbent Assay. StatPearls. 2025.
- Muflihah, Hardianto A, Kusumaningtyas P, Prabowo S, Hartati YW. DNA-based detection of pork content in food. Vol. 9, Heliyon. Elsevier Ltd; 2023.
- Zheng R, Kamruzzaman M. Near-infrared spectroscopy for microalgae studies: A comprehensive review of applications and outlooks. Vol. 89, Algal Research. Elsevier B.V.; 2025.
- Grace PA, Nurali EJN, Assa JR, Program M, Teknologi S, Unsrat P, et al. Pengaruh Konsentrasi Gelatin dan Sukrosa Terhadap Kualitas Fisik, Kimia dan Sensoris Permen Jelly Tomat (Lycopersicum esculentum Mill). Jurnal Teknologi Pertanian. 2021; 12(2):80-88.