RESEARCH ARTICLE
Effect of Combination of Porang and Moringa Flour on Blood Glucose Levels and Body Weight in Rats
Academic Editor: Pilli Govindaiah
Sciences of Pharmacy|Vol. 3, Issue 2, pp. 70-76 (2024)
CC BY 4.0-2024 Authors
Views
Downloads
Shares
Received
Jan 24, 2024Revised
Mar 16, 2024Accepted
Mar 18, 2024Published
Apr 2, 2024
Abstract
Porang tuber is rich in fiber and low in calories of carbohydrates. Moringa oleifera leaf has a high protein and a low content of lipids. Obesity and diabetes mellitus are the risk factors of cardiovascular disease, also known as cardiovascular disease risk factors. Combining of porang and moringa as feed can increase nutrition without causing weight gain. This study aims to determine these two materials as antidiabetic and antiobesity agents. The samples are porang tuber, a combination of porang tuber and M. oleifera leaves, a combination of M. oleifera leaves and wheat flour, wheat flour, and standard feed of mice. The parameters tested in this study are analysis of macronutrients of feed, loss of weight of mice, average consuming feed in 28 days, and reduction of blood glucose with a glucometer. The results obtained are a combination of porang tuber and moringa had a low contain carbohydrates and a high contain lipids and protein, can reduction in body weight of 21%, the lowest consumption of feed, and the lowest fasting and postprandial blood glucose levels compared to the other feeds. A combination of porang and moringa can be an antidiabetic and antiobesity agent.
Introduction
Coronary heart disease is a Non-Communicable Disease (NCD) has become a health threat to people worldwide (1). Health is always a very important factor. Many efforts have been made to improve health, especially regarding food. Many diseases are sourced from the food consumed, such as diabetes mellitus and obesity. The prevalence of diabetes mellitus has been increasing yearly and steadily for over 50 years, and now, proportions of diabetes mellitus have reached the pandemic (2).
Obesity is a high-risk factor for developing diabetes mellitus. One of the main causes of insulin resistance is obesity. Insulin action will be affected by fat tissue accumulation, especially if the fat tissue accumulates in the stomach (3). There is a connection between diabetes mellitus and obesity (4). The two conditions (obesity and diabetes mellitus) are commonly referred to as cardiovascular disease risk factors (CVDRFs) (5, 6). Patients with diabetes mellitus have a two to four times higher risk of developing CVD (7). Obesity and diabetes mellitus prevalence must be decreased to reduce CVD. Waist circumference, body mass index, and body fat mass are markers of obesity that can be used to diagnose diabetes (6, 8).
Body fat depends on energy intake and energy expenditure (9), which can cause several diseases, such as obesity, diabetes, and cardiovascular. The risk factors for those diseases are excess energy, salt, saturated and trans fats, and free sugars (9, 10). The CVD risk reduction by consuming foods with a low glucose index must also meet other nutrients the body needs. Several studies have proven that some herbal plants can lose weight, such as Nigella sativa, Black Chinese tea, Green Tea, Camellia sinensis (11), avocado (12), and chitosan (13). The isolated compound from the brown algae, Ishige okamura (IO), can act as a supplement for anti-obesity and anti-diabetic through regulating lipid metabolism and glucose homeostasis as proven in vitro and in vivo (14).
Amorphophallus muelleri Blume, or porang, has been used as an edible plant. Amorphophallus tuber contains protein, soluble carbohydrates (glucomannan), total carbohydrates, and fiber (15). Glucomannan can increase lipids, proteins, and carbohydrates metabolism and absorption. Glucomannan can also reduce appetite because glucomannan can be swallowed in the stomach and reduces weight and blood glucose in diabetes mellitus type II patients (16). Moringa oleifera is the medicinal plant that has high nutrition. M. oleifera contains protein, carbohydrates, dietary fiber, fat, vitamins, minerals, and essential amino acids (17). In this study, we tested porang as feed on mice to see the effect of reducing glucose and body weight. The combination of porang and M. oleifera can increase the body's nutrition.
Experimental Section
A. muelleri tubers were collected from Silo Sanen Field, Jember, East Java. M. oleifera leaves were collected from the Moringa field in Jatikuwung, Karanganyar, Central Java. The tubers and leaves were determined by Clara Erlin Zuliarty as Botanist at the Botanical Research and Development Center 'Herbarium Bogoriense', Center for Biological Research, LIPI, Bogor, West Java, Indonesia, (No: 782/IPH.1.01/If.07/IV/2018). Then, the samples were dried and ground to powder.
Pellets Preparation
Five kinds of feed contain porang tubers, moringa leaves, wheat flour, meat oil, fish oil, and standard food (BR2). The compositions of feeds are presented in Table 1. The constituent of the feed was mixed until homogeneous and put into a pellet press machine. The pellets that came out were refrigerated for 1 hour. From those compositions, five types of feed were produced, namely porang (P), wheat flour (W), a combination of porang and moringa (PM), wheat flour and moringa (WM), and BR2.
| Feeds | Compositions (%) | |||||
|---|---|---|---|---|---|---|
| Porang tuber | Moringa leaf | Wheat flour | Meat oil | Fish flour | Standar feed BR2 | |
| P | 60 | - | - | 5 | 20 | 15 |
| W | - | - | 60 | 5 | 20 | 15 |
| PM | 30 | 30 | - | 5 | 20 | 15 |
| WM | - | 30 | 30 | 5 | 20 | 15 |
| BR2 | - | - | - | - | - | 100 |
Macronutrient Analysis
The sample (2 grams) was placed in a petri dish. The sample was dried at a temperature of 135 °C for 2 hours. Once the sample has cooled for two hours, transfer it to a desiccator and weigh it until it reaches its fixed weight. Moisture content was calculated using the following formula.
W0 was the weight of the sample before drying, and W1 was the losing weight after drying.
Carbohydrate Content
Preparation of Standard Curve
A standard starch solution of 1000 mg/L was pipetted and diluted into a 50 mL flask to obtain standard series concentrations (10, 20, 30, 40, 50, and 60 ppm). A standard solution (1 mL) was added into a test tube, and add 1 mL of distilled water. Each solution received 1 mL of 55% phenol solution. Then, the standard solutions were vortex and added 5 mL of concentrated sulfuric acid, then incubated for 10 minutes. Measure the absorbance at a wavelength of 490 nm.
Preparation of Blank Solution
Distilled water (2 mL) was prepared for a blank solution. 55 % phenol solution (1 mL) was added to each solution. Then, the blank solution was vortex and added 5 mL of concentrated sulfuric acid and incubated for 10 minutes. Measure the absorbance at a wavelength of 490 nm.
Preparation of Sample Solution
A sample (1 mL) was added to a test tube and added 10 mL of concentrated sulfuric acid. The sample solution was diluted into a 100 mL flask. Sample solution (1 mL) was added into a test tube, and add 1 mL of distilled water, 1 mL of 55 % phenol solution, and then vortex the solution. Concentrated sulfuric acid (5 mL) was added to the sample solution and incubated for 10 minutes. Measure the absorbance at a wavelength of 490 nm. The following formula was used to measure the carbohydrate content.
C was the carbohydrate concentration as glucose from the standard curve (µg/g), V was the total solvent for dissolving the sample, and W was sample weight in grams.
Lipid and Protein Content
The principal structural component of food are lipids, proteins, and carbohydrates. A group of compounds known as lipids is generally soluble in non-polar solvents. Analysis of lipids was carried out by solvent extraction using the Soxhlet method. The method used refers to AOAC method (18). Proteins vary in molecular mass, with the content of Nitrogen. Determine protein content in feed using the Kjeldahl method. In the Kjeldahl method, samples are digested with H2SO4. After being neutralized by alkali, the digest is distilled into a boric acid solution. Following titrating the borate anions with HCl, which is converted to Nitrogen in the sample. The method used refers to Nielsen with slight modification (18). Macronutrients of feed were determined in laboratory unit for testing, calibration and certification Bogor Institute of Technology (IPB), Bogor with certificate number LT-10-19-1004. Macronutrient measurements aim to determine the nutritional content of each feed.
Preparation of Animal
Eight-week-old male DDY mice were purchased from the animal laboratory, faculty of animal husbandry, IPB, Bogor, west Java. There were five groups of twenty-five mice. The mice were acclimated to a light-dark cycle for one week before the experiment commenced. During the acclimatization, the animal test was fed with standard feed. The animal welfare in this research was conducted based on Regulation of the Indonesian Food and Drug Authority Number 18 of 2021 regarding Guidelines for Preclinical Pharmacodynamic Tests of Traditional Medicine published by The Indonesian Food and Drug Authority of the Republic of Indonesia (19). The Universitas Pembangunan Veteran Ethics Committee in Jakarta, Indonesia, has approved the protocol for treating the animals in this experiment (Ethical Approval No. 2781/IX/2020/KEPK). After seven days of acclimatization, the animal test was fed with five feeds (P, W, PM, WM, BR2) for 28 days. Table 2 represents the animal test group. During 28 days, the leftover feed was weighed daily to see how much the mice ate. Mice's weight, fasting blood glucose, and postprandial blood glucose were measured once a week. An analysis was performed by statistics using ANOVA with IBM SPSS V.22 software to see a significant difference in mice's weight loss and glucose levels.
| Group | Treatment |
|---|---|
| I | Porang feed (P) 5 grams each day/mouse |
| II | Wheat flour feed (W) 5 grams each day/mouse |
| III | Porang and Moringa feed (PM) 5 grams each day/mouse |
| IV | Wheat flour and Moringa (WM) 5 grams each day/mouse |
| V | Standard feed (BR2) 5 grams each day/mouse |
Measurement of Blood Glucose
The mice's blood was examined using a Glucometer weekly for 28 days. Blood was collected from the test animals in each group on the 07th, 14th, 21st, and 28th days. Blood was collected from the mice's tails through the lateral vein. A glucometer was used to measure the glucose levels in mice blood. In this experiment, blood glucose levels were measured after a fast and after eating. The mice were fasting for approximately 16 hours to measure the fasting blood glucose levels. Blood glucose was also taken 2 h after fasting.
Result and Discussion
Pellets Preparation
The main samples in this study were porang tuber and moringa leaf. Porang tuber powder and moringa leaf powder were used as feed for mice (Figure 1). Porang tuber was used as a single feed and in combination with moringa leaves. Moringa leaves is also used in combination with wheat flour.
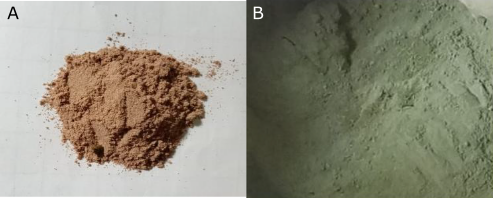
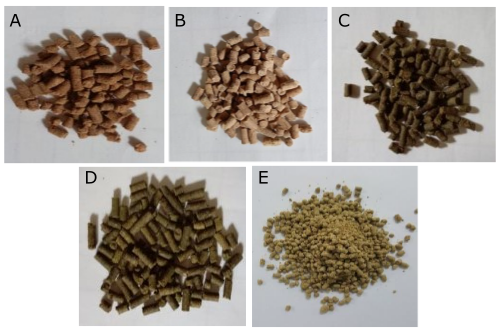
Porang tuber powder is brown and the moringa leaf is green. Five kinds of mice feed were made with the compositions in Table 1. The mice feed was made using a pellet printing machine to make the standard size of feed (Figure 2). Wheat flour is also used to compare weight gain and blood glucose levels. heat flour is a refined carbohydrate that has the effect of increasing the glycemic index and causing obesity (20). In addition, standard feed (BR2) is also used. BR2 is a standard feed for mice that is shaped like a capsule. The feed tested in this study was made to resemble standard feed so that the mice ate the feed like the regular feed.
Pellets Macronutrient
Macronutrients of the five types of mice feed were different. BR2, as a standard feed, has a higher carbohydrate level than other feed. The highest lipid and protein contents were found in WM feed. For moisture content, the highest level of moisture was found in the PM feed. PM feed had a low content carbohydrates and a high content of lipids and protein. Consuming food low in carbohydrates can help lose weight and increase insulin sensitivity (21). Lipids and proteins can be used as energy in the body through gluconeogenesis. BR2 has the lowest moisture content, so BR2 has the most fragile form (Figure 2).
The nutrients of food are presented in Table 3. Nutrient food contains high protein, fiber, bioactive compounds, and low sugar and fat (22). Porang had glucomannan, which is a hydrophilic carbohydrate. Porang tuber was rich in fiber and low in calories of carbohydrates (23). The high content of protein and the low content of lipids of M. oleifera it used as a functional food (24).
| Group | Macronutrient levels (%) | |||
|---|---|---|---|---|
| Carbohydrate | Lipid | Protein | Moisture | |
| P | 57.74 | 4.08 | 16.43 | 12.02 |
| W | 57.20 | 5.85 | 19.47 | 10.85 |
| PM | 50.18 | 7.07 | 20.75 | 11.72 |
| WM | 49.85 | 7.94 | 22.07 | 10.80 |
| BR2 | 58.36 | 5.73 | 18.81 | 9.91 |
| Group | Average of weight (gram) in 28 days | Average of weight (gram) at 0 week (T0) | Average of weight (gram) at 4th week (T4) | T4 – T0 |
|---|---|---|---|---|
| P | 27.69 ± 1.92 | 30.80 | 28.25 | - 8% |
| b | ||||
| W | 33.15 ± 2.75 | 29.66 | 36.53 | + |
| a, c | 23% | |||
| PM | 25.08 ± 2.51 | 28.70 | 22.57 | - 21% |
| b | ||||
| WM | 31.60 ± 2.82 | 29.20 | 34.55 | + |
| a, c | 18% | |||
| BR2 | 32.18 ± 3.43 | 27.02 | 35.00 | + |
| a, c | 30% | |||
| Note: ap< 0.05 compared to the P group, bp< 0.05 compared to the W group, and cp< 0.05 compared to the PM group by Post Hoc Tuckey test. | ||||
Body Weight Profile
Body weight measurement aims to track changes in mice's body weight as they consume various meals. The measurement results of the mice's weight were carried out twice a week at 0, 1st, 2nd, 3rd, and 4th weeks. The lowest average body weight of mice was obtained on the diet of porang and moringa (PM) feed, with a reduction in body weight of 21%. The second feed with reduced body weight is porang, with a weight loss rate of 8%. The standard feed consumed by mice has a weight gain rate of 30%. Wheat flour (W) and combinations of wheat flour and moringa (WM) have a weight gain rate of 23% and 18%, respectively (Table 4). The yield and weight gain of the test animals were observed for 28 days.
Based on Table 4, there is a significant difference between the body weight of mice consuming feed containing porang and a combination of porang moringa with feed containing wheat flour and BR2. Consuming Glucomannan in porang tuber as a low carbohydrate diet (LCD) can reduce fat storage (16, 21). Consuming low carbohydrates can increase the gluconeogenesis process. Traditionally, porang is used as an antiobesity (16). M. oleifera can be an antiobesity and antihyperlipidaemic agent for losing weight (25). The combination of porang and moringa is best combined agent for weight loss.
Feed Consumption
The average food consumption of five types of mice feed, the highest consumption was found in W, then BR2, WM, P, and PM with an average of 4.51 ± 0.17, 4.47 ± 0.11, 3.65 ± 0.22, 2.63 ± 0.58 and 2.54 ± 0.21 gram per 28 days (Table 5). The amount of feed consumed per 28 days shows that the refined carbohydrate was rapidly processed, and will cause hunger more quickly and will cause an increase in body weight (Table 4). Foods containing fiber will take a long time to digest, delay gastric emptying, cause reduced food consumption, and correlate with weight loss (Table 4). The addition of moringa leaves to the wheat flour group can have an effect decrease in the amount of feed consumption (3.65 ± 0.223) compared to the single wheat group with a significance value (p< 0.05) (Table 5).
The results research by Amoah et al. , which compares the rating of hunger after consuming white bread (WB), wheatmeal bread (WMB), and Vegetable Bread (VB). The WB had the highest hunger rating of all bread. The VB with the higher fiber had the lowest hunger rating (26). The glucomannan in porang tuber has a higher fiber (23), so when consuming porang, the test animals have a more prolonged feeling of fullness, resulting in lower feed consumption.
| Group | Average Amount of Feed Consumption per Day (gram) |
|---|---|
| P | 2.63 ± 0.58 b, d |
| W | 4.51 ± 0.17 a, c, d |
| PM | 2.54 ± 0.21 b, d |
| WM | 3.65 ± 0.22 a, b, c |
| BR2 | 4.47 ± 0.11 a, c, d |
| Note: ap< 0.05 compared to the P group, bp< 0.05 compared to the W group, cp< 0.05 compared to the PM group, and dp< 0.05 compared to the WM group by the Mann Whitney test. | |
Blood Glucose Profile During Feeding
Fasting blood glucose is the glucose level after fasting. The fasting blood sugar levels of five feeds (P, W, PM, WM, and W) were 89 ± 13.80, 107.6 ± 11.88, 68.4 ± 18.60, 102.68 ± 13.17, and 103.1 ± 13.77 mg/dL respectively (Table 6). Postprandial blood glucose is the glucose level after eating for 2 hours. The levels of five types of feed, P, W, PM, WM, and BR2, were 101.96 ± 14.09; 156.70 ± 28.16; 80.70 ± 13.05; 122.56 ± 14.35; and 151.60 ± 23.33 respectively mg/dL (Table 7). The lowest fasting and postprandial blood glucose values were found in PM. The lower the glucose content of the food consumed, the lower the blood glucose levels (20, 27, 28). Table 6 shows a significant difference between the fasting blood glucose of mice after consuming the P feed with the other feeds. The fiber content of feed is not a factor in increasing blood glucose (20). Based on Table 7, there is a significant difference between posprandial blood glucose of mice while consuming the feed containing porang and moringa with the other feeds without porang and moringa in single or combination.
.
| Group | Average of fasting blood glucose (mg/dL) |
|---|---|
| P | 89 ± 13.80 b, c |
| W | 107.6 ± 11.88 a, c |
| PM | 68.4 ± 18.60 a, b |
| WM | 102.68 ± 13.17 a, c |
| BR2 | 103.1 ± 13.77 a, c |
| Note: ap< 0.05 compared to the P group, bp< 0.05 compared to the W group, and cp< 0.05 compared to the PM group by the Mann Whitney test. | |
| Group | Average of postprandial blood glucose (mg/dL) |
|---|---|
| P | 101.96 ± 14.09 b [FNO1] |
| W | 156.70 ± 28.16 a, c, d |
| PM | 80.70 ± 13.05 b, d |
| WM | 122.56 ± 14.35 b, c |
| BR2 | 151.60 ± 23.33 a, c, d |
| Note: ap< 0.05 compared to the P group, bp< 0.05 compared to the W group, cp< 0.05 compared to the PM group, and dp< 0.05 compared to the WM group by the Post Hoc Tuckey test. | |
Obesity is a trigger factor for increased blood sugar levels. According to the research, obese patients have abnormal blood sugar levels (28). Excess weight gain or obesity can lead to several complications of metabolic syndrome, like diabetes. Maintaining food consumption can avoid excess weight gain or obesity and indirectly prevent diabetes mellitus due to insulin resistance (14).
Conclusion
Several factors were investigated in this study to identify the type of feed that has antidiabetic and antiobesity properties. Antidiabetic activity is proven by lowering blood glucose, and the antiobesity agent is by decreasing several parameters such as mice weight loss, daily feed consumption, and nutrition from each feed as a functional diet. According to this study, the carbohydrate content of a mixture of wheat flour and moringa is lower than that of a mixture of porang and moringa. Nevertheless, compared to wheat flour and moringa, porang and moringa have higher protein levels and lower lipid levels. Porang and moringa feed combination results showed the best weight loss decrease based on average mice weight loss data, the lowest daily feed consumption, and the best fasting and postprandial glucose reduction. porang and moringa feed have a high fiber content, so that they can reduce daily feed consumption with delayed gastric emptying. Porang and moringa can be used as antidiabetic and antiobesity agents.
Declarations
Acknowledgment
The authors wish to thank the support of the Pharmacology Laboratory, Faculty of Pharmacy, Pancasila University, and The Laboratory Unit of Testing Services, Calibration and Certification of IPB, Indonesia.
Conflict of Interest
The authors declare no conflicting interest.
Data Availability
The unpublished data is available upon request to the corresponding author.
Ethics Statement
Ethical approval for the study was obtained from the Ethics Committee of Universitas Pembangunan Veteran, Jakarta, Indonesia (Ethical Approval No.: 2781/IX/2020/KEPK).
Funding Information
Not applicable.
References
- Baeradeh N, Ghoddusi Johari M, Moftakhar L, Rezaeianzadeh R, Hosseini SV, Rezaianzadeh A. The prevalence and predictors of cardiovascular diseases in Kherameh cohort study: a population-based study on 10,663 people in southern Iran. BMC Cardiovasc Disord. 2022;22(1):1–12.
- Aschner P, Karuranga S, James S, Simmons D, Basit A, Shaw JE, et al. The International Diabetes Federation’s guide for diabetes epidemiological studies. Diabetes Res Clin Pract. 2021;172:108630.
- Abbas A. View of Meta Analysis of the Relationship of Obesity with Type 2 Diabetes Mellitus in Indonesia. STRADA Jurnal Ilmiah Kesehatan. 2021;10(1):276–82.
- Shrestha N, Karki K, Poudyal A, Aryal KK, Mahato NK, Gautam N, et al. Prevalence of diabetes mellitus and associated risk factors in Nepal: Findings from a nationwide population-based survey. BMJ Open. 2022;12(2):1–8.
- Alduraywish SA, Aldakheel FM, Azizalrahman LA, Alzaid LT, Alqahtani SS, Alhussein SH, et al. Knowledge about the Risk of Cardiovascular Disease among Adults with Type 2 Diabetes Visiting the Outpatient Clinics at Tertiary Hospital in Riyadh, Saudi Arabia: A Cross-Sectional Study. Int J Environ Res Public Health. 2022;19(9).
- Wang K, Pan L, Wang D, Dong F, Yu Y, Wang L, et al. Association between obesity indicators and cardiovascular risk factors among adults in low-income Han Chinese from southwest China. Medicine. 2020;99(30):1–8.
- Fox CS. Cardiovascular disease risk factors, type 2 diabetes mellitus, and the Framingham Heart Study.pdf. NIH Public Access. 2010;20(3):90–5.
- Zhang S, Sun D, Qian X, Li L, Wu W. Combined Effects of Obesity and Dyslipidaemia on the Prevalence of Diabetes Amongst Adults Aged ≥45 Years: Evidence from a Nationally Representative Cross-Sectional Study. Int J Environ Res Public Health. 2022;19(13):1–11.
- Hatta M, Horikawa C, Takeda Y, Ikeda I, Yoshizawa Morikawa S, Kato N, et al. Association between Obesity and Intake of Different Food Groups among Japanese with Type 2 Diabetes Mellitus—Japan Diabetes Clinical Data Management Study (JDDM68). Nutrients. 2022;14(15).
- Lea Nash Castro, Jewell J, Whiting S, Rippin H, Farrand C, Kremlin W, et al. Nutrition , overweight and obesity. World Health Organization Europe. 2021;1–19.
- Ashiq K, Tanveer S, Qayyum M, Ashiq S. Faculty of Pharmaceutical Sciences , Superior University 17-km Raiwind Road Lahore 55150 ,. 2019;(October).
- Sandner G, König A, Wallner M, Weghuber J. Functional foods - dietary or herbal products on obesity: application of selected bioactive compounds to target lipid metabolism. Curr Opin Food Sci. 2020;34:9–20.
- Bonetti G, Herbst KL, Donato K, Dhuli K, Kiani AK, Aquilanti B, et al. Dietary supplements for obesity. J Prev Med Hyg. 2022;63(2):E160–8.
- Yang HW, Fernando KHN, Oh JY, Li X, Jeon YJ, Ryu BM. Anti-obesity and anti-diabetic effects of ishige okamurae. Mar Drugs. 2019;17(4):1–11.
- Basu S, Das M, Sen A, Choudhury UR, Datta G. Analysis of complete nutritional profile and identification of bioactive components present in Alocasia indica tuber cultivated in Howrah District of West Bengal, India. Asian Pac J Trop Med. 2014;7(S1):S527–33.
- Sirotkin A V. Can konjac (Amorphophallus konjac K. Koch) and it constituent glucomannan be useful for treatment of obesity? Obes Med [Internet]. 2021;24(March):1–3. Available from: https://doi.org/10.1016/j.obmed.2021.100343
- Khalid Abbas R, Elsharbasy FS, Fadlelmula AA. Nutritional Values of Moringa oleifera, Total Protein, Amino Acid, Vitamins, Minerals, Carbohydrates, Total Fat and Crude Fiber, under the Semi-Arid Conditions of Sudan. J Microb Biochem Technol. 2018;10(2).
- Nielsen SS. Food Analysis [Internet]. Nielsen SS, editor. Boston, MA: Springer US; 2010. (Food Science Texts Series; vol. Fourth Edition). Available from: http://link.springer.com/10.1007/978-1-4419-1478-1
- Badan Pengawas Obat dan Makanan. Peraturan Badan Pengawas Obat dan Makanan Nomor 18 Tahun 2021 tentang Pedoman Uji Farmakodinamik Praklinik Obat Tradisional. Jakarta: Badan Pengawas Obat dan Makanan Republik Indonesia.; 2021.
- Gross LS, Li L, Ford ES, Liu S. Increased consumption of refined carbohydrates and the epidemic of type 2 diabetes in the United States: An ecologic assessment. American Journal of Clinical Nutrition. 2004;79(5):774–9.
- Barber TM, Hanson P, Kabisch S, Pfeiffer AFH, Weickert MO. The Low-Carbohydrate Diet: Short-Term Metabolic Efficacy Versus Longer-Term Limitations. Nutrients. 2021;13:1–15.
- Goubgou M, Songré-ouattara LT, Bationo F, Lingani-sawadogo H, Traoré Y, Savadogo A. Biscuits : a systematic review and meta- analysis of improving the nutritional quality and health benefits. Food Production, Processing and Nutrition. 2021;3(26):1–18.
- Shi XD, Yin JY, Cui SW, Wang Q, Wang SY, Nie SP. Plant-derived glucomannans: Sources, preparation methods, structural features, and biological properties. Trends Food Sci Technol [Internet]. 2020;99(February):101–16. Available from: https://doi.org/10.1016/j.tifs.2020.02.016
- Peñalver R, Martínez‐zamora L, Lorenzo JM, Ros G, Nieto G. Nutritional and Antioxidant Properties of Moringa oleifera Leaves in Functional Foods. Foods. 2022;11(8):1–13.
- Sivanesan RK, Norliza M, Nancy FM, Azlina MFN. Preventive Effects of Moringa oleifera on Obesity and Hyperlipidaemia: A Systematic Review. Sains Malays. 2022;51(7):2159–71.
- Amoah I, Cairncross C, Merien F, Rush E. Glycaemic and appetite suppression effect of a vegetable-enriched bread. Nutrients. 2021;13(12):1–11.
- Sagili VS, Chakrabarti P, Jayanty S, Kardile H, Sathuvalli V. The Glycemic Index and Human Health with an Emphasis on Potatoes. Foods. 2022;11(15):1–12.
- Tantu R, Titin Dunggio, Niluh Arwati. Description of Blood Glucose Levels in Obesity Patients in Puskesmas North City. Journal of Health, Technology and Science (JHTS). 2023;1(2):23–34.