
RESEARCH ARTICLE
Low Glycemic Index Taro Tuber (Colocasia esculenta L.) Flakes as Alternative Food Product for Diabetes Management
Academic Editor: Garnadi Jafar
Sciences of Pharmacy|Vol. 4, Issue 4, pp. 270-277 (2025)
Views
Downloads
Shares
Received
Jul 25, 2025Revised
Sep 7, 2025Accepted
Oct 24, 2025Published
Nov 6, 2025
Abstract
Introduction
Diabetes mellitus (DM) is reported by the International Diabetes Federation (IDF) as a significant global health problem affecting approximately 463 million individuals in 2019. This figure is expected to rise to 700 million by 2045, with 374 million at an elevated risk of type 2 DM. The worldwide incidence recorded among the age group of 40-59 years in 2013 featured 382 million cases. Additionally, Indonesia ranks among the top ten nations globally in terms of the population afflicted with diabetes, which has a prevalence rate of 6.2% in 2019 and is a prominent contributor to mortality. Type 2 DM is primarily caused by a combination of insulin resistance and progressive dysfunction of pancreatic β-cells, resulting in impaired insulin secretion and chronic hyperglycemia. Contributing risk factors include obesity, sedentary lifestyle, high-calorie diets, advancing age, and genetic predisposition (1).
Experts have developed guidelines for preventing and controlling diabetes to address the increasing number of cases in this country. Effective diabetes management is crucial to avoid severe complications, including neuropathy, nephropathy, retinopathy, as well as microvascular and cardiovascular diseases. Contemporary strategies for managing diabetes comprise pharmacologic methods, including oral drugs and insulin, alongside non-pharmacologic therapy, such as lifestyle adjustments through physical activities and other measures. There is also a need for dietary modifications, which require optimizing macronutrient distribution to 45-65% carbohydrates, 20-25% fat, and 10-20% protein (2-4). To enhance glycemic control, reduce LDL cholesterol levels, and mitigate cardiovascular risk, a daily intake of 30-50 g of minimally processed carbohydrates comprising at least 30% soluble fiber and a low glycemic index is recommended (5, 6).
Individuals diagnosed with DM require a diet rich in fiber and complex carbohydrates that have a low glycemic index (GI) value. The glycemic index (GI) is defined as how quickly carbohydrates in food can raise blood sugar levels after consumption (5, 7, 8). Foods with low GI such as complex carbohydrates help prevent blood sugar and insulin spikes after a meal. Consumption of foods with low GI and high fiber tend to be more filling and provide energy for longer, thus helping DM patients control appetite and prevent overeating, which contributes to helping prevent long-term DM complications (9, 10).
Taro tubers (Colocasia esculenta L. ) are a potential source of alternative functional foods for type 2 DM as they contain higher levels of protein at 2.2 g/100 g, compared to cassava and sweet potato which provide 1.2 g and 1 g respectively (11, 12). In addition, taro tubers provide substantial amounts of essential vitamins and minerals, including vitamin C (4 mg/100 g), potassium (1375–2525 mg/100 g), magnesium (209–269 mg/100 g), calcium (31.7–120 mg/100 g), phosphorus (111–397 mg/100 g), and iron (7.31–20.7 mg/100 g), as well as fibre (5.06 g/100 g) that can regulate insulin and glucose levels in the body (12-14). To improve their practicality, consumer acceptability, and shelf stability while preserving nutritional quality, taro tubers can be developed into flake-based products.
Flakes are a form of food product commonly consumed as an instant alternative to breakfast in this era. However, there is a scarcity of instant breakfast items specifically designed for individuals with DM. The majority of breakfast product available in the market contain high carbohydrates and low fiber. Consequently, individuals with DM have a restricted range of options during the selection of instant breakfast items. A substantial number of flakes made from corn and wheat are currently in circulation across Indonesia because those from tubers are not yet commonly produced (15, 16).
The development of taro tubers into flake-based products can provide significant dietary fibre content, which are acceptable as a supplementary food option for people with type 2 DM. Therefore, this study aimed to process and formulate starch extract of taro tuber into flakes. The products obtained were comprehensively evaluated through sensory tests (hedonic and organoleptic tests), as well as analyses of moisture content, ash content, total plate count (TPC), and glycaemic index. Finally, considering that foods with high fibre and low GI values can efficiently minimize the impact on blood sugar levels, taro tuber flakes were developed based on consumer acceptance and are proposed as a suitable breakfast food option for diabetic patients.
Methodology or Experimental Section
Materials
The flour used in this study was made from C. esculenta L. tubers collected from South Luwuk, Central Sulawesi. The tubers were identified at Herbarium Celebense, part of the Sulawesi Biological Resources Unit, Tadulako University with No.50/UN.28. UPT-SDHS/LK/2022, The materials used were Nutrient Agar (Merck Kga2A®), sugar (Tropicana Slim®), eggs, skim milk (Tropicana Slim®), salt, wheat flour (Segitiga Biru®), Sodium Carboxymethylcellulose (Na CMC), n-Hexane, aquadest (Waterone®), 70% ethanol (Onemed®), Nutrient Agar (Merck®), Eosin Methylene Blue Agar (Merck®), and Plate Count Agar (Merck®).
Methods
Sample preparation
Taro tubers sourced from Sumondung Village, Central Sulawesi Province were peeled, washed, and sliced thinly with a knife. The slices were soaked in a 3% salt solution for 5 min, then dried in an oven, under varying temperatures of 40 °C, 60 °C, and 80 °C for 8-10 h, respectively, until they reached a constant weight (designated as F1, F2, and F3). Subsequently, the dried tubers were mashed with a blender and separated using a 100-mesh sieve to produce flour.
Formulation of flakes
Taro flour (approximately 50%) was combined with skim milk, eggs, salt, and sugar to form a dough, which was blended with water using a mixer at medium speed for 10 min. The dough was poured thinly and evenly into a tray with a thickness of ±1 mm and then baked in an oven at 140 °C for 20 min. According to Table 1, there were four flake formulas including F1, F2, and F3 produced from taro flour at drying temperatures of 40 °C, 60 °C, and 80 °C, while F4 was prepared with wheat flour (17).
| Materials | F1 | F2 | F3 | F4 |
|---|---|---|---|---|
| Taro flour | 50% | 50% | 50% | - |
| Wheat flour | - | - | - | 50% |
| Skim milk | 20% | 20% | 20% | 20% |
| Sweetener | 10% | 10% | 10% | 10% |
| Egg | 10% | 10% | 10% | 10% |
| Salt | qs | qs | qs | qs |
| Water | ad 100% | ad 100% | ad 100% | ad 100% |
| Note: qs = sufficient quantity, ad = until (%w/w) | ||||
Moisture and ash content
Moisture and ash contents were determined using Association of Official Analytical Chemists (AOAC, 2007) and American Association of Cereal Chemists (AACC, 1995) method. Moisture content was determined by drying 2–5 g of homogenized sample in a pre-weighed aluminum dish at 105 ± 2 °C until a constant weight was obtained. The result was expressed as the percentage of weight loss relative to the initial sample weight.
Ash content was analyzed using the dry ashing method. About 2–5 g of sample was incinerated in a pre-weighed porcelain crucible at 550 ± 25 °C in a muffle furnace until a light-colored ash was obtained. After cooling in a desiccator, the crucibles were weighed, and ash content was calculated as the percentage of the original sample weight. Each measurement was carried out in triplicate, and results were reported as mean ± SD.
Sensory evaluation
An organoleptic evaluation was conducted to assess taro tuber flakes for taste, smell, color, and texture using human senses. For the hedonic scoring, 30 untrained panelists were recruited, with ages ranging from 20 to 35 years. The gender distribution was random, as participants were selected without gender restriction to reflect a general consumer population. All participants received a product information sheet and provided written informed consent before participation. To ensure anonymity, no personally identifiable information was collected; panelists were identified only by unique numeric codes. Since the test was designed as a consumer acceptance evaluation, the panelists were not formally trained; however, they received clear instructions on how to use the 9-point hedonic scale according to the SNI (18, 19).
Microbial assays
Total plate count (TPC): 1 g flakes was aseptically transferred into 9 mL of 0.1% peptone water and homogenized to obtain a 10⁻¹ dilution. Serial dilutions were prepared by transferring 1 mL of the previous dilution into 9 mL of sterile diluent until a 10⁻¹⁰ dilution was achieved. From each dilution, 1 mL of the sample was poured into a sterile Petri dish, followed by the addition of 15–20 mL of warm NA. The mixture was gently swirled to ensure even distribution and allowed to solidify. The plates were then incubated in an inverted position at 37°C for 24 h. After incubation, colonies forming on plates containing 30–300 colonies were counted to determine the total viable count (20). The results were expressed as Colony Forming Units per gram (CFU/g) using the Eq. 1.
Escherichia coli: The test for E. coli included transferring 1 mL of a sample from a 10-1 dilution into a test tube with a 10-2 dilution. Then, 1 mL of samples from both dilutions were inoculated into a sterile Petri dish containing Eosin Methylene Blue Agar. (EMBA) media by spreading. Then, the mixture was homogenized to ensure even distribution. Next, the mixture was incubated at 37 °C for 24 h and E. coli colonies were observed to be dark in color with a metallic green sheen. The methylene blue in EMB agar functions as a selective agent by suppressing the growth of Gram-positive bacteria while promoting the development of Gram-negative coliforms (21).
Salmonella typhi: The test for S. typhi was performed by transferring 1 mL of sample from a 10-1 dilution to a test tube containing a 10-2 dilution. Then, 1 mL of sample from both dilutions was placed into sterilized Petri dishes, Plate Count Agar (PCA) media were added, and the mixture was homogenized to ensure even distribution. Subsequently, incubation was conducted at 37 °C for 24 h and the colonies formed were observed (22).
Animal handling
Before treatment, rats were acclimated for 10 days with ad libitum access to a standard maintenance rodent diet and potable water. All animal handling and experimental procedures were conducted in accordance with the Guide for the Care and Use of Laboratory Animals, 8th Edition (National Research Council, 2011), and approved by the Institutional Animal Ethics Committee. The rats then divided into six groups. These included Group 1 receiving 2.5 g/kg BW glucose as positive control and Group 2 receiving 2.5 g/kg BW 0, 1% Na CMC as a negative control. Groups 3, 4, and 5 were administered with 2.5 g/kg BW Taro flakes dried at 40 °C, 60 °C, and 80 °C, respectively, while Group 6 received 2.5 g/kg BW wheat flakes (F4).
For the glycemic index test, 30 healthy rats were divided into six groups and fasted initially for 12 h before measuring fasting blood glucose levels. Subsequently, male rats were given test food, including dried Taro flakes, glucose, 0.1% Na CMC, and wheat flakes at a dose of 2.5 g/kg BW each. Blood glucose levels were measured at 0, 1, and 2 h, while the results were presented on a graph with the X-axis signifying time and the Y-axis denoting blood glucose (23).
Determination of blood glucose levels in test animals
Using the strip code key, the Glucometer NESCO® MultiCheck 3 in 1, Fitech UK Ltd, United Kingdom was calibrated before inserting the strip into the test device. A blood sample was collected from the vein located at the tail tip of the rats, then dripped onto a glucometer strip, and the glucose levels were measured as shown on the device monitor (24).
Determination of AUC and glycemic index value
Blood glucose levels were measured, and the data were analyzed using the Area Under the Curve (AUC) method. The adjusted blood glucose level was calculated by subtracting the glucose level attained after 0.1% Na CMC administration from the level measured in food sample. The adjusted glucose was used to determine the glycemic index, while AUC values were calculated through the Trapezoid method with the Eq. 2 (25, 26). The glycemic index value of the sample is obtained by comparing the Area Under the Curve (AUC₀–₂) of the sample with that of glucose, as seen in Eq. 3 (27, 28).
Key to Eq. 1 | a, b, and c = glucose level of the sample at 0, 1, and 2 h (mg/dL), respectively; t = time interval (hour), AUC = area under curve.
Key to Eq. 3 | 01-2346-2006 guidelines. The resulting scale form included options for very strongly like (9), very like (8), like (7), slightly like (6), neutral (5), slightly dislike (4), dislike (3), very dislike (2), and very strongly dislike (1).
Data Analysis
The statistical analysis was performed using a two-way ANOVA (Analysis of Variance) to evaluate the effect of heating treatment and time (0, 1, and 2 h) on the glycemic index of taro tuber. Post hoc analysis was conducted using Duncan’s multiple range to determine significant differences between treatment means. All analyses were performed using GraphPad Prism program for Windows (version 10.0; GraphPad Software, Inc. , San Diego, CA, USA).
Results and Discussion
An experimental investigation was conducted in this study to assess the potential of taro tuber flour (C. esculenta L. ) as a functional food product for people with DM. Taro tubers were obtained from Sumondung Village, Bulagi District, Banggai Islands Regency, Central Sulawesi Province.
One form of functional food product is flakes. Taro tubers-based flakes offer significant advantages due to their dietary fibre content and are also fortified with essential nutrients, thereby becoming a desirable supplement option for individuals with type 2 DM (11-13). In this study, taro tubers-based flakes were processed into several formulas by combining taro flour with supplementary components. Each formula was subjected to distinct drying temperatures of 40 °C (F1), 60 °C (F2), and 80 °C (F3). Occasionally, the flake production process may incorporate a modified roasting method. Taro flour was characterized during this study to assess compliance with recommended specifications, compared to wheat flour. Additionally, evaluations were conducted to analyze several parameters such as hedonic responses, moisture and ash content, microbial examination, and glycaemic index.
Sensory evaluation
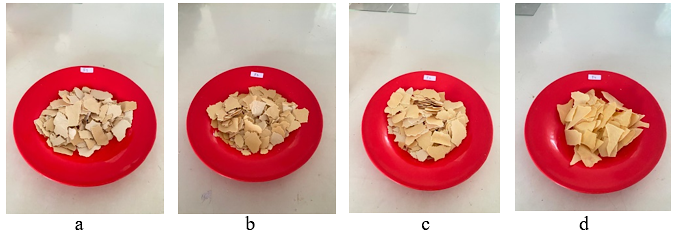
Based on the results of the hedonic responses, the taro tubers-based flakes obtained had acceptable physical properties. The appearance of taro tubers-based flakes can be seen in Figure 1. Hedonic evaluation involved untrained panellists who represented potential consumers then they rated the level of liking or subjective preference for taro tubers-based flakes products. The assessment included taste, colour, texture and aroma.
The sensory evaluation revealed that F3 obtained the highest hedonic scores compared to other formulations, particularly in terms of taste and overall acceptability. Interestingly, all formulations were prepared using the same concentration of sweetener, indicating that the differences in hedonic perception were not due to the intensity of sweetness but rather to the interaction between the taro base matrix and other formulation components. The addition of sweetener in this study was not intended to increase the glycemic load but primarily to enhance consumer acceptability of taro flakes as a potential functional snack. Importantly, the sweetener used was Tropicana Slim Diabtx®, which differs fundamentally from sucrose or other high-glycemic sugars. This product contains low-calorie sweeteners (sucralose, acesulfame-K, and sorbitol) that do not significantly contribute to postprandial glycemia (29). Previous studies have reported that sucralose and acesulfame-K are safe for diabetic consumption within acceptable daily intake levels (30). Therefore, the inclusion of this diabetic-friendly sweetener not only improves the sensory attributes of taro flakes but also preserves their suitability as a functional food product for diabetes management.
Food color is considered as a distinguishing characteristic that captivated the attention of consumers through the visual sense (31). Based on the test results, the three test formulas (F1, F2, F3) produced uniform flakes color. F4 appeared pale yellow, which was attributed to the inclusion of wheat flour as the base ingredient. Meanwhile, F1, F2, and F3 were yellow-brown, a darker color due to the browning process. This may be due to a chemical transformation identified as the Maillard reaction that occurs when carbohydrates, particularly reducing sugars, interact with primary amine groups upon heating (32). Consumer liking scores from the color test ranged from 5.4 to 6.3, as shown in Table 2. F2 was the most preferred (6.3=favorable), while sample F4 was the least preferred (5.4=moderately favorable). The results indicated that the samples were classified as indifferent or moderately favorable.
| Formula | Hedonic scoring | Water content (%) | Ash content (%) | Bacterial Contamination | |||||
|---|---|---|---|---|---|---|---|---|---|
| Taste | Color | Texture | Aroma | Bacterial TPC (CFU/g) | E. coli | S. typhi | |||
| F1 | 5.0 ± 1.4 | 5.6 ± 0.3 | 5.5 ± 0.4 | 5.5 ± 0.6 | 0.36 ± 0.18 | 1.83±0.29 | 11.17 x 10⁹ ± 10.41 | - | - |
| F2 | 6.1 ± 0.4 | 6.3 ± 0.2 | 6.0 ± 0.5 | 5.6 ± 0.6 | 0.30 ± 0.21 | 1.67±0.76 | 10.96 x 10⁹ ± 6.43 | - | - |
| F3 | 6.0 ± 1.1 | 5.9 ± 0.3 | 5.9 ± 0.9 | 5.9 ± 0.4 | 0.09 ± 0.01 | 1.33±0.58 | 11.10 x 10⁹ ± 8.19 | - | - |
| F4 | 4.5 ± 0.5 | 5.4 ± 0.8 | 5.0 ± 0.8 | 4.9 ± 0.5 | 0.15 ± 0.17 | 1.67±0.29 | 11.27 x 10⁹ ± 3.06 | - | - |
The next assessment was the texture of the taro-based flakes. No significant differences were found for all measured parameters (p < 0.05) between the test and control formulas, indicating that the heating variation did not change the texture of the flakes and the texture was similar to flakes using wheat flour. Additionally, the analysis showed that each of the four formulas comprised a texture characterized by a crisp and brittle consistency. This statement was consistent with the results of Anandito who identified flakes with a splinter-like structure and a propensity for easy breakage (33, 34). The consumer liking scores of the texture test found in our study ranged from 5 to 6, with F2 receiving the highest score of 6 (favorable), while F4 had the lowest score of 5 (moderately favorable). Moreover, the aroma observation results showed all four formulas possessed a slightly sweet aroma, which could be attributed to the use of skim milk as an additional component.
Moisture and ash content
The water content of flake formulas was determined using the thermogravimetric method, where the sample was heated in an oven at 105 °C until a stable weight was achieved. The quality and shelf-life of food ingredients is influenced by the water content, thus requiring the conduction of moisture content assessment to ensure optimal processing and distribution of the product. The data presented in Table 2 shows that F1 and F3 had a moisture content of 0.36 ± 0.18% (highest) and 0.09 ± 0.01% (lowest), respectively. As the heating temperature of the flakes increases, the moisture content of the flakes decreases. Then, the value of moisture content in F1 and F2 higher than the control F4 can be attributed to the water holding capacity of the fibers present in taro tubers compared to wheat flour. The moisture content test results for all formulations indicated that they were in accordance with the specifications allowed in the Indonesian National Standard (SNI) 01-4270-1996 regarding flakes (moisture content < 3%). Thus, the moisture content of taro tuber flakes is considered satisfactory (35).
The determination of ash content in flour provides insight into the mineral composition of good quality flakes. The results showed that F1 taro tuber flour flakes contained the highest ash content at 1.8, while the lowest was found in F3 at 1.3. The ash content of taro tuber-based flakes F3 is very low, which is caused by the loss of some volatile mineral components during the heating process. According to the SNI 01-2973-2011 standard, the maximum allowable ash content is 4%, confirming that flake sample used in this study meets the specified requirements (35).
Microbial examination
According to the National Agency of Drug and Food Control of Indonesia (BPOM) regarding Microbiological Requirements for Food, certain bacterial pathogens must be completely absent from food products, regardless of whether the product is categorized as sterile. This is because the presence of these bacteria can pose a serious risk to consumer health, even in very small quantities. Notably, Salmonella spp. and E. coli are classified as indicator pathogens whose detection is not tolerated in food products, including those with low moisture content such as dried foods, due to their potential to cause severe gastrointestinal infections (36).
In the present study, a microbiological assessment was conducted on four formulations of taro flakes to evaluate the presence of E. coli and S. typhi. Each formulation underwent triplicate testing, involving a 24 h incubation period on selective culture media Eosin Methylene Blue Agar (EMBA) for E. coli and Plate Count Agar (PCA) for S. typhi. The results, as summarized in Table 2, indicated no visible colony formation on either medium, thereby confirming the absence of E. coli and S. typhi across all tested formulations. These findings suggest that the taro flake products complied with established microbiological safety standards. The taro flakes production process used in this study involved heat treatment, which contributed to reducing the risk of bacterial contamination. Furthermore, the low moisture content of the final product may have involved in enhancing microbial stability during storage by inhibiting bacterial growth.
However, the total plate count (TPC) showed a large number of colonies that could not be accurately measured. This outcome implies the possibility of secondary contamination, potentially introduced during post-processing steps such as packaging or due to suboptimal quality of packaging materials. Therefore, packaging and sanitation during distribution are crucial aspects that require further attention to ensure the product's microbiological quality is maintained (37).
Glycemic index evaluation
As presented in Figure 2, the positive control (glucose) was measured as 89 mg/dL at the 0th hour (GDP). Subsequently, at the 1st h, glucose levels elevated to 113.2 mg/dL, and 118.6 mg/dL was recorded at the 2nd h. In the negative control group, specifically using Na CMC, the glucose level was measured at the 0th hour as 61.5 mg/dL. Then, at the 1st hour, the value decreased to 55.6 mg/dL, and a further decline to 50.6 mg/dL was observed at the 2nd hour. The use of Na CMC as the negative control group was intended as a suspending agent to facilitate oral administration of the flakes. Na CMC at 0.1% is widely reported to be inert and does not influence glucose metabolism, thus serving as an appropriate vehicle control (38). In the case of F1 sample (C. esculenta L. ) exposed to a temperature of 40 °C, the initial glucose level at the 0th h was measured to be 89.8 mg/dL. Subsequently, it reduced to 72.6 mg/dL in the 1st h, and 65.8 mg/dL was recorded in the 2nd h. In F2 dried under 60 °C, the glucose level was 68.8 mg/dL at the 0th h, then a drop to 64 mg/dL occurred in the 1st h, and 58.4 mg/dL was measured in the second hour. In F3 subjected to 80 °C, the glucose level was measured at the 0th hour as 69 mg/dL, which decreased to 64.8 mg/dL at the 1st h, and finally to 60 mg/dL at the 2nd h. The results indicated that glucose response decreased consistently across all taro flake samples subjected to different drying temperatures. In the analysis of F4 (wheat flour), the glucose level was measured at the 0th h as 85.8 mg/dL, decreasing to 73 mg/dL at the 1st h, and then to 68.4 mg/dL at the 2nd h. Moreover, the AUC calculation for glucose, F1, F2, F3, and F4 generated the following results 105.35; 38.75; 15.95; 17.63; and 8.45, respectively.
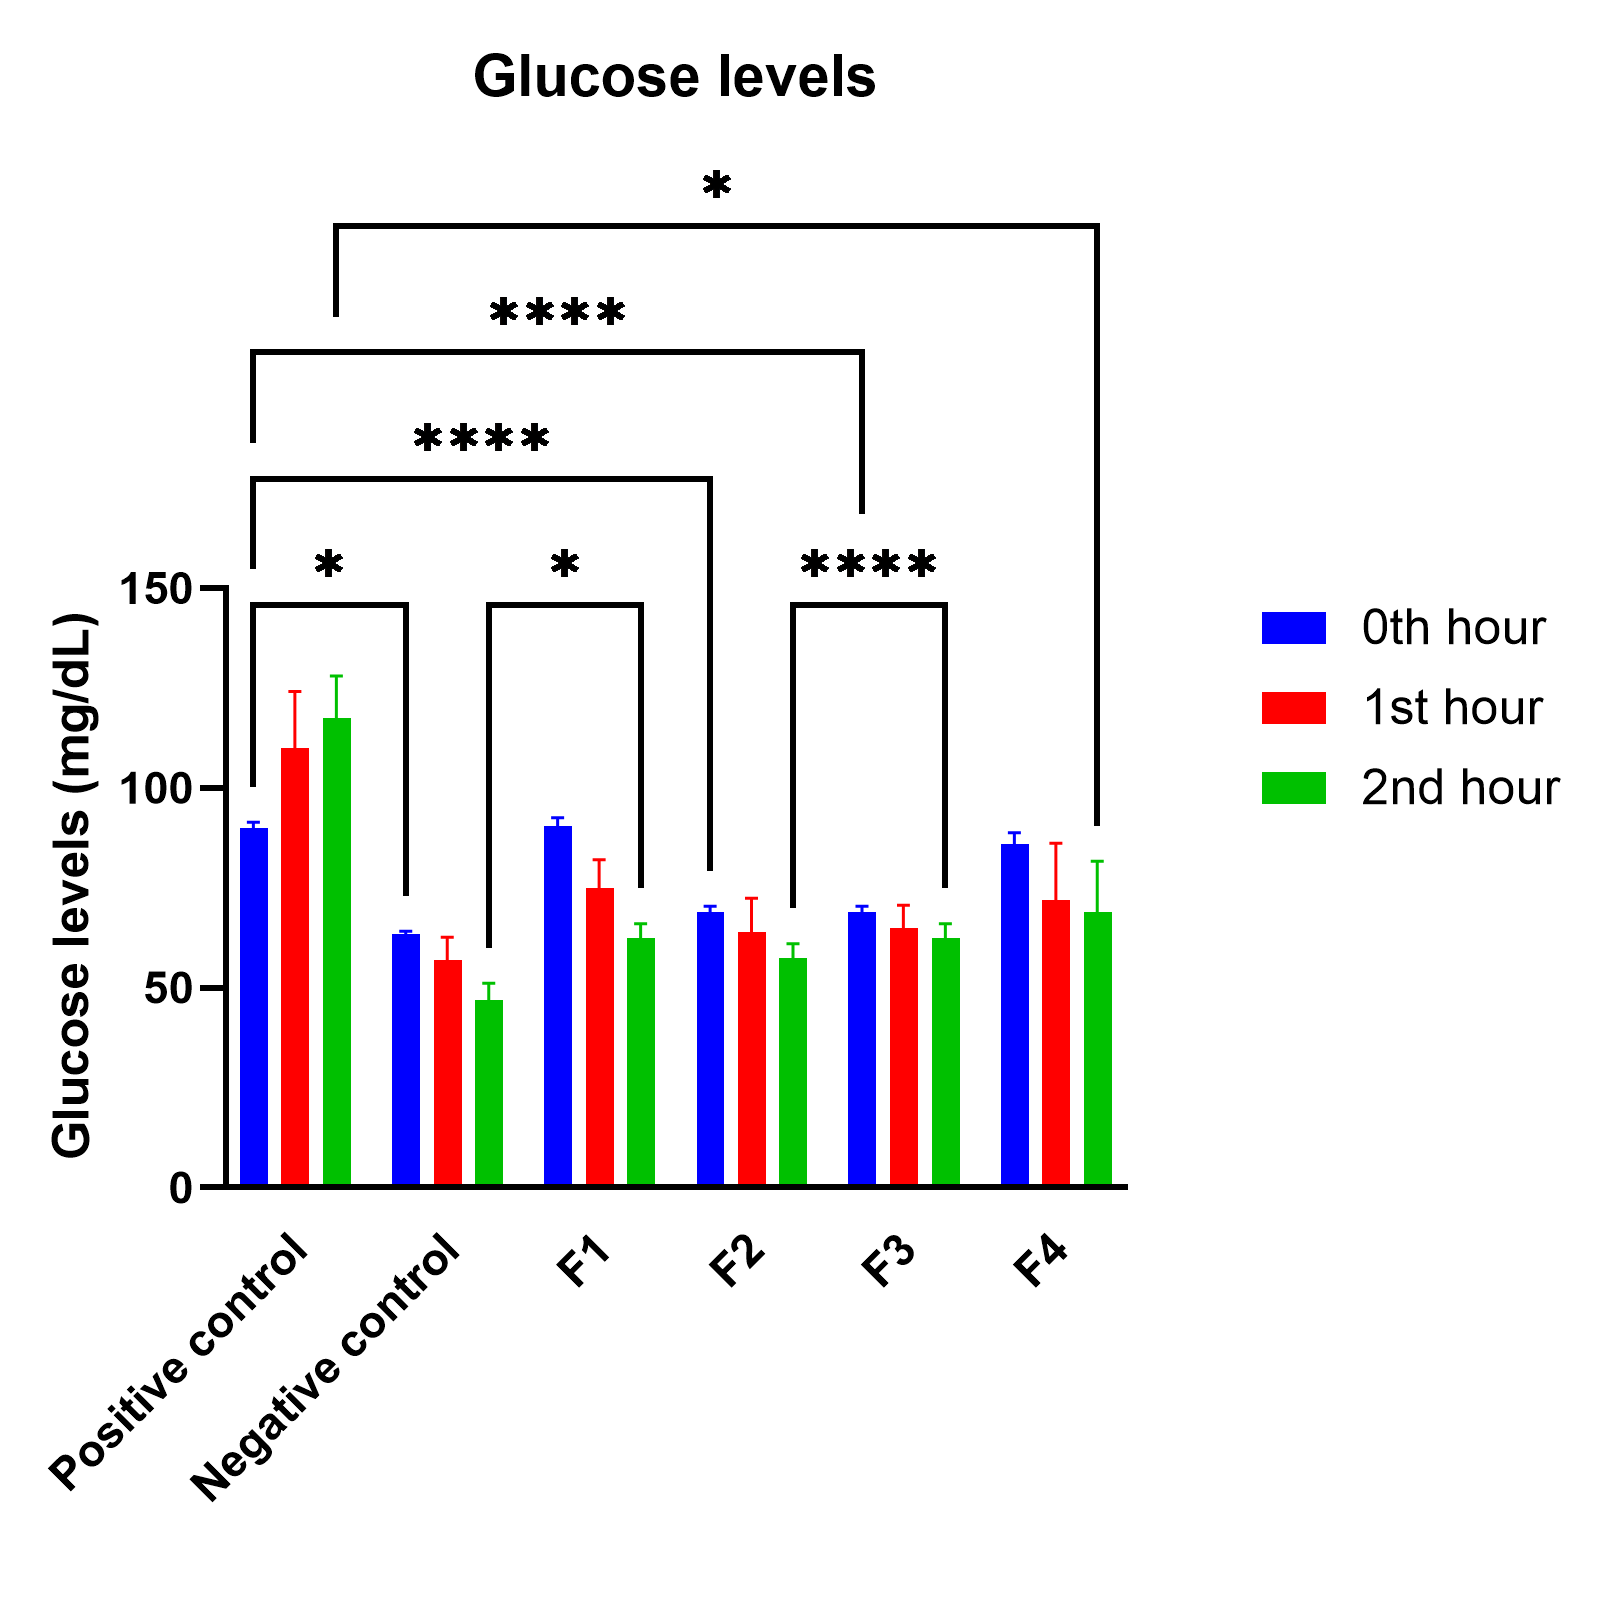
According to Table 3, the glycemic index values for F1, F2, F3, and F4 were 36.8; 15.1; 16.7; and 36.5, respectively, classifying all samples under the low category. This phenomenon can be attributed to the presence of fiber in Taro tubers capable of influencing the incidence of low glycemic index (39, 40). Moreover, the variation of glycemic index values among drying temperatures may be explained by structural modifications of starch granules: moderate drying at 60 °C (F2) likely preserved resistant starch fractions more effectively than at 40 °C or 80 °C, resulting in the lowest GI. Similar results were reported by Nayak et al. , 2014, who demonstrated that processing temperature significantly influences starch gelatinization, thereby altering glycemic responses (41). The low GI observed in wheat flakes (F4, GI = 36.5) aligns with findings from Kumar & Prabhasankar, 2014, who categorized wheat-based products as low to medium GI depending on processing method (42). This suggests that both taro and wheat flakes could be considered suitable carbohydrate sources for diabetic patients. Similarly, the statement correlates with the results of Vlachos et al. (2020) showing that the consumption of food comprising a low glycemic index can effectively enhance glycemic control in individuals with type 2 DM by decelerating carbohydrate absorption (43). Food with a low glycemic index is digested and converted into glucose gradually, then absorbed slowly in the body to ensure relatively lower peak sugar levels.
| Sample | Glycemic index value | Category |
|---|---|---|
| Glucose | 100 | High |
| F1 | 36.8 | Low |
| F2 | 15.1 | Low |
| F3 | 16.7 | Low |
| F4 | 36.5 | Low |
Conclusion
In conclusion, this study showed that taro tubers (C. esculenta L. ) could be transformed into flakes as a feasible alternative food product for individuals with diabetes mellitus (DM). Among the three formulas developed, F2 dried at 60 °C during the production process was acknowledged as the most favorable due to the low glycemic index value of 15.1. Also, F1 and F3 had low glycemic index values of less than 55, specifically 36.8 and 16.7, respectively. We recommend F2 (dried at 60 °C) as the lead formula for further development and potential commercialization because it combines the lowest GI (15.1) with the best overall acceptability (taste, color, texture). These flakes may be used to improve low-GI snack options and dietary adherence among people with DM. Further research should validate glycemic responses in a larger human trial and complete nutrient profiling (macro- and micronutrients, sodium, sugars), including glycemic load per serving. The effects on long-term glycemic control and real-world consumer acceptance warrant further investigation, and future studies should also assess shelf-life and packaging stability.
Declarations
Acknowledgment
Acknowledgments were conveyed to the Department of Pharmacy, Faculty of Mathematics and Natural Sciences, Tadulako University, which has facilitated the administration of this research, as well as to friends and students who have helped a lot in the research process until this research was published.
Conflict of Interest
The authors declare no conflicting interest.
Data Availability
Not applicable
Ethics Statement
The animal research protocol has been approved by the Institutional Review Board or Ethics Committee (Faculty of Medicine, Tadulako University) (2667/UN28.1.30/KL/2022 and date of approval on 27th April 2022).
Funding Information
Research grant funded through the Featured Research under the National Budget Allocation (DIPA) No. 1197/UN28.2/PL/2023.
References
- DeFronzo RA, Ferrannini E, Groop L, Henry RR, Herman WH, Holst JJ, et al. Type 2 diabetes mellitus. Nat Rev Dis Primers. 2015;1(1):1–22.
- Minari TP, Tácito LHB, Yugar LBT, Ferreira-Melo SE, Manzano CF, Pires AC, et al. Nutritional strategies for the management of type 2 diabetes mellitus: A narrative review. Nutrients. 2023;15(24):5096.
- MacLeod JS, Franz MJ. Macronutrients and nutrition therapy for diabetes. Nutr Ther. 2017:17.
- Pandya A, Mehta M, Sankavaram K. The relationship between macronutrient distribution and type 2 diabetes in Asian Indians. Nutrients. 2021;13(12):4406.
- Kabir M, Oppert JM, Vidal H, Bruzzo F, Fiquet C, Wursch P, et al. Four-week low-glycemic index breakfast with a modest amount of soluble fibers in type 2 diabetic men. Metabolism. 2002;51(7):819–26.
- Zhou Z, Ye F, Lei L, Zhou S, Zhao G. Fabricating low glycaemic index foods: Enlightened by the impacts of soluble dietary fibre on starch digestibility. Trends Food Sci Technol. 2022;122:110–22.
- Li C, Hu Y. In vitro and animal models to predict the glycemic index value of carbohydrate-containing foods. Trends Food Sci Technol. 2022;120:16–24.
- Kaur B, Koh M, Ponnalagu S, Henry CJ. Postprandial blood glucose response: Does the glycaemic index (GI) value matter even in the low GI range? Nutr Diabetes. 2020;10(1):15.
- Singh M, Manickavasagan A, Shobana S, Mohan V. Glycemic index of pulses and pulse-based products: A review. Crit Rev Food Sci Nutr. 2021;61(9):1567–88.
- Nweze CC, Nebechukwu EW, Bawa MY. Dietary fiber and risk of coronary heart diseases. GSC Adv Res Rev. 2021;9(3):1–9.
- Temesgen M, Retta N. Nutritional potential, health and food security benefits of taro (Colocasia esculenta): A review. Food Sci Qual Manag. 2015;36.
- Yantih N, Mulatsari E, Sumiyati Y, Sari IP, Qisthiara C, Prastica A, et al. Nutritional analysis of C. esculenta L. tubers aqueous extract and comparative analysis with existing literature. Sci Phytochem. 2023;2(2):40–7.
- Lantemona H, Boka RY. A nutrient analysis of various taro varieties in the Sangihe Islands region. Contrib Cent Res Inst Agric. 2024;18(1):32–9.
- Banti M, Atlaw T, Urugo MM, Agza B, Hailu D, Teka TA. Characterization of taro (Colocasia esculenta) genotypes for nutrients, anti-nutrients, phytochemical composition, and antioxidant potentials in Southwest Ethiopia. J Agric Food Res. 2025;19:101591.
- Rachmawati SD, Yulistiani R, Jariyah J. Characteristics of flakes from Kepok banana flour and black rice flour with variation of steaming time. Asian J Appl Res Community Dev Empower. 2024:72–80.
- Shabayek DA, Rimbawan R, Budijanto S. The potential of red kidney beans and brown rice-based flakes for breakfast to reduce obesity. 2022.
- Olorunsogo S, Adejumo B. Development and statistical optimization of flakes from selected local food ingredients. Aksaray Univ J Sci Eng. 2023;7(2):40–52.
- Surahman D, Ekafitri R, Rahman T, Cahyadi W, Setyadi D, Astro H, et al., editors. Organoleptic characteristics of banana flakes based on maturity level of banana (Musa paradisiaca cv. Ambon). In: IOP Conf Ser Earth Environ Sci. 2022.
- Daniels E, Faridah DN, Wulandari N. Development of sweet corn and red beans-based low-glycemic index flakes. Braz J Food Technol. 2024;27:e2023148.
- Kusumah NAF, Widjiati W, Puspitasari Y, Tyasningsih W, Wardhana D, Permatasari DA, et al. Comparison of total number of bacteria in raw milk Friesian Holstein cow based on milking techniques using total plate count (TPC) test. Int J Sci Adv. 2023;4:1–7.
- Thapa R, Thapa D, Chapagain A. Prevalence of Escherichia coli and Salmonella spp from chicken meat samples of Bharatpur, Chitwan. J Inst Agric Anim Sci. 2020:257–67.
- Hanum G, Kurniawati A, Normaliska R. AQ-11 analysis total plate count (TPC) Escherichia coli and Salmonella sp. on frozen beef imported through Tanjung Priok Port. Hemera Zoa. 2018.
- Ratnaningsih N, Harmayani E, Marsono Y. Physicochemical properties, in vitro starch digestibility, and estimated glycemic index of resistant starch from cowpea (Vigna unguiculata) starch by autoclaving-cooling cycles. Int J Biol Macromol. 2020;142:191–200.
- Wang L, Guo J, Zhong X, Zhang J, Sheng Y, Lai Q, et al. Repetitive blood sampling from the subclavian vein of conscious rat. J Vis Exp. 2022;180:e63439.
- Gagnon RC, Peterson JJ. Estimation of confidence intervals for area under the curve from destructively obtained pharmacokinetic data. J Pharmacokinet Biopharm. 1998;26:87–102.
- Liu Q, Donner E, Tarn R, Singh J, Chung HJ. Advanced analytical techniques to evaluate the quality of potato and potato starch. In: Advances in potato chemistry and technology. 2nd ed. Cambridge (MA): Elsevier; 2009. p. 221–48.
- Tabassum F, Alam Khan IA, Niamatullah SK, Khan I, Zubair M, Zafar M, et al. Determination of glycemic indices and glycemic loads of various types of cereal foods. 2006.
- Lee JJL, Chan B, Chun C, Bhaskaran K, Chen WN. A preparation of β-glucans and anthocyanins (LoGiCarb™) lowers the in vitro digestibility and in vivo glycemic index of white rice. RSC Adv. 2020;10(9):5129–33.
- Muzakar S, Chairani DP, Listrianah O. Benefit dietary fiber snack for diabetes mellitus patients type 2 in Palembang population. [Unpublished manuscript].
- Tanaviyutpakdee P, Butryee C, Wimonperapattana W, Mankong P, Srianujata S. Risk assessment of aspartame, acesulfame-K, and sucralose exposure from food and beverages in Thai population. Thai J Toxicol. 2021;36(1):113–30.
- Singh J, Sarkar P. Understand and quantify consumers’ cognitive behavior for the appropriateness features of product aesthetics through the eye-tracking technique. Int J Interact Des Manuf. 2023:1–34.
- Kathuria D, Gautam S, Thakur A. Maillard reaction in different food products: Effect on product quality, human health and mitigation strategies. Food Control. 2023;153:109911.
- Anandito R, Oktaliana M, Nurhartadi E, editors. Formulation of emergency food in flakes form made from proso millet flour (Panicum miliaceum) and snakehead fish (Channa striata)-tempeh flour koya. In: IOP Conf Ser Earth Environ Sci. 2019.
- Anandito R, Purnamayati L, editors. Breakfast cereal in flakes form based on millet flour and snakehead fish koya. In: IOP Conf Ser Earth Environ Sci. 2021.
- Putri RAN, Rahmi A, Nugroho A. Cereal flakes from Ipomoea batatas and Setaria italica as emergency food: Chemical, microbiological, and sensory properties during storage. J Pangan Agroind. 2021;9(4):227–32.
- BPOM. Maximum limits for microbial contamination in processed foods. Jakarta: Badan Pengawas Obat dan Makanan; 2019.
- González-Fandos E, Giménez M, Olarte C, Sanz S, Simón A. Effect of packaging conditions on the growth of microorganisms and the quality characteristics of fresh mushrooms (Agaricus bisporus) stored at inadequate temperatures. J Appl Microbiol. 2000;89(4):624–32.
- Panjaitan RGP. Anti-diabetic activity of the red dragon fruit peel (Hylocereus polyrhizus) ethanol extract against diabetic rats. Pharmacogn J. 2021;13(5).
- Wolever T. Relationship between dietary fiber content and composition in foods and the glycemic index. Am J Clin Nutr. 1990;51(1):72–5.
- Arya S, Shakya NK. High fiber, low glycaemic index (GI) prebiotic multigrain functional beverage from barnyard, foxtail and kodo millet. LWT. 2021;135:109991.
- Nayak B, Berrios JDJ, Tang J. Impact of food processing on the glycemic index (GI) of potato products. Food Res Int. 2014;56:35–46.
- Kumar SB, Prabhasankar P. Low glycemic index ingredients and modified starches in wheat-based food processing: A review. Trends Food Sci Technol. 2014;35(1):32–42.
- Vlachos D, Malisova S, Lindberg FA, Karaniki G. Glycemic index (GI) or glycemic load (GL) and dietary interventions for optimizing postprandial hyperglycemia in patients with type 2 diabetes: A review. Nutrients. 2020;12(6):1–18.