
REVIEW
Comparison of Microsampling and Conventional Sampling Techniques for Quantification of Warfarin in Blood Samples: A Systematic Review
Sciences of Pharmacy|Vol. 2, Issue 3, pp. 158-170 (2023)
CC BY 4.0-2023 Authors
Views
Downloads
Shares
Received
May 2, 2023Revised
Jun 6, 2023Accepted
Jul 5, 2023Published
Jul 6, 2023
Abstract
Warfarin is a vitamin K antagonist (VKAs) anticoagulant associated with interindividual patients’ response to therapy, narrow therapeutic index, and serious adverse drug events. Monitoring ensures efficacy and safety by measuring drug concentration in the bloodstream, which demands blood or plasma samples from patients through conventional sampling. Conventional sampling often requires invasive methods that may be uncomfortable for patients. Microsampling offers an opportunity to reduce the burden of multiple blood sampling on patients and simplifies the process of sample transportation and storage. This systematic review describes conventional and microsampling techniques for quantifying warfarin in human blood samples and the bioanalytical method employed to perform the analysis. Related studies (537) were screened from several databases and narrowed down into 12 eligible articles, which were then used to fulfill the purpose of this review in a narrative form. It is concluded that while there are still limited studies regarding the application of microsampling for warfarin quantification in patients, there has been evidence of comparable plasma and micro samples results, highlighting the potential for future development of routine monitoring using the microsampling technique.
Introduction
Thromboembolism is a hemostatic disorder associated with a cardiovascular disorder that can cause death (1). It is characterized by the development of thrombus or blood clots in the blood vessels, which can be dislodged, traveled through the blood vessel, and lead to embolism or blockage of a blood vessel (2). Death caused by thromboembolism is commonly associated with coronary artery disease, ischemic stroke related to atrial fibrillation, and pulmonary embolism. In 1856, Virchow postulated a triad of potential causes of thrombosis: stasis, intravascular vessel wall injury, and hypercoagulability (3). Antithrombotic agents can prevent thromboembolism through the inhibition of coagulation (4).
For about 70 years, warfarin has been one of the world's most prescribed anticoagulants. The last decade has seen a significant increase in the prescription of novel direct oral anticoagulants (DOACs) such as apixaban, rivaroxaban, dabigatran, and edoxaban, which is associated with better safety profile and comparable efficacy to warfarin. Nevertheless, there is still an issue that needs to be addressed with the use of DOACs, regarding the limited choice of reversal agents for DOACs (5), the concern of safety in some patients with specific comorbidities (6), and the lack of standardized testing for monitoring of DOACs (7). Although there is a constant decrease in the use of warfarin, along with the discontinuation of the brand name Coumadin in the USA in 2020, it remains the mainstay of anticoagulant therapy in several countries (8, 9).
Evidence of interindividual variations in patients’ responses to the therapy has been observed, causing difficulty in VKAs therapy management. Inadequate coagulation control can lead to episodes of thromboembolism or hemorrhage (10). To prevent this, therapeutic drug monitoring (TDM) is necessary to maintain adequate anticoagulation effects. Prothrombin time (PT) is the conventional test commonly used in therapeutic drug monitoring for patients on VKAs therapy to predict the pharmacodynamic effect and assess the bleeding status of patients. The standard reporting of the PT ratio is expressed as International Normalized Ratio (INR) (11). However, this test is unsuitable for monitoring several instances, such as patient adherence, drug interaction effect, toxicity, and drug resistance. Therefore, it is also essential to ensure that the drug concentration in the bloodstream is appropriate, as another method of TDM (12). This can be achieved by sampling the blood from patients through conventional or microsampling techniques and analyzing the samples using validated bioanalytical methods.
Microsampling is a procedure to collect minute samples (< 100 mL) from a human body for analysis in a minimally invasive manner (13). Although it can be used for any biological fluids, its current application is mostly limited to dried blood samples. There has been an interest in implementing microsampling approaches due to its benefit, which include more convenient sample collection, the ability to obtain samples from pediatric or vulnerable subjects, and a simplified handling process (14). Dried blood spots (DBS) is the most established microsampling approach, which has been used widely for neonatal screening since the 1960s (15). DBS assays have been developed for many medicines over the past decade, such as anticancer drugs (16-18), tacrolimus (19, 20), cardiovascular drugs (21), and antidiabetic drugs (22-24). These last few years also saw the development of volumetric absorptive microsampling (VAMS). This novel dried blood sampling approach enables more accurate and precise blood volume collection than DBS (25). Antibiotics (26), antiseizure medication (27), and paracetamol (28) were among the drugs that have been investigated using VAMS.
We systematically reviews warfarin sampling techniques in human blood, comparing various methods and bioanalytical approaches. No prior systematic review has covered conventional and unconventional sampling techniques for bioanalysis. In this study, records were systematically selected and analyzed.
Methods
Study Protocol
The Preferred Reporting Items for Systematical Reviews and Meta-Analysis (PRISMA) statement is used as a guideline to conduct the literature search (29). For the search strategy, the following descriptors were employed: “warfarin”, “therapeutic monitoring”, “human”, and “chromatography”, using the Boolean operator. The search was conducted in ScienceDirect and PubMed/Medline databases. The potential studies were screened according to the inclusion and exclusion criteria without no restrictions regarding the publication date. A manual search was also conducted using the lists of references from the eligible articles to retrieve additional articles.
Inclusion and Exclusion Criteria
The inclusion criteria for this article review were: (1) Experimental and review studies written in English, (2) Studies that explained sampling techniques and analytical methods of warfarin and its metabolites in human blood samples using the chromatography method.
The exclusion criteria were (1) studies written in other languages besides English, (2) non-related studies, (3) duplicate publications, (4) articles not available as full-text, and (5) studies that also analyze other drugs besides warfarin.
Selection of Studies and Data Collection
All search results were collected and screened. All identified studies are assessed based on the title and abstract without using any specific data extraction form. The data are gathered independently according to the year of publication, study design, bioanalytical method development, and clinical application to patients or human volunteers.
Results and Discussion
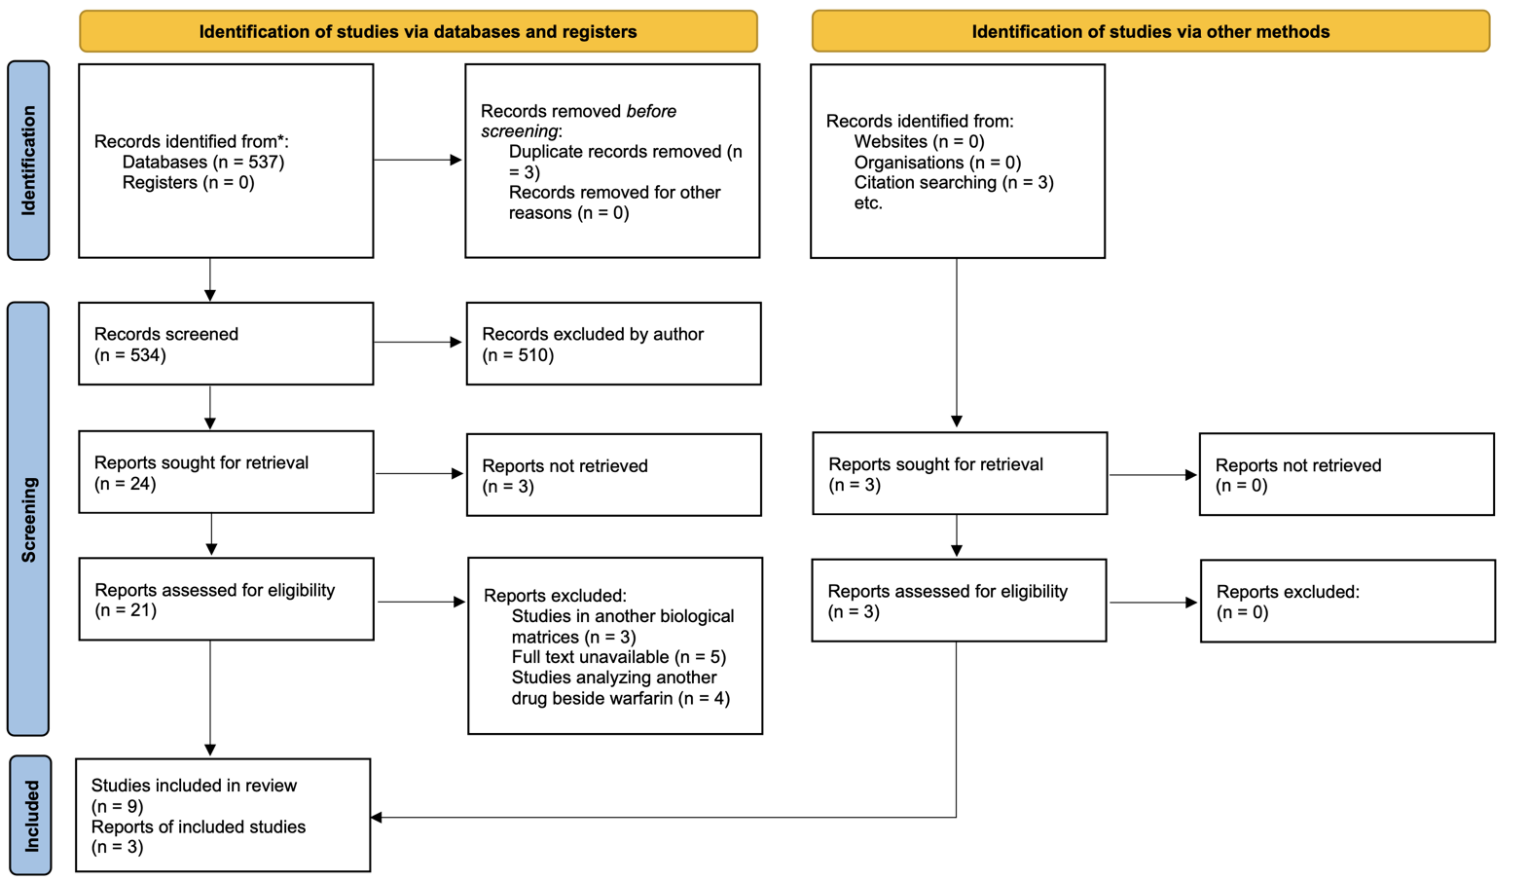
A total of 537 potentially relevant studies were identified through database searching. The studies were screened according to the inclusion and exclusion criteria. After the screening process, 9 articles were identified, meeting the inclusion criteria and were considered eligible for full review (30-38). Three articles were retrieved through citation searching from one eligible article (39-41). We have carefully reviewed and used those sources' data to prevent bias. Overall, we concluded that all 12 assessed studies were considered high-quality literature because they met the inclusion criteria and had a low risk of bias. The flowchart of the literature screening process can be seen in Figure 1.
Anticoagulants
Hemostasis is a process the human body undergoes to prevent blood loss during a bleeding episode. The equilibrium condition is maintained between clot formation and obliteration. This process is maintained through interaction involving the cellular components, namely platelets and vascular endothelium, and the coagulation cascade and fibrinolytic system (42).
A coagulation cascade is a complex model incorporating a sequential activation of proteolytic enzymes, also known as zymogens, and the interlinking of several pathways. The intrinsic pathway depends on contact activation by a negatively-charged surface involving the activation of coagulation factors XII, XI, IX, and VIII. The extrinsic pathway is started with the activation of tissue factor (also known as factor III) during endothelial damage and the activation of factor VII. The resulting end of these two pathways activates factor X, which initiates the common pathway. Factor X, its cofactor (Factor V), and calcium bind to form a prothrombinase complex, which converts prothrombin (factor II) into thrombin (factor IIa), which in turn activate fibrinogen (factor I) into fibrin (factor Ia), and with the help of stabilizing factor (factor XIII) leads to the formation of fibrin crosslink to generate a stable platelet plug/clot (43). Currently, available anticoagulants target one of these pathways.
Warfarin
Warfarin is the most commonly prescribed oral anticoagulant. Originally used as a rodenticide, warfarin was accepted for medical use in 1954 under the brandoumadin (44). Warfarin is a vitamin K antagonist that exerts its effect by competitively inhibiting vitamin K epoxide reductase (VKOR), an enzyme essential for converting vitamin K into an active form. As a cofactor in the activation of coagulation factors II, VII, IX, and X, as well as the coagulation regulatory factors Protein C and S (45), the decrease in activated vitamin K levels can reduce the synthesis of these proteins.
Warfarin is administered as a racemic mixture of R-warfarin and S-warfarin. Warfarin has a half-life of 36 to 42 hours and reaches maximum blood concentration 90 minutes after administration (46). Warfarin is extensively metabolized in the liver, mainly by CYP2C9, and each isomer undergoes a different pathway (47). Intra- and inter-individual variability has been observed during warfarin therapy, causing difficulty in determining the dose regimen for patients. In addition, warfarin also exhibits a narrow therapeutic index. Subtherapeutic and supratherapeutic warfarin dosages may lead to fatal adverse events (48). Patients receiving warfarin are at greater risk for bleeding, and exceeding the therapeutic index may lead to significant hemorrhage. Patients receiving warfarin should be closely monitored to prevent this adverse effect, and the dosage should be tailored accordingly. International Normalized Ratio (INR) is the standard laboratory parameter used to monitor anticoagulant therapy to ensure the safety and efficacy of the therapy (10).
Warfarin is a narrow therapeutic index drug that requires constant monitoring. Typical therapeutic drug monitoring (TDM) requires measuring pharmacokinetic or pharmacodynamic parameters. Selecting a specific pharmacokinetic or pharmacodynamic assay depends on intersubject variability (49). In the case of warfarin, the high variability of pharmacodynamic response necessitates using INR value to monitor the therapy's efficacy and aid the dose adjustment process (50). However, assessment of warfarin concentration in the bloodstream may be beneficial in some clinical situations where sudden and unexpected changes in INR value or patient’s response of unknown origin are observed. In cases such as drug interaction, the measurement of warfarin blood levels may help the physician decide if the increase or decrease of warfarin concentration corresponds to the history of medication and food recently taken by the patient. Warfarin blood levels can also be used to diagnose warfarin intoxication. Warfarin blood level could also be useful in determining patient adherence. Adherence is a major issue with long-term medication regimens (51), particularly requiring constant monitoring, such as warfarin. Self-report results can be unreliable at times, but analysis of warfarin blood level could confirm the result, allowing the physician to take measures to improve patient adherence and increase the therapy's efficacy. This analysis can further differentiate between adherence and resistance, correlating warfarin level to the patient’s response. Resistance can be attributed to acquired factors (drug interaction, non-compliance) or hereditary factors such as genetic polymorphism (52). Measuring the genotype of enzyme polymorphism and phenotype (warfarin and its metabolites concentration) may help the physician assign the patient's metabolizer status (fast, intermediate, poor) and design the algorithm to determine the optimal dose for patients to achieve better efficacy.
| Matrices and sampling techniques | Analytes | Analytical techniques | Extraction method | LLOQ | Recovery | Ref |
|---|---|---|---|---|---|---|
| Plasma, Conventional | Warfarin enantiomer | SFC-MS/MS | LLE | 13.6 ng/mL | 39% | (30) |
| Plasma, Conventional | Warfarin and alcohol metabolites | GC-MS | LLE | N. D. | N. D. | (31) |
| Dried blood spots, micro sampling | Warfarin and alcohol metabolites | LC-MS/MS | PPT | 0.014 ng/mL | 96-103% | (39) |
| Plasma, Conventional | Warfarin | LC-MS/MS | LLSMME | 0.999 µg/L | 88-93% | (32) |
| Plasma, Conventional | Enantiomer and hydroxy metabolites | LC-MS/MS | LLE | 10 nM | N. D. | (36) |
| Plasma, Conventional | Enantiomer and hydroxy metabolites | LC-MS/MS | PPT | 1.25 nM | 82.9-95.6 | (37) |
| Plasma, Conventional | Hydroxy metabolite | HPLC | SPE | 0.1 µg/mL | 88-93% | (38) |
| Plasma, Conventional | Hydroxy metabolites | HPLC | LLE, UF | 1.3 ng/mL | 89% | (35) |
| Plasma, Conventional | Enantiomer | LC-MS/MS | PPT | 50 ng/mL | 91.10-99.05% | (40) |
| Plasma, Conventional | Warfarin | HPLC | ALLME | 1.65-8.91 | 91.20-96.80 | (33) |
| Plasma, Conventional | Free and total warfarin | LC-MS/MS | PPT, UF | 0.25 ng/mL | 89.80% | (41) |
| Serum, Conventional | Warfarin enantiomers and hydroxy metabolites | MEKC-MS/MS | SPE | 0.1 µg/mL | 90.1-110.7% | (34) |
Nevertheless, the measurement of warfarin concentration in the blood is seldom used in monitoring. This is possibly caused by the lack of available assays to measure warfarin in blood samples. Developing a bioanalytical method to analyze warfarin in biological samples will enable the use of warfarin blood concentration for monitoring in a routine clinical setting. The method included in this review covered several bioanalytical methods to analyze warfarin in human blood samples.
Blood Sampling Technique
Blood samples from patients or healthy volunteers can be obtained through conventional or micro sampling. The Conventional method is commonly used to collect liquid blood samples such as whole blood, plasma, and serum. Although effective, this method is considered invasive and may be uncomfortable for patients. This leads to the development of a microsampling approach, characterized by a collection of smaller blood volume, which is then stored as dried samples. Dried blood spots (DBS) and volumetric absorptive microsampling (VAMS) are the two methods extensively investigated for clinical application as an alternative to conventional sampling. Table 1 explains samples and sampling techniques used to measure warfarin concentration described in the eligible studies.
Conventional Blood Sampling
The collection of blood samples by phlebotomy is the most common type of biological specimen collection (53). The blood is usually obtained from the median cubital vein in the upper arm, near the radial cutaneous vein. Tourniquet is applied to the arm, and the area will be cleansed with alcohol. Patients are asked to close their hands. After the alcohol has dried, venipuncture is performed with a suitable needle, and once the blood flow begins, patients will be requested to open their hands, the tourniquet released, and the blood will be collected using a tube (54). This method can be applied for plasma and serum sampling, which differs from the sample collection tube. The tube for plasma collection contains an anticoagulant, and the serum tube does not. This method is invasive and may lead to a low recruitment rate in clinical trials, especially pediatric patients. The quality of the phlebotomy will also directly affect the quality of the sample and the analysis result (55). In this review, ten studies have been described to use convenience sampling to analyze human plasma, and 1 study used convenience sampling to analyze serum.
Microsampling
Dried Blood Spots (DBS)
Traditionally used as a neonatal screening sampling method, dried blood spot (DBS) has gained attention as a tool for pharmacokinetic and toxicokinetic studies (56). The first recorded use of DBS was in the early 1960s when Robert Guthrie introduced this method for phenylketonuria screening in newborns using heel prick (15, 57). The blood can be obtained from finger pricks in pediatric and adult patients. The drop of blood is applied to the filter paper, which is then dried for about 2 to 3 hours. The spot is punched after the blood dries for 2 to 3 hours. It can be directly analyzed using suitable analytical techniques or stored and transported to an analytical laboratory before analysis. This method has been developed for other biological matrixes, such as plasma and urine, which are obtained similarly to DBS (58). The limitation of this method is related to the hematocrit (HCT) effect and homogeneity of the area, which may cause bias in the analysis. Although DBS assays have been developed for many medicines over the past decade, such as anticancer drugs (16-18), tacrolimus (19, 20), cardiovascular drugs (21), and antidiabetic drugs (22-24), the author only found 1 study that described the use of DBS for analysis in patients receiving warfarin therapy (59).
Volumetric Absorptive Microsampling
Volumetric Absorptive Microsampling (VAMS) is a method involving the absorption of a liquid sample into a substrate. The device comprises a plastic handler with a hydrophilic porous substrate on the tip (60). The sampling procedure is similar to DBS, in which blood can be directly applied to the tip and dried before being stored or transported for analysis. The volume of the sample absorbed depends on the properties and the amount of substrate, but unlike DBS, VAMS allowed the sample to be measured quantitatively. Another advantage of VAMS is that it can limit the hematocrit effect usually found on DBS samples, leading to different spot sizes on the paper and nonhomogeneity (61). The author finds no article related to using VAMS in the bioanalysis of warfarin.
Bioanalytical Method Development and Validation
Bioanalytical method development aims to define the design, operating conditions, limitations, and suitability of the method for its intended purpose and to ensure that it is optimized for validation. Before developing a bioanalytical method, a complete understanding of the analyte’s properties must be achieved. This includes physicochemical properties, in vitro and in vivo metabolism, protein binding, stability, and other properties that could affect the analytical method. Previous analytical methods already reported could be considered to design a suitable method.
Optimization of the method involves the condition and procedures related to analyte extraction and detection. During this phase, several conditions could be tested, such as the choice and concentration of extraction solvent, flow rate, and detection wavelength, to obtain the optimal bioanalytical method (62).
Bioanalytical Method Validation
Bioanalytical method validation is done to ensure the performance of the optimized method. Validation is usually performed according to guidelines from European Medicines Agency (EMA) (63) or the Food and Drug Administration (FDA) (64). The parameters tested in the validation are listed below:
Selectivity
Selectivity is done to verify that the analytical method can differentiate analyte and internal standard from interference or other components in the sample. Selectivity testing is done by analyzing six individual sources of a blank matrix. The acceptance criteria for selectivity is that the responses from the blank sample are less than 20% from the LLOQ analyte and less than 5% for internal standards (63, 64).
Carry-over
Carry-over has to be detected and minimized in analysis. Carry-over testing is done by injecting a blank sample after the high-concentration sample, calibration standard, or the upper limit of quantification (ULOQ). The acceptance criteria for carry-over is the percentage of carry-over should not exceed 20% of LLOQ. If carry-over cannot be avoided, the sample should not be chosen randomly, and the carry-over effect must be monitored throughout the analysis (63, 64).
Lower Limit of Quantitation (LLOQ)
The lower limit of quantification (LLOQ) is the lowest concentration value of the analyte that can still be calculated accurately and precisely. LLOQ defines the method's sensitivity and should be determined during method development. The LLOQ value of the sample must be five times greater than the blank and not higher than 5% Cmax (63, 64).
Calibration Curve
The calibration curve is the range of concentrations needed to analyze a sample according to the instrument's response. The quantitation range of the analytical method should be established during the method development. The calibration curve must contain at least a blank sample, zero sample (blank + IS), and six concentration levels, including ULOQ as the highest point and LLOQ as the lowest point of the quantitation range. The calibration curve must be reproducible and continuous. A calibration curve must be generated for each analyte if there is more than one analyte. The measured concentration must be within 15% of the actual concentration, except for LLOQ, which should be within 20%. At least 75% of calibration standards must meet these criteria in each run (63, 64).
Accuracy and Precision
Accuracy describes the closeness of the obtained concentration from the analysis with the actual concentration value, expressed in percentage. Precision describes the repeatability of the analyte measurement and is expressed as a coefficient of variation (CV). Accuracy and precision are analyzed using quality control (QC) samples in four concentrations, namely the LLOQ, QCL (three times the LLOQ), QCM (30–50% of calibration curve range), and QCH (75% of the ULOQ). Accuracy and precision must be done in at least five replicates: within-run (single run) and between-run (at least three runs in two days). The acceptance criteria for accuracy is that the concentration must be within 15% of the actual concentration, except for the LLOQ (within 20%). The acceptance criteria for precision validation is the CV must not exceed 15% for the QC sample and 20% for the LLOQ (63, 64).
Dilution Integrity
Dilution of samples should not affect accuracy and precision. Dilution integrity testing is done by spiking the matrix with the analyte concentration above the upper limit of quantification (ULOQ), which then dilutes with the blank matrix. The analysis is done in five replicates for each dilution factor. The acceptance criteria are that the accuracy and precision value must be within 15% (63, 64).
Matrix Effect
The matrix effect is investigated when using mass spectrometry to investigate the effect of ion suppression or ion enhancement on the concentration of the analyte. Matrix effects are tested using a minimum of 6 blank matrixes from 6 individual sources. The matrix factor of the analyte and the internal standard is calculated from the peak area of a spiked matrix with the peak area of the analyte in the standard solution. The testing must be conducted at low and high concentrations (maximum three times LLOQ and close to ULOQ). The acceptance requirement is the CV should not exceed 15% (63, 64).
Stability
Stability testing is carried out to ensure that the process of preparation, analysis, and storage conditions of samples does not affect the concentration of the analyte. Stability must be ensured at every stage of the analytical method. Stability is evaluated using QCL and QCH, which are analyzed immediately after preparation and applied storage conditions. A calibration curve is used for the stability test of QC samples by comparing the obtained concentration with the analyte concentration. The acceptance criteria are that the %diff for each concentration level must not exceed 15%.
The stability condition that must be evaluated is as follows:
- Stability of the stock solution, working solutions, and internal standard
- Freeze and thaw stability of the analyte on the matrix
- Short-term stability of the analyte at room temperature or analysis temperature
- Long-term stability of the analyte under storage conditions in the freezer
In addition, the following tests could be done if applicable:
- Stability of the sample at room temperature or storage conditions during analysis
- Bench-top stability
- Autosampler stability (63, 64).
Most of the studies included in this systematic review have described a full validation of the analytical method. Lv et al. performed validation according to China Pharmacopoeia alongside FDA guidelines. Ghimenti et al. and Lomonaco et al. performed validation according to the IUPAC guideline (65). Because some of the studies were conducted before the publication of FDA guidelines in 2018, validation was conducted according to the guidelines then. Nevertheless, these studies have described a satisfactory validation result. One study only described a standard curve (66). Still, owing to the outdated year of the publication, a method validation guideline had not been established at that time. Two studies did not describe validation, primarily because the studies are developing a novel microextraction method using warfarin as the model drug (32, 67).
| Extraction Protocol | Ref (s) |
|---|---|
| 0.2 mL plasma + 20 µL IS + 150 µL 1 N sulfuric acid and 1.0 mL ethyl ether into a 96-well plate. The mixture was vortexed for 10 min, then centrifuged at 5200 rpm for 3 mins. 0.4 mL ether supernatant transferred and evaporated to dryness, reconstituted with 0.2 mL methanol. | (30) |
| 250 µL plasma + 0, 2 mL NaOH 1 M + 4.0 mL ether. The mixture was vortexed for 30 s and centrifuged. Aqueous phase acidified with 0.5 mL HCl 2 M + ether 4 mL containing warfarin and warfarin alcohol, vortexed for 30 s and centrifuged. The ether extract was evaporated and derivatized with an ether solution of diazomethane. | (31) |
| DBS disk + 500 µL methanol-acetonitrile (3: 1 v/v). The mixture was vortexed for 1 min and centrifuged at 5.000 rpm for 5 mins. 200 µL supernatant was diluted five folds with 0.1% formic acid. | (39) |
| LDH-MMM bent into a U shape, injected with 25 µL DES and immersed into the sample. Extraction was done for 30 mins with a magnetic stirrer at 1500 rpm. Extraction solvent was collected, and 25 µL desorption solvent (acetonitrile) was injected into the LDH-MMM. Extraction and desorption solvent was combined and injected into the HPLC system | (32) |
| 50 µL plasma, spiked with IS. Ice-cold 0.2% formic acid (190 µL) + ice-cold 0.2% formic acid in acetonitrile (1000 µL) were added. Samples were precipitated at 4°C for 30 mins and then centrifuged. 1000 µL supernatant was dried and reconstituted in the mobile phase. | (36) |
| 50 µL plasma + 190 µL methanol-water (7: 1 v/v) containing 30 nM IS. Vortexed 10 s, centrifuged 225 g 15 mins. Supernatants were evaporated under nitrogen for 45 mins and reconstituted with 100 µL methanol-water (15: 85 v/v) | (37) |
| 1 ml plasma + 10 µL IS. After column conditioning with 1% methanol pH 2.8, the analyte and IS were eluted from the C18 column using 2 ml acetonitrile. The organic phase was evaporated under nitrogen gas. Reconstituted with 200 µL water. | (38) |
| 500 µL plasma + 2 ml H2SO4 0.5 M + 500 µL ethanol + 4 mL dichloromethane-hexane (1: 5 v/v). The mixture was vortexed for 30 s and centrifuged at 5000 rpm for 5 mins. The organic phase evaporated, and the residue was reconstituted in 1 mL PBS 25 mM. | (35) |
| 45 µL plasma + 5 µL IS + 5 µL methanol, vortexed 10 s.150 µL acetonitrile was added, vortexed for 3 mins and centrifuged 10 mins at 14.000 rpm. 20 µL supernatant diluted with 380 µL mobile phase. | (40) |
| 60 µL hydrophobic DES (borneol: decanoic acid 1: 3) was added to the sample. The mixture was repeatedly pulled and pushed into the extraction vessel 15 times with a 2 mL glass syringe. The mixture was centrifuged at 6000 rpm for 10 mins to separate the DES-rich phase. | (33) |
| 200 µL plasma + 20 µL IS, vortexed 10 s. 800 µL acetonitrile was added and vortexed for 1 min, centrifuged at 20.000 rpm for 5 mins. The supernatant was evaporated under a nitrogen stream and reconstituted in 100 µL mobile phase, vortexed 1 min and centrifuged at 3000 rpm for 5 mins. | (41) |
| MAX cartridge conditioned with 2 mL methanol, followed by 2 mL water. 250 µL plasma + 2.5 µL IS + 250 µL 10% perchloric acid/ 4% phosphoric acid, vortexed 30 s, centrifuged 10 mins at 1000 rpm. 450 µL supernatant loaded on the cartridge, washed with 2% NH4OH and 2 mL of water. Analytes were eluted with 2 mL acetonitrile-methanol-formic acid (50: 50: 5 v/v/v). Eluent was collected, evaporated, and reconstituted with 50 µLacetonitrile-water (40: 60 v/v). | (34) |
| Note: *DES: deep eutectic solvent, IS: internal standard, LDH-MMM: layered double hydroxides mixed matrix membrane; PBS: phosphate buffer saline. | |
Sample Preparation
Sample preparation is vital in bioanalysis, extracting analytes from matrices to eliminate interference and prevent column blockage. The chosen method must maintain sample integrity, ensuring accurate in vivo concentration representation (68). Table 2 summarizes the sample preparation process in each article.
Commonly used extraction method includes protein precipitation (PPT), liquid-liquid extraction (LLE), and solid phase extraction (SPE). LLE is mainly used to extract enantiomer warfarin and its metabolites, usually using organic phase alkyl ether such as methyl tert-butyl ether and aqueous phase. PPT is also favorable because of the high recovery and ability to remove protein components in plasma or blood samples. Water-miscible organic solvents and acids are the most commonly used solvent for PPT (69). The disadvantage of PPT is that it may increase the chromatography system's back pressure because soluble plasma contents are bound to the column's stationary phase (68). SPE used a sorbent material in a cartridge device to separate various sample components based on their physicochemical properties. The analyte or impurity from the sample is eluted from the cartridge using suitable solvents. This method is very effective and applicable to a wide range of matrices. It demonstrates high recovery and requires minimum pretreatment (70), but the technique is more complex and costly than LLE or PPT. LLE or PPT is more cost-effective, but the process is more laborious and warrants the high usage of organic solvent, producing more toxic waste. Recent advances in sample preparation are aimed toward green chemistry, with the development of the microextraction method and the usage of a sustainable natural solvent such as deep eutectic solvents as described in the studies done by Jafari et al. and Majidi et al. (32, 33). These studies could lead to reduced analysis costs, a more efficient extraction process, and a more environmental-friendly method.
According to the literature review from 12 studies, the bioanalytical method has been developed to study the concentration of warfarin in human blood samples such as plasma, serum, and DBS. The concentration of warfarin in the clinical application was well within the calibration range. Most of the studies use LC-MS/MS, which leads to higher sensitivity and selectivity of analysis. But in conditions where the LC-MS/MS method cannot be applied because of the high operational cost and the unavailability of a skilled operator, HPLC can be used as a substitute (71, 72).
Clinical Application of Warfarin Bioanalytical Method
Analysis of plasma from healthy volunteers or patients receiving warfarin therapy has been conducted for several purposes, such as pharmacokinetic study (41). This is particularly useful for assessing the absorption, distribution, metabolism, and excretion of the drug in the body and is largely used in bioequivalence studies. Another study used plasma samples to conduct a drug interaction study (30, 40). By analyzing the pharmacokinetics of a drug after co-administration with another drug, herbal supplement, or food, a relationship can be determined, whether the co-administration causes inhibition or induction of the related metabolizing enzyme, which may result in altered pharmacodynamics. Four studies used plasma (35-38), and one study has also been found to use patients’ serum to perform metabolic profiling of warfarin (34). With its wide variabilities in dose-response relationships and multiple drug interactions, warfarin remains one of the top ten drug-related causes of serious adverse drug events. Analysis of warfarin and its metabolites in blood samples will provide a better understanding of warfarin metabolism, which largely involves cytochrome P450. Further studies regarding the polymorphism of CYP enzymes associated with warfarin metabolic conversion will allow physicians to adjust dosage accordingly.
Few studies still use the microsampling method for quantifying warfarin in blood samples. Several studies have applied DBS in studies using laboratory animals, but the author only found one study that used DBS to analyze warfarin levels in human patients (39). The article also described an attempt to evaluate the correlation between DBS and plasma sample concentration. The result showed a good correlation with correlation coefficients r ≥ 0.95, demonstrating the applicability of DBS sampling as an alternative to plasma for measuring warfarin concentration in the bloodstream.
The microsampling method offers more advantages than the conventional sampling method. It is minimally invasive, which benefits patients subject to frequent blood tests for monitoring during therapy. Microsampling can also be useful in pharmacokinetic and bioequivalence tests, in which blood was collected for several points (12-18 times) over time. In the case of warfarin, which must be monitored constantly for the duration of the therapy, the microsampling method may be beneficial and more convenient to the patient. When the patients cannot go to the laboratory, they can collect the sample alone. The technique is simpler, and some analytes in the dried blood samples, such as DBS and VAMS, tend to be more stable than other biosampling techniques (73). Most DBS and VAMS studies showed that the samples were stable in room temperatures, easing the process of sample transportation and storage compared to plasma samples that must be stored at -20ºC. One analytical method for human DBS samples of warfarin has been demonstrated to meet the validation criteria, with intra- and inter-day precision variation resulting in lower than 10% and accuracy within 96-103% of the real concentration (39). In addition, the method was successfully applied in vivo to patients receiving warfarin, and upon comparison with plasma samples, a good correlation was described between DBS and plasma samples, demonstrating that the DBS method is suitable to substitute plasma samples. The author finds no article related to using VAMS in the bioanalysis of warfarin. This indicated that using VAMS as a sampling means for therapeutic drug monitoring (TDM) has not been explored yet and highlights potential for future development.
Conclusion
This systematic review summarizes sampling techniques to quantify warfarin in human blood samples and the bioanalytical method used to analyze the samples. The authors found no systematic review comparing conventional and unconventional sampling techniques for bioanalytical purposes thus far.
Several bioanalytical methods have been employed to perform analysis of warfarin in blood samples through the means of conventional sampling and micro sampling. The conventional sampling method is primarily used to obtain plasma samples from patients or healthy volunteers but is considered invasive. Microsampling offers simpler and less invasive methods, enhances the stability of the analyte, and easier sample handling for storage or transportation before analysis. However, the literature describing microsampling, namely DBS, has been limited compared to the plasma analysis. In addition, the author found no literature that mentions volumetric absorptive microsampling (VAMS) for analysis of warfarin.
In the last few years, bioanalysis has seen increased interest in using microsampling as a routine sampling technique in clinical settings. While the authors only found one study that included the comparison of microsampling to a conventional approach using plasma samples, the results showed comparable pharmacokinetic data, further underlining the possibility of microsampling as a substitute for conventional blood sampling. Ongoing investigations in microsampling bioanalysis are important to improve confidence in using microsampling techniques to support clinical research before introducing microsampling as a routine procedure for therapeutic drug monitoring of warfarin.
Abbreviations
CV: coefficient of variation; LLOQ: Lower limit of quantification; QCL: Quality control low; QCM: Quality control medium; QCH: Quality control high; ULOQ: Upper limit of quantification; GC-MS: gas chromatography-mass spectrometry; HPLC: high-performance liquid chromatography; LC-MS/MS: liquid chromatography-tandem mass spectrometry; MEKC-MS/MS: micellar electrokinetic chromatography-tandem mass spectrometry; SFC-MS/MS: supercritical fluid chromatography-tandem mass spectrometry; ALLME: air-assisted liquid-liquid microextraction; LLE: liquid-liquid extraction; LLSMME: liquid-liquid solid membrane microextraction; PPT: protein precipitation; SPE: solid phase extraction; UF: ultrafiltration; VAMS: volumetric absorptive microsampling.
Declarations
Conflict of Interest
The authors declare no conflicting interest.
Data Availability
Not applicable.
Ethics Statement
Not applicable.
Funding Information
Not applicable.
References
- Kumar V, Abbas AK, Aster JC, Robbins SL. Robbins Basic Pathology. Elsevier/Saunders; 2013. (ClinicalKey 2012).
- Pastori D, Cormaci VM, Marucci S, Franchino G, Del Sole F, Capozza A, et al. A Comprehensive Review of Risk Factors for Venous Thromboembolism: From Epidemiology to Pathophysiology. Vol. 24, International Journal of Molecular Sciences. MDPI; 2023.
- Esmon CT. Basic mechanisms and pathogenesis of venous thrombosis. Blood Rev. 2009 Sep;23(5):225–9.
- Floyd CN. Indications for anticoagulant and antiplatelet combined therapy. BMJ. 2017;359:1–5.
- Cuker A, Burnett A, Triller D, Crowther M, Ansell J, Van Cott EM, et al. Reversal of direct oral anticoagulants: Guidance from the Anticoagulation Forum. Am J Hematol. 2019;94(6):697–709.
- Wadsworth D, Sullivan E, Jacky T, Sprague T, Feinman H, Kim J. A review of indications and comorbidities in which warfarin may be the preferred oral anticoagulant. J Clin Pharm Ther. 2021;46(3):560–70.
- Franchini M, Liumbruno GM, Bonfanti C, Lippi G. The evolution of anticoagulant therapy. Blood Transfusion. 2016;14(2):175–84.
- Chong HJ, Masaharu A, Alvaro A, Gerald B, Shun K, Deirdre L, et al. WORLDWIDE ORAL ANTICOAGULANT PRESCRIPTION PREVALENCE AND TRENDS IN PATIENTS WITH ATRIAL FIBRILLATION FROM A MULTI-NATIONAL COHORT: INSIGHTS FROM THE INTERNATIONAL COLLABORATIVE PARTNERSHIP FOR THE STUDY OF ATRIAL FIBRILLATION (INTERAF) COLLABORATIVE. J Am Coll Cardiol. 2019 Mar 12;73(9_Supplement_1):376.
- Zhang C, Wang J, Yang Y, Ma EL, Lin HW, Liu BL, et al. Prescribing Trends of Oral Anticoagulants from 2010 to 2020 in Shanghai, China: A Retrospective Study. Clinical and Applied Thrombosis/Hemostasis. 2022;28:1–10.
- Kwon MJ, Kim HJ, Kim JW, Lee KH, Sohn KH, Cho HJ, et al. Determination of plasma warfarin concentrations in Korean patients and its potential for clinical application. Korean Journal of Laboratory Medicine. 2009;29(6):515–23.
- Costa IM, Soares PJ, Afonso M, Ratado P, Lanao JM, Falcão AC. Therapeutic Monitoring of Warfarin: the Appropriate Response Marker. Journal of Pharmacy and Pharmacology. 2010;52(11):1405–10.
- Sun S, Wang M, Su L, Li J, Li H, Gu D. Study on warfarin plasma concentration and its correlation with international normalized ratio. J Pharm Biomed Anal. 2006;42(2):218–22.
- Lei BUW, Prow TW. A review of microsampling techniques and their social impact. Biomed Microdevices. 2019 Dec 1;21(4):1–30.
- Spooner N, Anderson KD, Siple J, Wickremsinhe ER, Xu Y, Lee M. Microsampling: Considerations for its use in pharmaceutical drug discovery and development. Bioanalysis. 2019;11(10):1015–38.
- Guthrie R. Screening for phenylketonuria. Triangle. 1969;9(3):104–9.
- Harahap Y, Manggadani BP, Sitorus TRJ, Mulyadi CA, Purwanto DJ. Clinical application of dried blood spot for monitoring studies of tamoxifen, endoxifen, and 4-hydroxytamoxifen in breast cancer patient using liquid chromatography–tandem mass spectrometry. International Journal of Applied Pharmaceutics. 2019 Mar 1;11(2):59–63.
- Poetto AS, Posocco B, Gagno S, Orleni M, Zanchetta M, Iacuzzi V, et al. A new dried blood spot LC-MS/MS method for therapeutic drug monitoring of palbociclib, ribociclib, and letrozole in patients with cancer. Journal of Chromatography B. 2021 Nov;1185:122985.
- Andriguetti NB, Hahn RZ, Lizot LF, Raymundo S, Costa JL, da Cunha KF, et al. Analytical and clinical validation of a dried blood spot assay for the determination of paclitaxel using high-performance liquid chromatography-tandem mass spectrometry. Clin Biochem. 2018 Apr;54:123–30.
- Zwart TC, Gokoel SRM, van der Boog PJM, de Fijter JW, Kweekel DM, Swen JJ, et al. Therapeutic drug monitoring of tacrolimus and mycophenolic acid in outpatient renal transplant recipients using a volumetric dried blood spot sampling device. Br J Clin Pharmacol. 2018 Dec 1;84(12):2889–902.
- Hoogtanders K, Van Der Heijden J, Christiaans M, Van De Plas A, Van Hooff J, Stolk L. Dried blood spot measurement of tacrolimus is promising for patient monitoring. Transplantation. 2007 Jan;83(2):237–8.
- Kim HM, Park JH, Long NP, Kim DD, Kwon SW. Simultaneous determination of cardiovascular drugs in dried blood spot by liquid chromatography-tandem mass spectrometry. J Food Drug Anal. 2019 Oct 1;27(4):906–14.
- AbuRuz S, Millership J, McElnay J. Dried blood spot liquid chromatography assay for therapeutic drug monitoring of metformin. J Chromatogr B Analyt Technol Biomed Life Sci. 2006;832(2):202–7.
- Scherf-Clavel M, Högger P. Analysis of metformin, sitagliptin and creatinine in human dried blood spots. J Chromatogr B Analyt Technol Biomed Life Sci [Internet]. 2015;997:218–28. Available from: http://dx.doi.org/10.1016/j.jchromb.2015.06.014
- Swales JG, Gallagher RT, Denn M, Peter RM. Simultaneous quantitation of metformin and sitagliptin from mouse and human dried blood spots using laser diode thermal desorption tandem mass spectrometry. J Pharm Biomed Anal [Internet]. 2011;55(3):544–51. Available from: http://dx.doi.org/10.1016/j.jpba.2011.02.030
- Londhe V, Rajadhyaksha M. Opportunities and obstacles for microsampling techniques in bioanalysis: Special focus on DBS and VAMS. J Pharm Biomed Anal [Internet]. 2020;182:113102. Available from: https://doi.org/10.1016/j.jpba.2020.113102
- Moorthy GS, Vedar C, Zane NR, Downes KJ, Prodell JL, DiLiberto MA, et al. Development and validation of a volumetric absorptive microsampling- liquid chromatography mass spectrometry method for the analysis of cefepime in human whole blood: Application to pediatric pharmacokinetic study. J Pharm Biomed Anal [Internet]. 2020;179(June):113002. Available from: https://doi.org/10.1016/j.jpba.2019.113002
- D’urso A, Locatelli M, Tartaglia A, Molteni L, D’ovidio C, Savini F, et al. Therapeutic drug monitoring of antiseizure medications using volumetric absorptive microsampling: Where are we? Pharmaceuticals. 2021;14(7):1–15.
- Delahaye L, Baerdemaeker L De, Stove CP. Determination of paracetamol and its metabolites via LC-MS/MS in dried blood volumetric absorptive microsamples: a tool for pharmacokinetic studies. J Pharm Biomed Anal [Internet]. 2021;206:114361. Available from: https://doi.org/10.1016/j.jpba.2021.114361
- Page MJ, McKenzie JE, Bossuyt PM, Boutron I, Hoffmann TC, Mulrow CD, et al. The PRISMA 2020 statement: An updated guideline for reporting systematic reviews. The BMJ. 2021;372.
- Coe RA, Rathe JO, Lee JW. Supercritical fluid chromatography-tandem mass spectrometry for fast bioanalysis of R/S-warfarin in human plasma. J Pharm Biomed Anal. 2006;42(5):573–80.
- Duffield AM, Duffield PH, Birkett DJ, Kennedy M, Wade DN. Plasma quantitation of warfarin and warfarin alcohol by gas chromatography chemical ionization mass spectrometry in patients on warfarin maintenance therapy. Biol Mass Spectrom. 1979;6(5):208–11.
- Jafari Z, Reza Hadjmohammadi M. Enhancing enrichment ability of Co-Al- layered double hydroxides-mixed matrix membrane microextraction by deep eutectic solvent for analysis of warfarin in biological samples and its quantification via high-performance liquid chromatography-ultraviolet de. Microchemical Journal. 2022;175(107167):1–10.
- Majidi SM, Hadjmohammadi MR. Hydrophobic borneol-based natural deep eutectic solvents as a green extraction media for air-assisted liquid-liquid micro-extraction of warfarin in biological samples. J Chromatogr A [Internet]. 2020;1621(461030):1–9. Available from: https://www.sciencedirect.com/science/article/pii/S0021967320302466
- Wang X, Hou J, Jann M, Hon YY, Shamsi SA. Development of a chiral micellar electrokinetic chromatography–tandem mass spectrometry assay for simultaneous analysis of warfarin and hydroxywarfarin metabolites: Application to the analysis of patients serum samples. J Chromatogr A [Internet]. 2013;1271(1):207–16. Available from: https://www.sciencedirect.com/science/article/pii/S0021967312017797
- Lomonaco T, Ghimenti S, Piga I, Onor M, Melai B, Fuoco R, et al. Determination of total and unbound warfarin and warfarin alcohols in human plasma by high performance liquid chromatography with fluorescence detection. J Chromatogr A [Internet]. 2013;1314:54–62. Available from: https://www.sciencedirect.com/science/article/pii/S0021967313013770
- Jones DR, Boysen G, Miller GP. Novel multi-mode ultra performance liquid chromatography–tandem mass spectrometry assay for profiling enantiomeric hydroxywarfarins and warfarin in human plasma. Journal of Chromatography B [Internet]. 2011;879(15):1056–62. Available from: https://www.sciencedirect.com/science/article/pii/S1570023211001759
- Ju W, Peng K, Yang S, Sun H, Sampson M, Wang MZ. A chiral HPLC-MS/MS method for simultaneous quantification of warfarin enantiomers and its major hydroxylation metabolites of CYP2C9 and CYP3A4 in human plasma. Austin J Anal Pharm Chem. 2014;1(2):1–8.
- Kumar DK, Shewade DG, Parasuraman S, Rajan S, Balachander J, Chandran BVS, et al. Estimation of plasma levels of warfarin and 7-hydroxy warfarin by high performance liquid chromatography in patients receiving warfarin therapy. Journal of Young Pharmacists [Internet]. 2013;5(1):13–7. Available from: http://dx.doi.org/10.1016/j.jyp.2013.02.001
- Ghimenti S, Lomonaco T, Biagini D, Bellagambi FG, Onor M, Trivella MG, et al. Determination of warfarin and warfarin alcohols in dried blood spots by ultra-high performance liquid chromatography coupled to electrospray ionization-tandem mass spectrometry (UHPLC-ESI-MS/MS). Microchemical Journal [Internet]. 2018;136:247–54. Available from: https://doi.org/10.1016/j.microc.2017.03.057
- Lv C, Liu C, Liu J, Li Z, Du X, Li Y, et al. The Effect of Compound Danshen Dripping Pills on the Dose and Concentration of Warfarin in Patients with Various Genetic Polymorphisms. Clin Ther [Internet]. 2019;41(6):1097–109. Available from: https://www.sciencedirect.com/science/article/pii/S0149291819301705
- Radwan MA, Bawazeer GA, Aloudah NM, Alquadeib BT, Aboul-Enein HY. Determination of free and total warfarin concentrations in plasma using UPLC MS/MS and its application to a patient samples. Biomedical Chromatography. 2012;26(1):6–11.
- Harter K, Levine M, Henderson SO. Anticoagulation drug therapy: A review. Western Journal of Emergency Medicine. 2015;16(1):11–7.
- Palta S, Saroa R, Palta A. Overview of the coagulation system. Indian J Anaesth. 2014;58(5):515–23.
- Lim GB. Warfarin: from rat poison to clinical use. Nat Rev Cardiol. 2017;1945.
- Md Arif K, Rahman MA. A Review of Warfarin Dosing and Monitoring. Faridpur Medical College Journal. 2018;13(1):40–3.
- Jaffer IH, Weitz JI. Antithrombotic Drugs. Seventh Ed. Vol. 1, Hematology: Basic Principles and Practice. Elsevier Inc.; 2017. 2168–2188 p.
- Higashi MK, Veenstra DL, Kondo LM, Wittkowsky AK, Farin FM, Rettie AE. Association Between CYP2C9 Genetic Variants and Anticoagulation-Related Outcomes During Warfarin Therapy. JAMA. 2002;287(13):1690–8.
- Jones DR, Kim SY, Guderyon M, Yun CH, Moran JH, Miller GP. Hydroxywarfarin Metabolites Potently Inhibit CYP2C9 Metabolism of S-Warfarin. Chem Res Toxicol. 2010;23(5):939–45.
- Shipkova M, Christians U. Improving Therapeutic Decisions: Pharmacodynamic Monitoring as an Integral Part of Therapeutic Drug Monitoring [Internet]. 2019. Available from: https://www.iatdmct.org/about-us/about-association/about-definitions-
- Wieland E, Shipkova M. Pharmacokinetic and Pharmacodynamic Drug Monitoring of Direct-Acting Oral Anticoagulants: Where Do We Stand? 2019.
- Usherwood T. Encouraging adherence to long-term medication. Aust Prescr. 2017;40(4):147–50.
- Jahanzeb Malik, Uzma Ishaq, Nismat Javed, Mirza Adnan Baig, Muhammad Javaid. Genetic Warfarin-Resistance Resulting in Surgery to Change a Prosthetic Valve. Eur J Case Rep Intern Med. 2020 Aug 5;7`(11):001851.
- Ialongo C, Bernardini S. Phlebotomy, a bridge between laboratory and patient. Biochem Med (Zagreb). 2016;26(1):17–33.
- Nayal B, Goud M, Devi O S, Suvarna N, Shivashanker S, Maradi R. General Procedure of Phlebotomy: A Review. Int J Appl Biol Pharm [Internet]. 2011;2(1):334–41. Available from: www.ijabpt.com
- Lima-Oliveira G, Lippi G, Salvagno GL, Picheth G, Guidi GC. Laboratory Diagnostics and Quality of Blood Collection. J Med Biochem. 2015;34(3):288–94.
- Sharma A, Jaiswal S, Shukla M, Lal J. Dried blood spots: Concepts, present status, and future perspectives in bioanalysis. Drug Test Anal. 2014;6(5):399–414.
- Guthrie R. The origin of newborn screening. Screening. 1992 Jan;1(1):5–15.
- Guerra Valero YC, Wallis SC, Lipman J, Stove C, Roberts JA, Parker SL. Clinical application of microsampling versus conventional sampling techniques in the quantitative bioanalysis of antibiotics: A systematic review. Bioanalysis. 2018;10(6):407–23.
- Ghimenti S, Lomonaco T, Biagini D, Bellagambi FG, Onor M, Trivella MG, et al. Determination of warfarin and warfarin alcohols in dried blood spots by ultra-high performance liquid chromatography coupled to electrospray ionization-tandem mass spectrometry (UHPLC-ESI-MS/MS). Microchemical Journal. 2018;136:247–54.
- Protti M, Mandrioli R, Mercolini L. Tutorial: Volumetric absorptive microsampling (VAMS). Anal Chim Acta. 2019;1046:32–47.
- Denniff P, Spooner N. Volumetric absorptive microsampling: A dried sample collection technique for quantitative bioanalysis. Anal Chem. 2014;86(16):8489–95.
- Arora K, Gangadharappa H. AN APPROACH TO BIOANALYTICAL METHOD DEVELOPMENT AND VALIDATION: A REVIEW. Int J Pharm Sci Res [Internet]. 2016;7(6):2291. Available from: http://dx.doi.org/10.13040/IJPSR.0975-8232.7
- European Medicines Agency. Guideline on the Investigation Of Bioequivalence. 2010. 27 p.
- Food and Drug Administration. Bioanalytical method validation: Guidance for Industry. Food and Drug Administration. Maryland; 2018.
- Thompson M, Ellison SLR, Wood R. Harmonized guidelines for single-laboratory validation of methods of analysis (IUPAC Technical Report). Pure and Applied Chemistry. 2002;74(5):835–55.
- Duffield AM, Duffield PH, Birkett DJ, Kennedy M, Wade DN. Plasma quantitation of warfarin and warfarin alcohol by gas chromatography chemical ionization mass spectrometry in patients on warfarin maintenance therapy. Biol Mass Spectrom. 1979;6(5):208–11.
- Majidi SM, Hadjmohammadi MR. Hydrophobic borneol-based natural deep eutectic solvents as a green extraction media for air-assisted liquid-liquid micro-extraction of warfarin in biological samples. J Chromatogr A. 2020;1621:461030.
- Vaghela A, Patel A, Patel A, Vyas A, Patel N. Sample Preparation In Bioanalysis : A Review. International Journal of Scientific & Technology Research. 2016;5(05):6–10.
- Li W, Zhang J, Tse FLS. Handbook of LC-MS Bioanalysis: Best Practices, Experimental Protocols, and Regulations. 1st editio. New Jersey: John Wiley & Sons; 2013.
- Badawy MEI, El-Nouby MAM, Kimani PK, Lim LW, Rabea EI. A review of the modern principles and applications of solid-phase extraction techniques in chromatographic analysis. Vol. 38, Analytical Sciences. Springer; 2022. p. 1457–87.
- Baldrey SF, Brodie / R R, Morris / G R, Jenkins EH, Brookes / S T. Comparison of LC-UVand LC-MS-MS for the Determination of Taxol. Chromatographia. 2002;55(Suppl.):187–92.
- Harahap Y, Anjani N, Suryadi H. Modest Simultaneous Determination of Acetylsalicylic Acid and Salicylic Acid in Plasma by High Performance Liquid Chromatography UV Detection. Journal of Global Pharma Technology [Internet]. 2019;11(01):206–13. Available from: www.jgpt.co.in
- Zakaria R, Allen KJ, Koplin JJ, Roche P, Greaves RF. Advantages and challenges of dried blood spot analysis by mass spectrometry across the total testing process. 27:288–317.