Bioactive Compounds of Rosa canina L. and Their Effect on Tumor Necrosis Factor-α and Interleukin-1β Activity in Diabetes-Induced Rats
by İlayda Sezin YALÇINKAYA, Onur AKTAN, Leyla AÇIK ★ , Gülnihal KULAKSIZ ERKMEN, NILUFER VURAL , Sibel KAYMAK , Yiğit Can ATEŞ
Academic editor: Khalid Abdelsamea Mohamedahmed
Sciences of Pharmacy 3(2): 77-91 (2024); https://doi.org/10.58920/sciphar0302221
This article is licensed under the Creative Commons Attribution (CC BY) 4.0 International License.
16 Feb 2024
18 Apr 2024
28 Apr 2024
02 May 2024
Abstract: The ethnopharmacological significance of Rosa canina, or dog rose, transcends diverse cultures, with traditional applications in treating various diseases. This study investigates the potential pharmacological application of Rosa canina for diabetes treatment, aiming to assess its antidiabetic properties through in vitro, in vivo, and in silico analyses targeting pro-cytokines. Biochemical profiling utilizing HPLC, and phenolic content analyses were conducted to reveal the antioxidant properties of Rosa canina. In diabetic rats, root extracts influenced the expression of TNF-α and IL-1β, with an exploration of DNA-binding and protective activities. DPPH scavenging and iron chelating activities were measured, identifying significant IC50 values. The chromatographic analysis identified various compounds, with Kaempferol 3-O-glucoside and Rutin exhibiting high inhibitory activity against TNF-alpha. In silico analyses highlighted inhibitory activities by molecular docking against TNF-α and IL-1β (PDB IDs 2AZ5 and 9ILB, respectively) and their drug potential based on ADMET properties. The obtained results have demonstrated a significant decrease in blood glucose levels in mice through the reduction of TNF-α and IL-1β mediated diabetic processes, facilitated by the Rosa canina extract. In conclusion, this study exploring the effects of Rosa canina extracts on diabetic rats have provided valuable insights into its potential therapeutic benefits. The observed reductions in blood glucose levels, improvements in lipid profiles, and modulation of antioxidant activity highlight its promising role in managing diabetes-related complications. Further research is warranted to elucidate the underlying mechanisms and optimize the dosage regimens for harnessing the full therapeutic potential of Rosa canina extracts in diabetes management.
Keywords: AntidiabeticsBioactive compoundsMedicinal plantAntioxidant
Introduction
According to the International Diabetes Federation report in 2021, approximately 9 million adults suffer from diabetes mellitus (DM), and the disease prevalence is reported to be 14.5% in Türkiye (1). Deaths related to diabetes mellitus (DM) constitute 4% of total deaths under the age of sixty, and the major causes are acute or chronic complications. Among the acute complications, are conditions related to hypo or hyperglycemia, while chronic complications are grouped as micro and macrovascular complications in the literature (2). Microvascular complications include retinopathy, nephropathy, and neuropathy, whereas macrovascular complications are atherosclerosis-related disorders that damage the heart, brain, and lower extremity arteries, leading to myocardial infarction, brain stroke, and limb amputation (3). Drug development and design for diabetic complications are based on identifying and targeting the mechanisms underlying disease processes, such as the accumulation of abnormal proteins, inflammatory processes, oxidative stress, and pathogenic complications. Elucidating these mechanisms may enable increasing limited treatment options, developing new alternatives to existing drugs, and creating new economic values (4). The increased production of reactive oxygen species (ROS), leading to oxidative stress, plays a critical role in the development of chronic complications of DM (5). High levels of glucose and fatty acids also trigger inflammatory-related pathways, causing an increase in ROS and oxidative stress (6). Tumor necrosis factor-α (TNF-α) and (interleukin 1-beta) IL-1β are pro-inflammatory cytokines that have been indicated in the development of insulin resistance and pathogenesis of Type 2 Diabetes mellitus (T2DM) (7). Studies have shown that TNF-α and IL-1β levels are high in the serum of diabetic patients, in which insulin secretion is low or relatively deficient (8). Proinflammatory cytokines and acute-phase reactants are thought to be associated with insulin resistance caused by obesity in different tissues (9, 10).
TNF- α is the first proinflammatory cytokine considered to be effective in the pathogenesis of insulin resistance and T2DM. Studies on TNF-α have reported that it reduces the expression of “Insulin Regulated Glucose Transporter Type 4” (GLUT4), which is found in adipocytes and skeletal and cardiac muscles (11). On the other hand, IL1β is a proinflammatory cytokine that modulates important metabolic processes, including β-cell damage, insulin secretion, and β-cell apoptosis. There are studies suggesting that chronically elevated levels of IL-1β in obese and type 2 diabetic individuals can lead to β-cell dysfunction. IL-1β signaling events can induce acute-phase responses, low blood pressure, vasodilation, and fever, which are the common symptoms of inflammatory responses (12).
Herbal formulations have been used as integrative treatments for various health issues since ancient times. Numerous studies in the literature demonstrate that bioactive molecules derived from medicinal plants possess multiple pharmacological properties capable of preventing various destructive cellular damages, including inflammation (13). Türkiye, with a rich flora comprising more than 12,000 plants, is home to many medicinal plants and associated prescriptions from the Anatolian culture.
Rosa canina, a medicinal plant that can be found in almost every region of Türkiye (14), has been used in integrative medicine prescriptions dating back to the 15th century for the prevention and treatment of conditions such as the common cold, gastrointestinal disorders, diabetes, kidney disorders, and other infections (15). Most of the plant members of the Rosaceae have been used in traditional Turkish medicine to treat inflammations, injuries, certain types of cancer, microbial infections, diarrhea, diabetes mellitus, and other disorders (16). R. canina extract is a common plant that is used in many cultures for the treatment of different diseases and is an emerging candidate as a source for drug discovery in diabetes mellitus. Its fruits with or without seeds are used in traditional medicine to prevent scurvy, but also in different pathological conditions (17). Moreover, R. canina roots have been used to treat diabetes mellitus in Kırıkkale province of Türkiye. Extracts of the species is rich in vitamins (especially vitamin C) and phenolic compounds. It has been reported that R. canina extract has antioxidant, antimicrobial, and anti-inflammatory activities (18). Although there are many studies on R. canina potential antioxidant and anti-inflammatory activities in various parts of the plant (e.g., fruits, leaves, rose hip with seeds), there is no research investigating the activity of root extract. The objective of the study is to assess the biochemical content and biotherapeutic effects of methanol and water extracts of R. canina roots through in vitro, in vivo, and in silico evaluations.
Experimental Section
Materials
All chemicals for the present study were purchased from Sigma Aldrich (St. Louis, MO, USA) and all the standards were of purity >95%. Additionally, Ultrapure water was acquired by a Milli-Q system (Millipore, Bedford, MA, USA).
Extract Preparation of Rosa Canina Root
R. canina species was collected from Kırıkkale-Delice-Halitli, which is in the Central Kızılırmak Section of the Central Anatolia Region in June-August 2019 by H. Taşkın (Gazi U. MolBiol Lab) and identified in the Herbarium of Gazi University. After the drying process, 50 g of powdered root sample was soaked with 500 ml of methanol (MRE) and water (WRE), separately. Then samples were placed into dark-colored sealed bottles and dept for 16 days with occasional shaking and stirring at room temperature (25°C). Then, extracts were filtered with Whatman No. 1 filter papers, and filtrates were concentrated with a rotary evaporator at 337 Mbar pressure and a 60°C water bath, respectively.
Antioxidant Radical Scavenging Activity
The antioxidant activities of methanol and aqueous plant extracts were assessed using the 2,2-diphenyl-1-picrylhydrazyl (DPPH) assay (19). For the evaluation of enzymatic activity, 200 µL of plant extracts at varying concentrations were mixed with 500 µL of 120 µM DPPH ethanol solution and 500 µL of pure ethanol. The mixture was then incubated at room temperature in the dark for 30 min. Following incubation, absorbance measurements at 517 nm were taken to determine the intensity of the purple color resulting from the reaction. Butylated hydroxytoluene (BHT) was used as a reference in the assay. The percentage antioxidant activity of plant extracts prepared at different concentrations was calculated by using the Equation 1. IC50 value was calculated from the standard graph of DPPH activity, and all measurements were performed in triplicate.
Equation 1
Antioxidant Iron Chelating Activity
The chelation of ferrous ions by extracts was determined by standard method (20). Briefly, 0.05 μl of 2 mM FeCl2 was added to 1 ml of various quantities of the extract (1, 0.5, 0.25, 0.125, 0.06 mg/ml). The reaction was initiated by the addition of 0.2 ml of 5 mM ferrozine solution. The mixture was shaken vigorously and left at room temperature for 10 min, then, the absorbance was measured at 562 nm (Shimadzu UV-1800). As controls, solvents without extracts were used. The percent chelating activity of ferrous ions of the plant extracts was determined by using the Equation 2.
Equation 2
Determination of Total Phenolic Content
The total phenolic compound contents of the extracts were determined by the folin-ciocalteau method (21). First, extract samples (0.5 ml extract, different dilutions) were mixed with 2.5 ml of 0.2 N folin-ciocalteau reagent (Sigma–Aldrich) for 3 min, and then 2.0 ml of 75 g/L sodium carbonate was added. The absorbance of the reaction was measured at 760 nm using a spectrophotometer (Shimadzu UV-1800) after 2 h of incubation at room temperature. The standard curve was plotted using 50 to 250 mg/ml solutions of gallic acid in methanol/water (1:1, v/v). All measurements were taken in triplicate. Gallic acid is used as a reference compound and the total phenolic content value is expressed as gallic acid equivalent per gram of extract (mg GAE/g).
Determination of Phenolic Compounds
The slightly modified high-performance liquid chromatography (HPLC) approach described was employed to identify specific components of R. canina root extracts (22). Shimadzu LC-20AD Prominence HPLC system (Shimadzu Corp., Kyoto, Japan) consisted of a diode array detector model SPD-M10AVP equipped with a pump system LC-20AT with an autosampler model SIL-20AC, CTO-10AS VP column heater and DGU-20A5 degasser units. The column was an Inertsil ODS4 (250 x 4.6 mm I.D.) with a 5 mm packing. Operations were controlled with the HPLC software version of the LC solution. A 10 μl aliquot of sample was injected and analyzed in a column at 40 C. Two solvents were used during the analysis. Solvent A was composed of distilled water–phosphoric acid (PA, 0.2%) and solvent B consisted of acetonitrile (ACN). A constant flow of 0.6 ml/min was applied with the following gradient elution: 0 min, 70% B; 15 min, 65% B; 20 min, 55% B; 25 min, 45% B; 30 min, 45% B; 35 min, 30% B; 40 min, 15% B; 45 min, 15% B. The column effluent was monitored at 240, 260, 280, 320, and 360 nm wavelengths for the information and data acquired in all the PDA chromatograms. Since phenolic compounds different absorb effectively in the UV region with varying absorptive strength and response times due to their unique structures, selecting appropriate detection wavelengths for each analyte should be carefully considered. It was studied by scanning the wavelength range of 190-650 nm with a PDA detector. Solvents and mobile phases to be used in chromatographic processes were degassed before being used and filtered through a 0.45 μm nylon membrane. Gallic acid, citric acid, syringic acid, caffeic acid, protocatechuic acid, p-coumaric acid, ferulic acid, chlorogenic acid, gentisic acid, catechin, kaempferol 3-O- glucoside, rutin, quercetin, myricetin, ellaigic acid, kaempferol-3-O-(p-coumaroyl)-glucoside (trans-tiliroside), and galloylquinic acid were used as standards in the RE among the tested standards. Standard solutions used in calibration graphs and determining other validation parameters were diluted from a stock solution of 100 mgL-1. The standard stock solutions (100 mgL-1) were prepared in H2O-MeOH (20:80 v/v) and working standards were freshly produced by diluting the stock solution in the same solvent at concentrations ranging from 0.01 mgL-1 to 150 mgL-1. The calibration curve was created by graphing the concentration of each standard against the peak area. To extend the shelf life of all solutions, they were kept at 4°C.
DNA Cleavage, Binding Activity, and Protection Assay
First, the pBR322 plasmid DNA was incubated with different concentrations (1000, 500, 250, 125 g/ml) of root extract and incubated in the dark at 37°C for 24 h, followed by 1% agarose gel electrophoresis. Then, extract-treated plasmid DNA samples and control DNA (untreated with extract) were loaded into the wells of the agarose gel to characterize the extract-induced plasmid conformational changes. Gel electrophoresis was carried out at 80 V for 120 min, followed by staining with ethidium bromide and visualized under UV light with a Biometra UV imager and results were photographed. The extract-plasmid DNA mixtures were first incubated for 24 h at 37°C and then subjected to HindIII and BamH1 digestion. The mixtures were incubated at 37°C for another 1 h and confirmation of the restriction digest was determined by 1% (w/v) agarose gel electrophoresis. The gel was visualized under UV light with a Biometra UV-imager and results were photographed (23). DNA damage inhibition potential of MRE and WRE of R. canina was evaluated using plasmid DNA. Oxidative damage to plasmid DNA was induced using hydroxyl (•OH) radical generated from the ultraviolet (UV)/H2O2-radical system as described (24). A reaction mixture containing 20 μL of plant extract of different concentrations (25-50 μg/mL), pBR322 DNA (0.25 μg), and 20 μL Fenton’s reagent (30 mmol/L H2O2, 500 μmol/ L-ascorbic acid and 800 μmol /L FeCl3 was incubated for 40 min at 37°C and analyzed on a 1% agarose gel by staining with ethidium bromide. Additionally, in this assay, internal control was untreated plasmid DNA while negative control was DNA and distilled water mixture. Control group tubes were exposed UV-irradiation at 230 nm using a UV transilluminator (BioDoc Analyzer Biometra) for 30 min. After irradiation, samples were analyzed by 1% agarose gel electrophoresis in TAE buffer and results were photographed.
Animal Studies
Permission for this in vivo study with Project ID 6367 and project code 05/2020-24 was accepted and supported by the Gazi University Scientific Research Projects Unit (BAP) on 26.06.2020 with G.Ü.ET-20.037 and experimental animal applications were carried out and completed by following "Compliance with ethical rules" specified in the 13th article of the Gazi University Ethics Committee. Experiments were performed with 42 male Wistar rats weighing between 250 and 300g. Rats were housed in cages (7 animals/cage) with a controlled temperature (25°C) and a 12:12-h light-dark cycle. Animals were randomly divided into 6 groups and each group contained 7 rats; Group I: healthy, negative control (HC), solvent injected rats; Group II: diabetic control (DC) and Groups III-VI: low-dose methanol extract (LDME), high-dose methanol extract (HDME), low-dose water extract (LDWE) and high-dose water extract (HDWE) treated diabetic groups, respectively (Table 1). Streptozotocin (STZ) freshly prepared in sodium citrate buffer (50 mM, pH 4.5) was administered intraperitoneally (60mg/kg) to the rats for the DM induction. After 72 h, fasting blood glucose levels were measured and levels of ≥200mg/dL were considered diabetic. Only sodium citrate buffer was injected into the healthy control group and R. canina extracts were administered orally (250mg/kg or 500mg/kg) 5 days after STZ injection to the study groups every morning (10.00 am) for 14 days (25). The extract type and dosage administered to the rats are presented in Table 1. After 15 days of extract administration, all studied groups were sacrificed under deep anesthesia, and intracardiac blood samples were collected and placed into EDTA-containing tubes (5ml). Then, the samples were centrifuged at 3500 rpm for 10 min and the collected plasma samples were aliquoted and stored at −80 °C for further analysis. Also, RNA isolation was performed by using the HP-RNA isolation kit (11828665001, Roche, Germany), and reverse transcription was performed using the transcriptor cDNA synthesis kit (04896866001, Roche, Germany). Additionally, IL-1ß and TNF-ɑ were determined by using IL-1β and TNF-ɑ rat ELISA kits (E0119Ra, E0764Ra Bioassay Technology Laboratory, Shanghai, China).
Table 1. Experimental arrangement of study groups (n=7).
|
Study group |
Solution injected intraperitoneally |
Substance to be given by gavage |
|
Group 1- Healthy control (HC) |
Citrate buffer only |
Water |
|
Group 2- Diabetic control (DC) |
Streptozotocin(+) |
Water |
|
Group 3- Low dose methanol extract (LDME) -treated |
Streptozotocin(+) |
Methanol extract dissolved in water, 250 mg/kg/day |
|
Group 4- High dose methanol extract (HDME) -treated |
Streptozotocin(+) |
Methanol extract dissolved in water, 500 mg/kg/day |
|
Group 5- Low dose water extract (LDWE) -treated |
Streptozotocin(+) |
Water extract, 250 mg/kg/day |
|
Group 6- High dose water extract (HDWE) -treated |
Streptozotocin(+) |
Water extract, 500 mg/kg/day |
Gene Expression Analyses by qRT-PCR
Total RNA was isolated and reverse-transcribed into complementary DNA (cDNA). Relative gene expression levels of IL-1ß and TNF-ɑ were measured by real-time PCR (Light Cycler® 480) using a TAQMAN® gene expression test kit (04707494001 Roche, Germany). The results were normalized to the expression of housekeeping gene β actin (4331182 Roche, Germany), and the sequence of primers was designed for an annealing temperature of 56°C. The designed primers were used for relative quantification of TNF-ɑ (4331182 Roche, Germany) and IL-1ß (4331182 Roche, Germany) and the gene was as follows:
TNF-α: forward 5'-CAGACCAAGGTCAACCTCCT-3'; reverse, 5'-TGGAAGACCCCTCCCAGATA-3'; probe: TGCCATCAAGAGCCCCTGCCAGA, IL-1ß: forward, 5'- ACAGATGAAGTGCTCCTTCCA-3'; reverse, 5'-ACAGATGAAGTGCTCCTTCCA-3'; probe: CATCCAGCTACGAATCTCCGACCACC. β-actin: forward: 5'- TCCCTGGAGAAGAGCTACGA-3'; reverse, 5'- ATCTGCTGGAAGGTGGACAG-3'.
Reactions were optimized to a final volume of 20μl and contained, 1x reaction buffer, 0.2 mM of each deoxynucleotide, 2.5 mM MgCl2, 0.5 μM of each primer, 10 μL master mix, 2.5 μL distilled water and 6 μL DNA. RT-PCR amplification was performed with a Light Cycler® 480 Real-Time PCR system (Roche, Germany) and analyzed with the provided software. This three-step run protocol was used: (i) an initial hold of 10 min at 95°C (ii) an amplification and quantification cycle with 40 repeats (denaturation 15 sec at 95°C), and (iii) annealing 1 min at 60°C with 1 min extension. Lastly, TNF-α and IL-1ß genes for each sample were expressed with an arbitrary ratio of the quantity of mRNA to that of β-actin, and the amplification data were analyzed following the 2-ΔΔCt method.
Cytokine Level Measurements
For cytokine level determination, plasma and adipose tissue samples were examined and TNF-α and IL- 1ß levels were quantified by enzyme-linked immunosorbent assay (ELISA) (26). Approximately 50 mg of adipose tissue was placed into microcentrifuge tubes and washed with PBS buffer by vortexing. RIPA buffer (50 mM Tris HCl, 300 mM NaCl, 2 mM EDTA, 1% (v/v) NP-40, 0.5% (w/v) sodium deoxycholate, 0.1% (w/v) SDS, and 1 mM PMSF pH 7.4) added into the sample tubes (1:9, w/v) and homogenized on the ice bath (20 sec homogenization followed by 60 sec incubation on ice, repeated 2 times) using a homogenizer (PRO200, PRO Scientific Inc. Monroe, CT USA). Then all samples were centrifuged at 12,200 g for 20 min at 4°C. Finally, the supernatant was transferred to a new microcentrifuge tube without disturbing the upper fat and lower pellet layers for ELISA assays.
In Silico Analysis
The antidiabetic efficacy of R. canina, which has antioxidant, anti-inflammatory, analgesic, hypotensive, and wound healing properties, was evaluated by using molecular docking analysis. The antidiabetic and anti-inflammatory activities of R. canina were investigated at the molecular level. From the phenolic chemical composition of R. canina, all compounds were selected as active ligands and each of them was analyzed. From the protein data bank, the crystal structure of TNF-α and IL-1ß were provided (PDB: 2AZ5 and PDB: 9ILB) as the receptors for molecular docking analysis. The Autodock Vina module and Chimera v1.6 software were implemented for molecular docking analysis, and the SwissADME web-based tool was used for ADMET predictions. All ligands that were considered to be possible inhibitors of proinflammatory cytokines were optimized, and the energy minimization process was performed using the AMBER module of Chimera (27). Ions and other unwanted molecules were deleted, and polar hydrogens were added as the preprocessing of the proteins. By creating a 3D grid box (for 2AZ5 (-5x82x28) and for 9ILB (-17x4x5) with 24 grid box size for each protein) centered on each protein, docking processes were performed. Also, all pharmacokinetic and physicochemical properties of the ligands that have the highest binding affinity scores of R. canina were calculated using the SwissADME web-based tool by analyzing canonical SMILES formulations.
Statistical Analysis
All the data were given as Mean ± S.D. Statistical significance was evaluated by one-way analysis of variance (ANOVA) using SPSS version 7.5 (SPSS, Cary, USA), and the Kruskal Wallis test was used to compare IL-1β and TNF-α cytokine levels of both serum and adipose tissues with control groups and differences were considered significant at p ≤ 0.05.
Results
Antioxidant Radical Scavenging Activity, Iron Chelating Activity, and Total Phenolic Content
The scavenging activity of root extract compared to BHT is given in Table 2. The results indicate that the scavenging activity of the root extract was higher than that of the BHT. The IC50 values were 23.31±0.14 μg/ml, 26.94±0.82 μg/ml, and 96.47±032 μg/ml for WRE, MRE, and BHT, respectively. The level of phenolic content was expressed in terms of gallic acid equivalent per gram of plant extract. The total phenolic content of the water root extract was 34.96 ± 3.91 μg GAE/mg, while the methanol root extract was 16.98 ± 0.75 μg GAE/mg (Table 2). IC50 of the water root extract for iron chelating activity was 0.91 ± 0.11 μg/ml which is higher than methanol root extract (0.77 ± 0.24 μg/ml) (Table 2).
Table 2. The antioxidant properties of Rosa canina root extracts.
|
Parameter |
Result |
||
|
Methanol |
Water |
BHT |
|
|
IC50 for DPPH radical scavenger activity (µg/ml) |
26.94 ± 0.82 |
23.31 ± 0.14 |
96.47 ± 0.32 |
|
Total Phenolic Content (μg GAE/mg) |
16.98 ± 0.75 |
34.96 ± 3.91 |
- |
|
IC50 for iron chelation (µg/ml) |
10.77 ± 0.24 |
0.91 ± 0.11 |
- |
Phenolic Compounds
Polyphenolic compounds in R. canina were quantified using an HPLC-PDA system with authentic standards, revealing seventeen compounds (Figures 1 and 2; Table 3). The WRE contained higher myricetin and catechin levels, while the MRE had more kaempferol 3-O-glucoside, quercetin, 2,5-dihydroxybenzoic acid, and catechin. Both extracts shared catechin, chlorogenic acid, myricetin, and kaempferol-3-O-(p-coumaroyl)-glucoside. Table 3 shows individual phenolic component amounts in MRE.
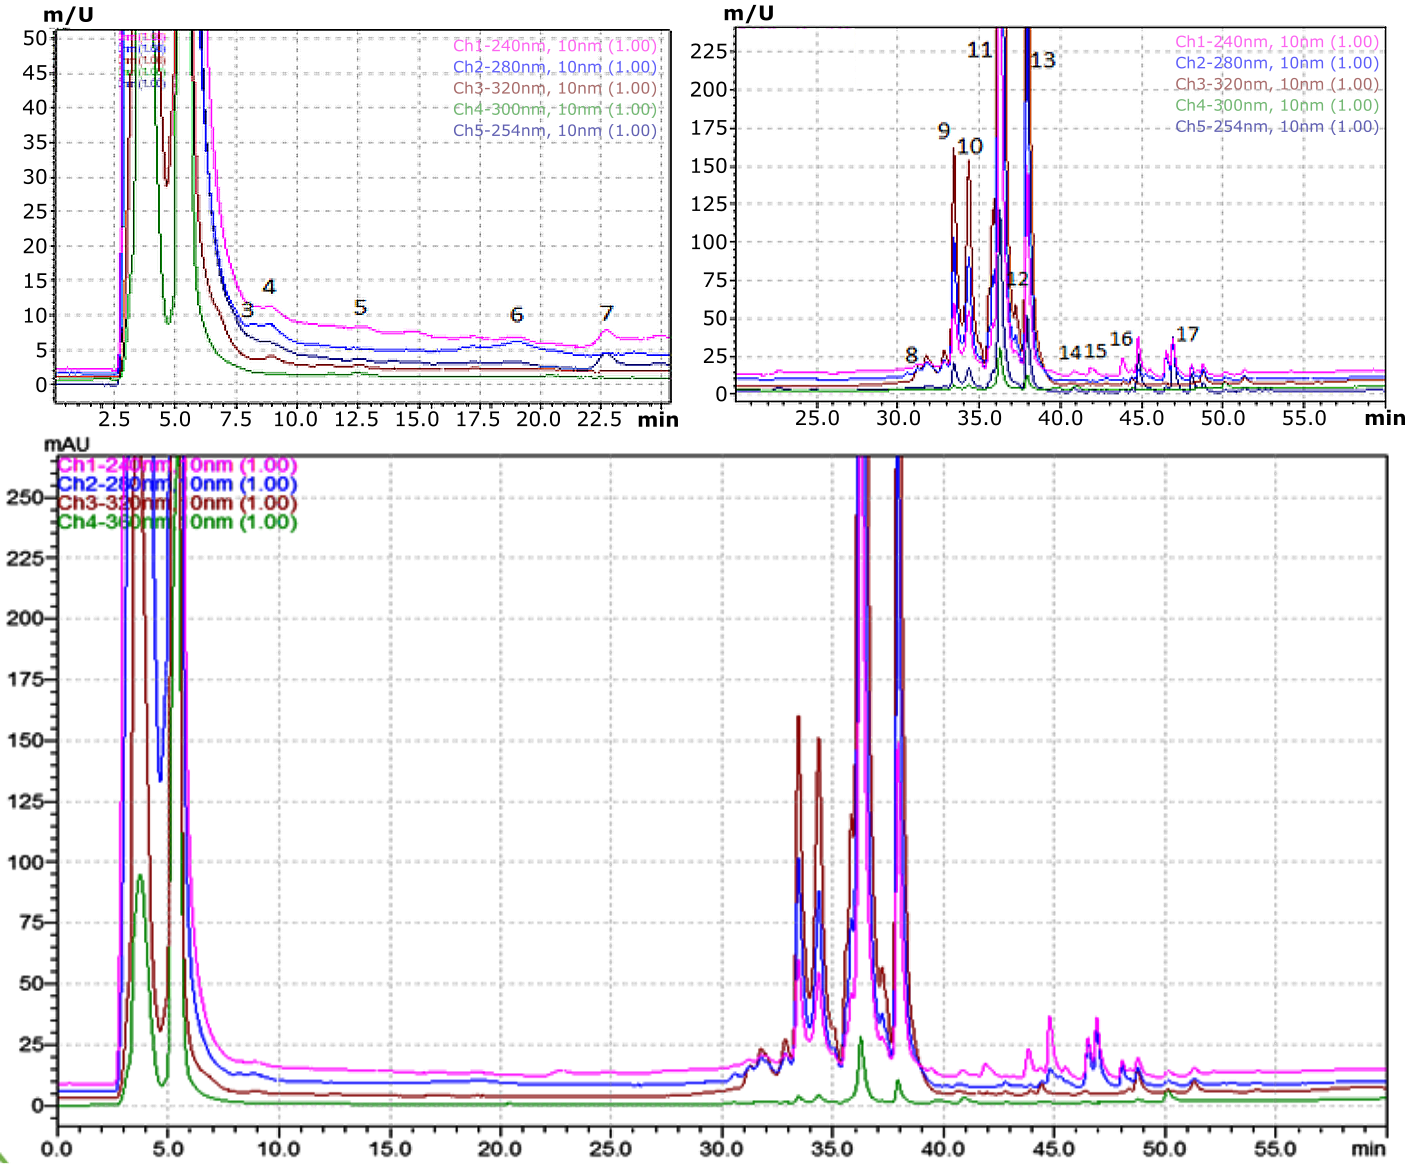
Figure 1. HPLC/PDA chromatogram, visualized at different wavelengths, of methanolic extract from the R. canina.
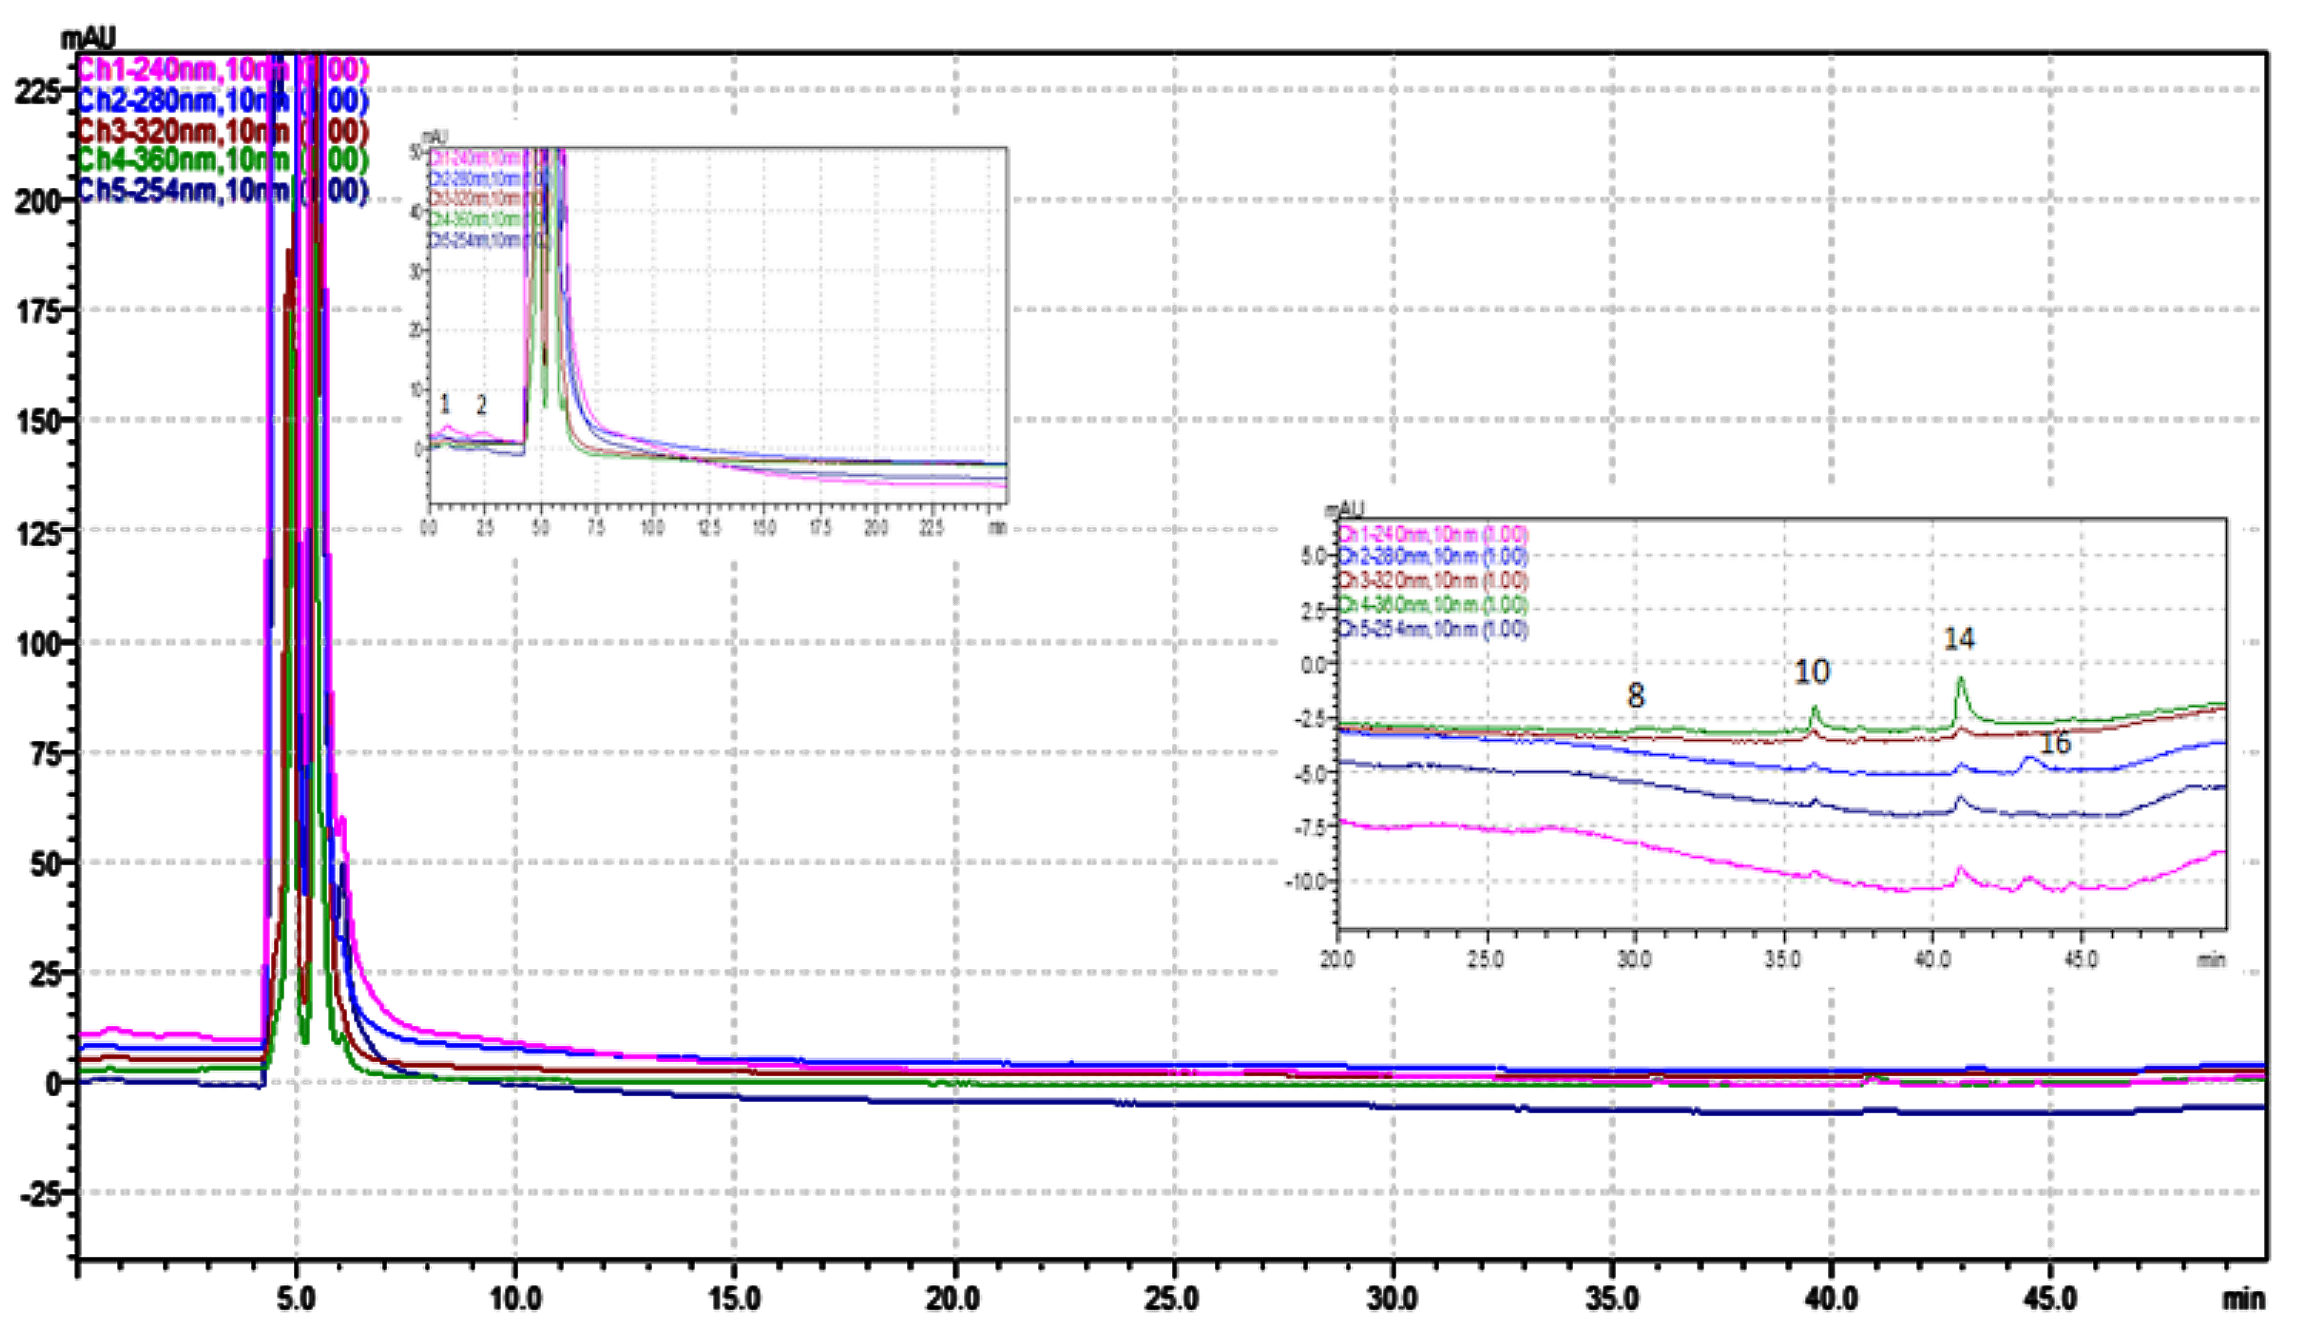
Figure 2. HPLC/PDA chromatogram, visualized at different wavelengths, of water extract from the R. canina.
Table 3. Phenolic compounds quantification in R. canina root extracts.
|
No. |
Compounds |
Chemical family |
Rt |
λmax (nm) |
Correlation coefficient (r) |
Regression equation |
Methanolic extract (mg/100g) |
Water extract (mg/100g) |
|
1 |
Gallic acid |
Hydroxybenzoic acid derivatives |
1.65 |
280 |
0.995 |
y = 25.99x + 21.19 |
nd |
1.20±0.08 |
|
2 |
Citric acid |
Organic acid |
2.55 |
240 |
0.998 |
y = 21.81x + 10.20 |
nd |
0.98±0.01 |
|
3 |
Syringic acid |
Hydroxybenzoic acid derivatives |
8.30 |
280 |
0.997 |
y = 2431.75x + 54.21 |
0.23±0.04 |
nd |
|
4 |
Caffeic acid |
Hydroxycinnamic cid derivatives |
9.25 |
320 |
0.999 |
y = 6189.5x - 693.51 |
3.35±0.13 |
nd |
|
5 |
Protocatechuic acid |
Hydroxybenzoic acid derivatives |
12.5 |
280 |
0.998 |
y = 184.38x - 23.87 |
2.14±0.09 |
nd |
|
6 |
p-coumaric acid |
Hydroxycinnamic acid derivatives |
19.25 |
280 |
0.995 |
y = 841.6x + 173.49 |
2.98±0.14 |
nd |
|
7 |
Ferrulic acid |
Hydroxycinnamic acid derivatives |
23.15 |
280 |
0.996 |
y = 411.76x - 114.76 |
6.32±0.21 |
nd |
|
8 |
Chlorogenic acid |
Cinnamate ester |
31.05 |
320 |
0.998 |
y = 679.88x - 21.76 |
12.59±0.65 |
0.12±0.00 |
|
9 |
Gentisic acid |
Hydroxybenzoic acid derivatives |
33.5 |
320 |
0.999 |
y = 978.65x + 112.76 |
68.45±1.12 |
nd |
|
10 |
Catechin |
Flavonoid |
34.5 |
280 |
0.998 |
y = 7569.95x - 865.78 |
61.43±0.98 |
2.45±0.11 |
|
11 |
Flavonoid |
36.5 |
280 |
0.999 |
y = 459.81x - 456.23 |
119.85±1.27 |
nd |
|
|
12 |
Rutin |
Flavonoid |
37.5 |
260 |
0.998 |
y = 23.65x + 135.87 |
25.72±0.35 |
nd |
|
13 |
Quercetin |
Flavonoid |
38 |
360 |
0.999 |
y = 175.02x - 43.88 |
98.76±1.04 |
nd |
|
14 |
Myrcetine |
Flavonoid |
41 |
360 |
0.996 |
y = 325.79x - 247.98 |
5.45±0.22 |
3.26±0.15 |
|
15 |
Ellaigic acid |
Tannin |
42.5 |
280 |
0.998 |
y = 9873.23x + 435.11 |
9.85±0.53 |
nd |
|
16 |
Kaempferol-3- O-(p-coumaroyl)- glucoside (trans-tiliroside) |
Flavonoid |
44 |
280 |
0.999 |
y = 1865.76x - 112.76 |
11.65±0.65 |
0.45±0.03 |
|
17 |
Galloylquinic acid |
Tannin |
48.00 |
280 |
0.998 |
y = 23.14x + 119.65 |
5.43±0.27 |
nd |
Note: contents of phenolics are expressed as milligrams per gram dry weight (mg·100g−1 dw ± SD) where Rt = Retention time and nd = not detected.
DNA Cleavage, Binding Activity, and Protection Assay
Upon interaction with decreasing concentrations of root extract (1000, 500, 250, 125 μg/ml), the pBR322 plasmid DNA exhibited two distinct DNA bands corresponding to forms I and II, as observed in Figure 3A. This consistent observation was noted in both untreated and treated plasmid DNA samples. As the concentration of the water extract increased, there was a slight decrease in the mobility of the form I band, accompanied by a decrease in the intensity of form II for WRE. In contrast, plasmid DNA treated with MRE showed an increase in the density of form II DNA, coupled with a decrease in form I density, suggesting a transition from the negatively supercoiled DNA conformation (form I) to the relaxed circular form (form II) of DNA.
The electropherograms of plasmid DNA treated with the extract for 24 hours at 37°C, followed by BamHI and HindIII digestions, are depicted in Figure 3B. These results were analyzed and presented to gain further insights into DNA verification changes. Additionally, the agarose gel electrophoretic pattern of DNA with and without the extract is illustrated in Figure 4. Untreated plasmid DNA displayed a sharp, intense form I band and a lighter form II band on agarose gel electrophoresis (Lane 1). Furthermore, upon exposure to UV in the presence of H2O2 without the extract, the DNA exhibited a linear band in the III DNA form (Lane PC). Interestingly, in the lanes corresponding to the addition of WRE and MRE to DNA exposed to H2O2 in the presence of UV ("water and methanol"), especially for the methanol extract, it was observed that negatively supercoiled DNA suffered more damage.
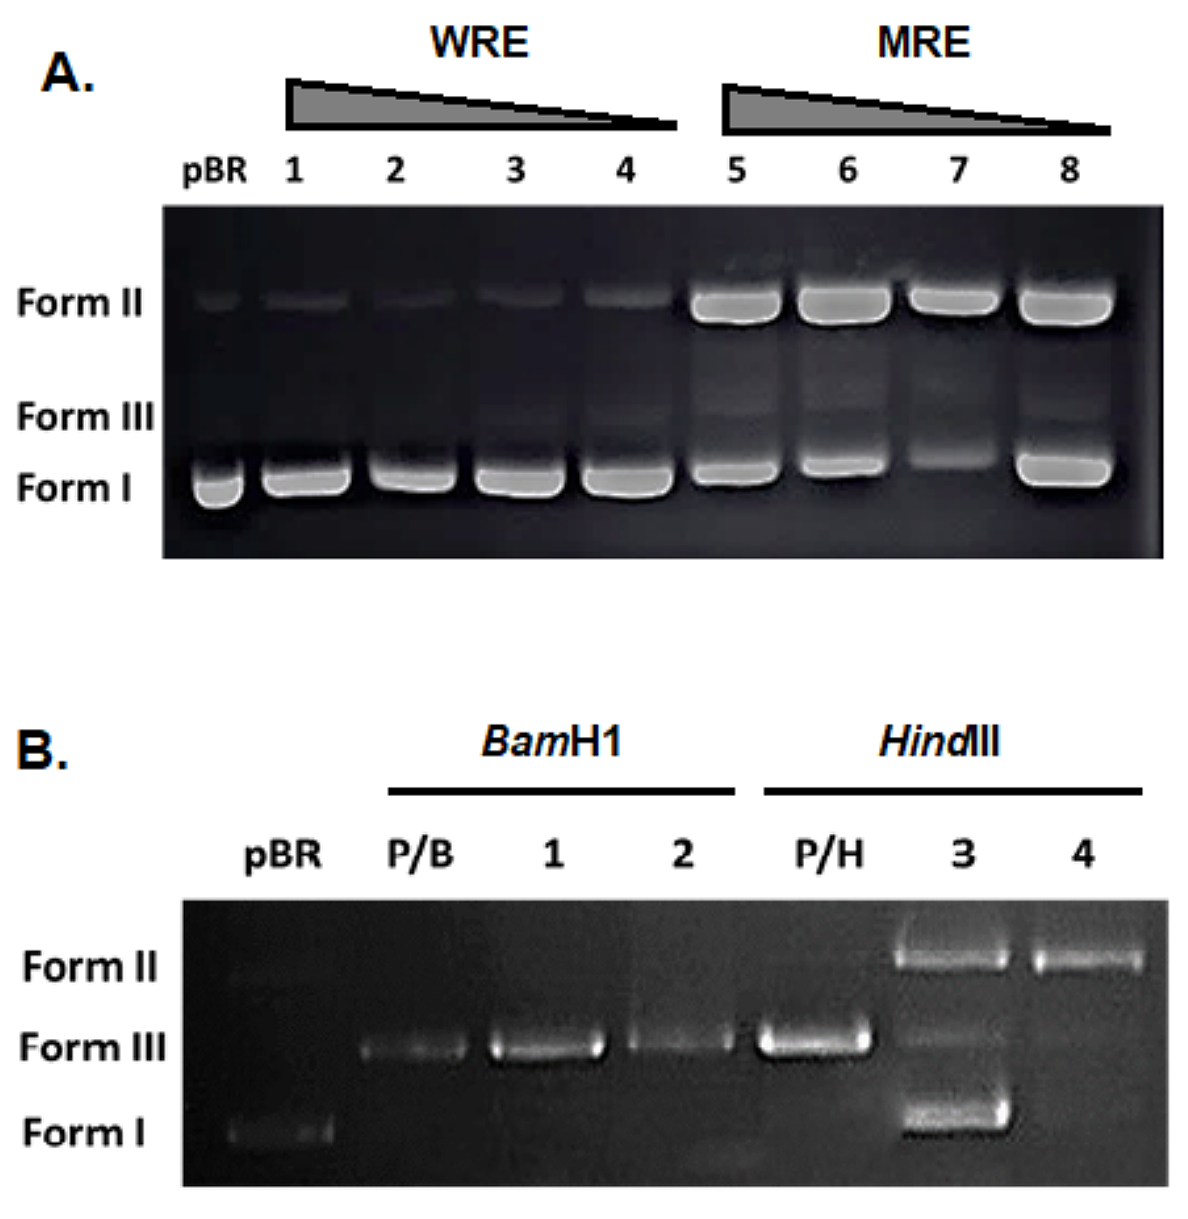
Figure 3. Electrophoretograms showing the effects of R. canina root extracts on DNA interaction and restriction digestion. Note: (A) Electrophoretogram showing the interactions of extracts with pBR322 plasmid DNA incubated with varying concentrations of WRE and MRE of R. canina. Lane pBR: untreated plasmid DNA (control), lane 1-4: WRE treatment; lane 5-8: MRE treatment. The concentration for both extracts corresponds (from left to right) 1000, 500, 250,125 μg/ml of the extract, respectively. (B) Electrophoretogram showing the effects of R.canina root extracts on BamH1 and HindIII restriction digestion. pBR322 plasmid DNA incubated with WRE and MRE of R. canina, and, subsequantialy with BamHI and HindIII restriction endonucleases. Lanes; pBR: only pBR322 plasmid DNA (negative control), lane P/B and P/H: pBR322 treated with BamHI and HindIII, respectively (positive control). lanes 1, 2: pBR322 treated with WRE and MRE followed by BamH1 digestion, lanes 3-4: pBR322 treated with WRE and MRE followed by HindIII digestion.

Figure 4. Electrophoretogram of plasmid DNA after ultraviolet photolysis of H2O2 in the presence and absence of the plant WRE and MRE. Note: pBR = untreated plasmid DNA, PC = a mixture of extract and fenton treated plasmid DNA, Water = WRE treated DNA, Methanol = MRE treated DNA. Incubation time is 90 min for (A) and 120 min for (B).
Rat Blood Glucose Levels and Body Weights
The average values of fasting blood glucose levels and body weight were measured before STZ application, 5 days after STZ induction, and before sacrifice (on the 15th day of the extract application). The results are presented in Tables 4 and 5. In the HDWE group, a decrease in blood glucose levels was compared to the previous blood glucose measurement. Although there was an increase in blood sugar levels in other groups, this increase was less pronounced compared to the DC group. For instance, in the LDWE group, the ratio of blood sugar on the 5th day after STZ/scarification to pre-application was 1.06, while in the DC group, this ratio was determined as 1.5. The body weight of the rats in LDME group slightly decreased compared to previous measurements (Table 5).
Table 4. Blood glucose levels of study groups.
|
Group |
Before STZ administration (mg/dl) |
5 days after STZ administration (mg/dl) |
Before sacrification (mg/dl) |
|
HC |
97.28 ± 4.95 |
98.75 ± 4.25 |
97.35 ± 4.85 |
|
DC |
87.28 ± 7.06 |
398 ± 6.92 |
596.33 ± 3.51 |
|
LDME-treated |
87.85 ±7.40 |
412 ± 15.87 |
467 ± 10.81 |
|
HDME- treated |
89.28 ± 12.56 |
373.66 ± 11.5 |
532.66 ± 14.36 |
|
LDWE- treated |
91.14 ± 7.35 |
556 ± 7.07 |
593.85 ± 12.41 |
|
HDWE- treated |
89.14 ± 8.47 |
500.25 ± 14.26 |
234.66 ± 15.04 |
Note: Mean±SD values of each group (n=7) represented (HC = Healthy control; DC = Diabetic control; LDME = Low-dose methanol extract, HDME = High dose methanol extract; LDWE = Low dose water extract, HDWE = High dose water extract).
Table 5. Mean body weight of study groups.
|
Group |
Before STZ administration (g) |
5 days after STZ administration (g) |
15th day of extract application (g) |
|
HC |
268.33 ± 7.37 |
318 ± 11.97 |
362.27 ± 11.01 |
|
DC |
250.75 ± 13.81 |
276.75 ± 10.43 |
284.66± 11.93 |
|
LDME-treated |
248.5 ± 8.52 |
282.8 ± 7.98 |
260.53 ± 8.20 |
|
HDME- treated |
245 ± 12.61 |
270 ± 4.58 |
275.2 ± 3.74 |
|
LDWE- treated |
248.71 ± 12.69 |
279.25 ± 8.92 |
263.76 ± 7.12 |
|
HDWE- treated |
258.28 ± 10.57 |
266.28 ± 11.78 |
287.5 ± 12.02 |
TNF-α and IL-1β expression
levels
Data from healthy, diabetic, and REtreated groups (Figure 5) show that R. canina root extract reduced TNF-α and IL-1β gene expression in diabetic rats. The most significant decrease was observed between the REtreated and diabetic control groups.
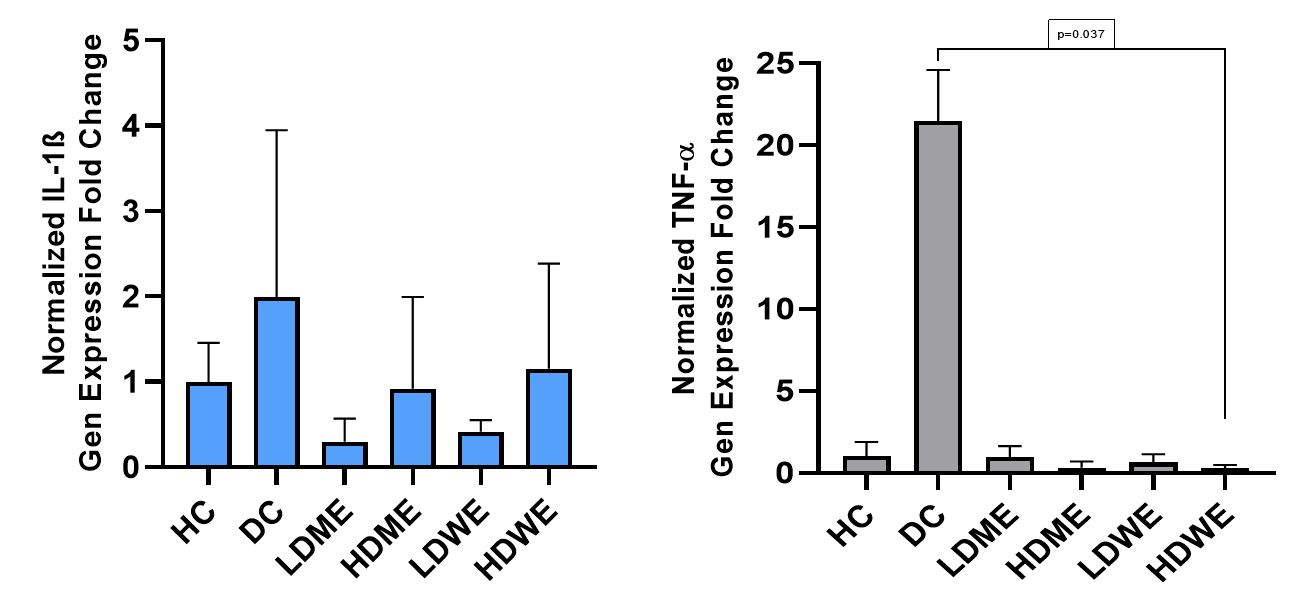
Figure 5. TNF-α and IL-1β gene expression levels between groups. Note: For evaluation of the expression levels of the genes, the 2−ΔΔCt method was used after normalization of expression levels against β-actin mRNA level.
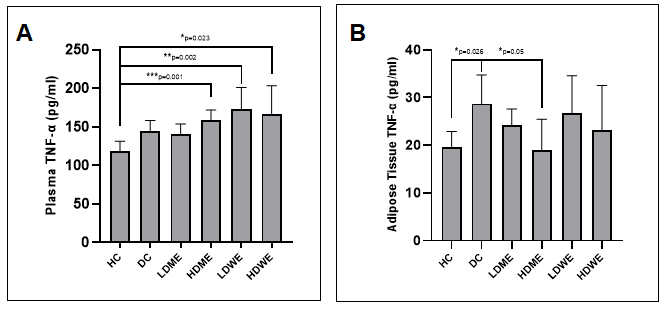
Figure 6. The graphic presenting the effect of R.canina root extracts on the plasma (A) and adipose tissue (B) TNF-ɑ levels in diabetes induced rats. Note: HC = Healthy control; DC = Diabetic control; LDME = Low-dose methanol extract, HDME = High dose methanol extract; LDWE = Low dose water extract; HDWE = High dose water extract-treated animals.
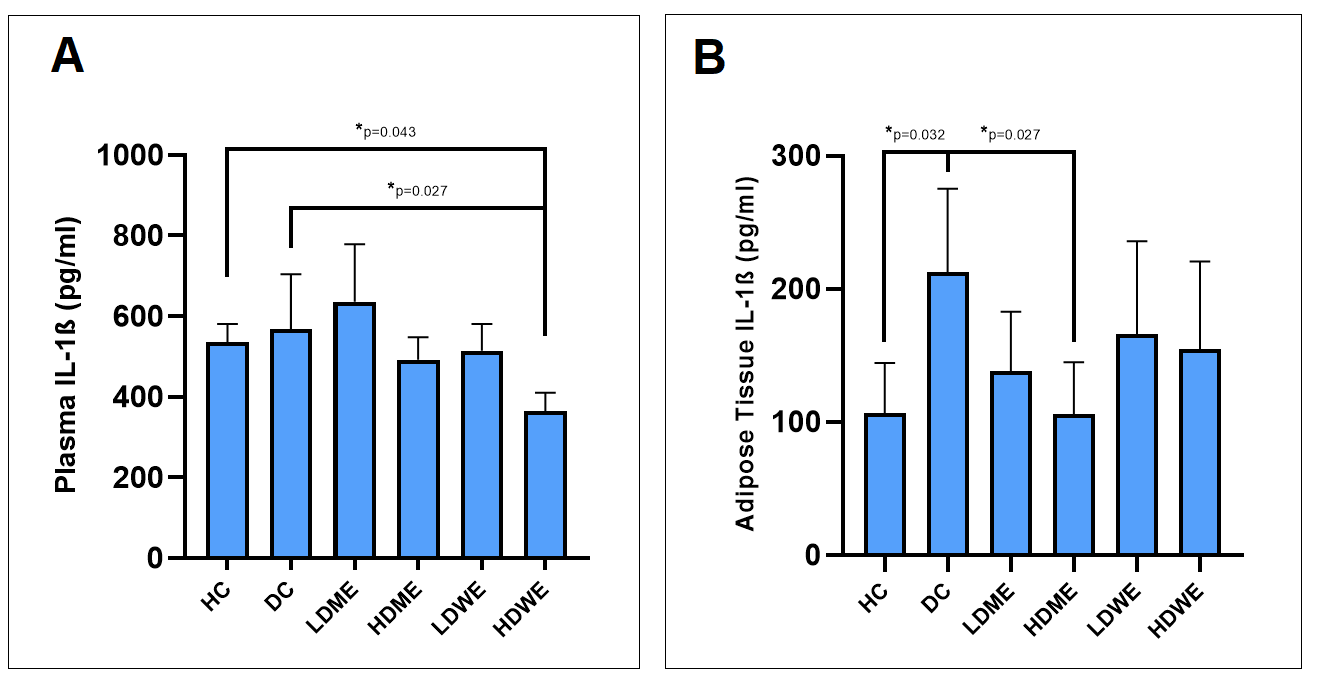
Figure 7. The graphic presenting the effect of R.canina root extracts on the plasma (A) and adipose tissue (B) IL-1β levels in diabetes induced rats. Note: HC = Healthy control; DC = Diabetic control; LDME = Low-dose methanol extract, HDME = High dose methanol extract; LDWE = Low dose water extract; HDWE = High dose water extract-treated animals.
Serum TNF-α and IL-1β Levels
The graphical presentations and mean values ± SD obtained from ELISA for TNF-ɑ are provided in Figure 6 and Table 6, respectively. When examining plasma levels of TNF-ɑ, no statistically significant difference was found between the diabetic control group and the extract-treated groups. However, a statistically significant decrease in TNF-alpha levels in adipose tissues was observed between the HDME-treated group and the diabetic control (Figure 6). On the other hand, graphical presentations, and mean values ± SD obtained from ELISA for IL-1β are presented in Figure 7 and Table 7, respectively. Plasma IL-1β levels were found to be significantly lower in the HDWE group compared to the Diabetic Control (Figure 7A). Similarly, in adipose tissue, IL-1β levels were significantly lower in diabetic animals treated with HDME compared to the Diabetic Control group (Figure 7B).
Table 6. The effect of R.canina root extracts on the plasma and adipose tissue TNF-ɑ levels in diabetes induced rats (pg/ml).
|
Study group |
TNF-ɑ in Plasma (pg/ml) |
TNF-ɑ in Fat tissue (pg/ml) |
|
Healthy control |
119.05±12.53 |
19.57±3.34 |
|
Diabetic control |
145.20±13.21 |
28.71±6.03 |
|
LDME-Low-dose methanol extract treated |
140.38±13.62 |
24.17±3.45 |
|
HDME-High-dose methanol extract treated |
158.58±13.32 |
18.93±6.53 |
|
LDWE-Low-dose water extract treated |
173.34±27.91 |
26.75±7.83 |
|
HDWE-High-dose water extract treated |
167.22±36.39 |
23.20±9.36 |
Note: Each group contains 7 animals. Experiments performed at least triplicate and mean values±SD were presented.
In Silico Analysis
The initial step in exploring inhibitor activity for antidiabetic effects involves analyzing ligands targeting specific proteins. In this study, ligands derived from bioactive components of R. canina were investigated for their inhibitory behaviors against TNF-α and IL-1β proteins, both in vitro and in vivo. The results revealed remarkably high inhibitory activity against TNF-α, particularly with Kaempferol 3-O-glucoside exhibiting the highest binding score of -9.8. For IL-1β, Rutin showed the highest binding score of 7. A heatmap was plotted using an online platform for data analysis and visualization. Upon examining detailed docking analysis results, interactions were observed: Kaempferol 3-O-glucoside/TNF-α showed 6 conventional hydrogen bonds, 17 Van der Waals interactions, and 1 unfavorable hydrogen bond (Figure 9a). On the other hand, Rutin/IL-1β showed 3 conventional hydrogen bonds, 2 unfavorable hydrogen bonds, 5 Van der Waals interactions, 1 carbon-hydrogen bond, 1 amide-pi stacked interaction, and 2 different pi-alkyl interactions with the same residue (Figure 9b).
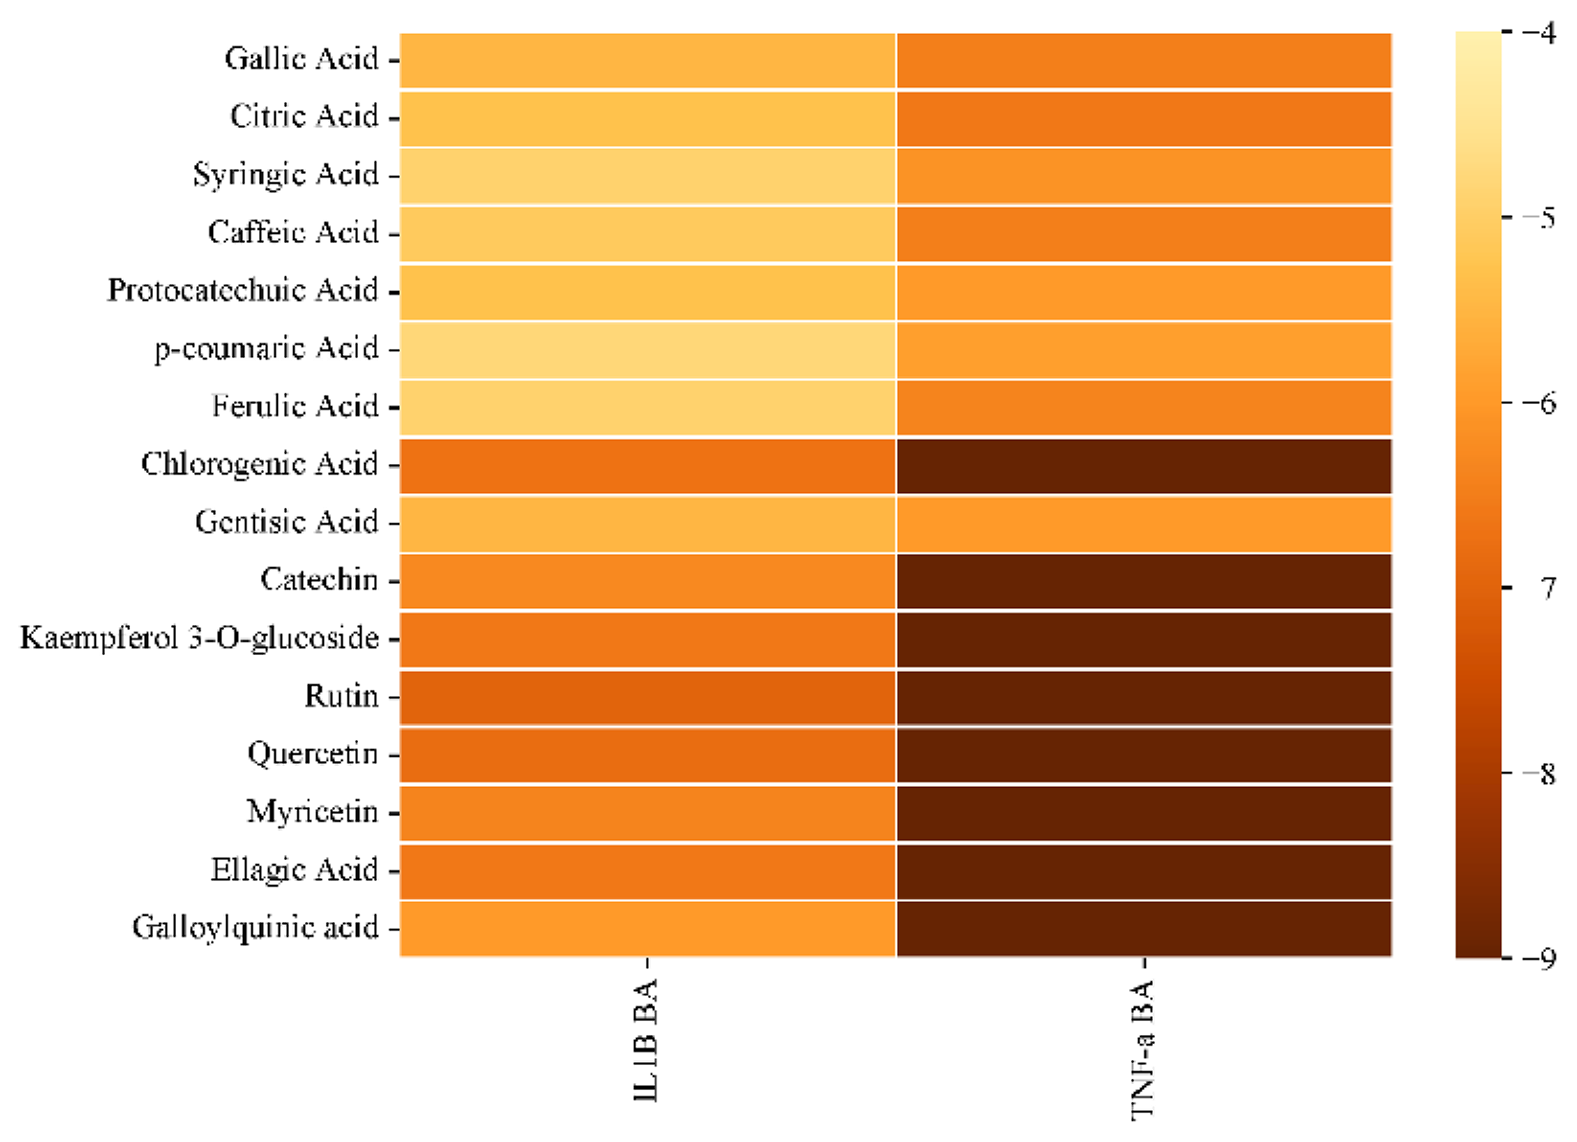
Figure 8. Clustered hierarchical heatmap showing quantified compounds from R. canina.
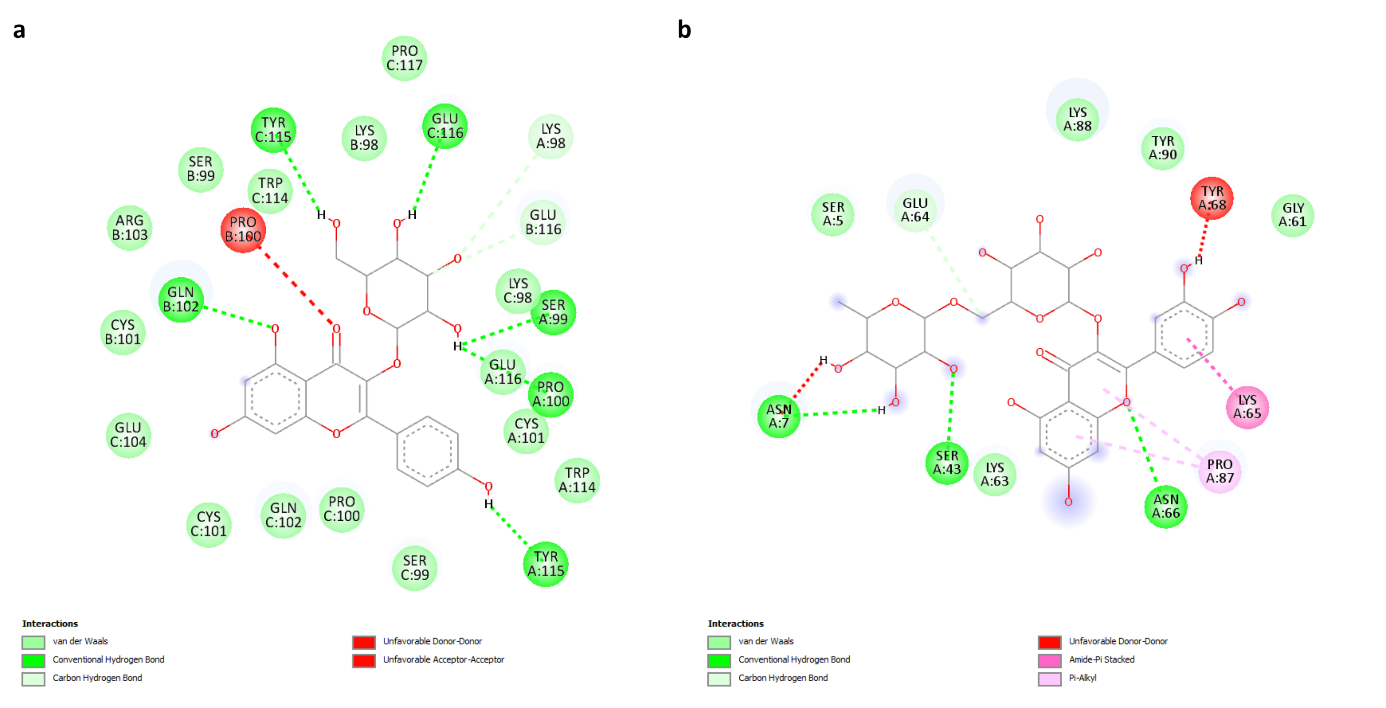
Figure 9. Two dimensional binding geometry of Kaempferol 3-O-glucoside (a) and Rutin (b).
With the help of the SwissADME platform and the BOILED-Egg approach (Figure 10), the absorption parameters of R. canina phenolic compounds (Table 7) had been investigated. The presence of compounds in the same egg yolk or white means that these compounds may have similar/common metabolic properties. This is a statement that they undergo similar metabolic transformations in the body.
Regarding ADMET modeling, the term "PGP" commonly refers P-glycoprotein, and it is a membrane carrier protein significantly influences the absorption and distribution of drugs within the body. As seen in Figure 10 circles around the numbers indicate P-glycoprotein substrates and unlike other bioactive components, Gentisic Acid is identified as a substrate for P-glycoprotein. Also, Kaempferol 3-O-glucoside was found to be out of the model range. The ADMET properties of Kaempferol 3-O-glucoside and Rutin were thoroughly assessed through comprehensive in silico analyses (Table 8). Notably, the results of ADMET tables revealed promising characteristics for these compounds. Both Kaempferol 3-O-glucoside and Rutin demonstrated high inhibitory activity against TNF-alpha, suggesting their potential utility in mitigating inflammatory processes.
Table 7. List table of the phenolic compounds whose ADMET properties were predicted.
|
Canonical SMILES |
Compounds |
|
C1=C(C=C(C(=C1O)O)O)C(=O)O |
Gallic Acid |
|
C(C(=O)O)C(CC(=O)O)(C(=O)O)O |
Citric Acid |
|
COC1=CC(=CC(=C1O)OC)C(=O)O |
Syringic Acid |
|
C1=CC(=C(C=C1C=CC(=O)O)O)O |
Caffeic Acid |
|
C1=CC(=C(C=C1C(=O)O)O)O |
Protocatechuic Acid |
|
C1=CC(=CC=C1C=CC(=O)O)O |
p-coumaric Acid |
|
COC1=C(C=CC(=C1)C=CC(=O)O)O |
Ferulic Acid |
|
C1C(C(C(CC1(C(=O)O)O)OC(=O)C=CC2=CC(=C(C=C2)O)O)O)O |
Chlorogenic Acid |
|
C1=CC(=C(C=C1O)C(=O)O)O |
Gentisic Acid |
|
C1C(C(OC2=CC(=CC(=C21)O)O)C3=CC(=C(C=C3)O)O)O |
Catechin |
|
C1=CC(=CC=C1C2=C(C(=O)C3=C(C=C(C=C3O2)O)O)OC4C(C(C(C(O4)CO)O)O)O)O |
Kaempferol 3-O-glucoside |
|
CC1C(C(C(C(O1)OCC2C(C(C(C(O2)OC3=C(OC4=CC(=CC(=C4C3=O)O)O)C5=CC(=C(C=C5)O)O)O)O)O)O)O)O |
Rutin |
|
C1=CC(=C(C=C1C2=C(C(=O)C3=C(C=C(C=C3O2)O)O)O)O)O |
Quercetin |
|
C1=C(C=C(C(=C1O)O)O)C2=C(C(=O)C3=C(C=C(C=C3O2)O)O)O |
Myricetin |
|
C1=C2C3=C(C(=C1O)O)OC(=O)C4=CC(=C(C(=C43)OC2=O)O)O |
Ellagic Acid |
|
C1C(C(C(C(C1(C(=O)O)O)C(=O)C2=CC(=C(C(=C2)O)O)O)O)O)O |
Galloylquinic acid |
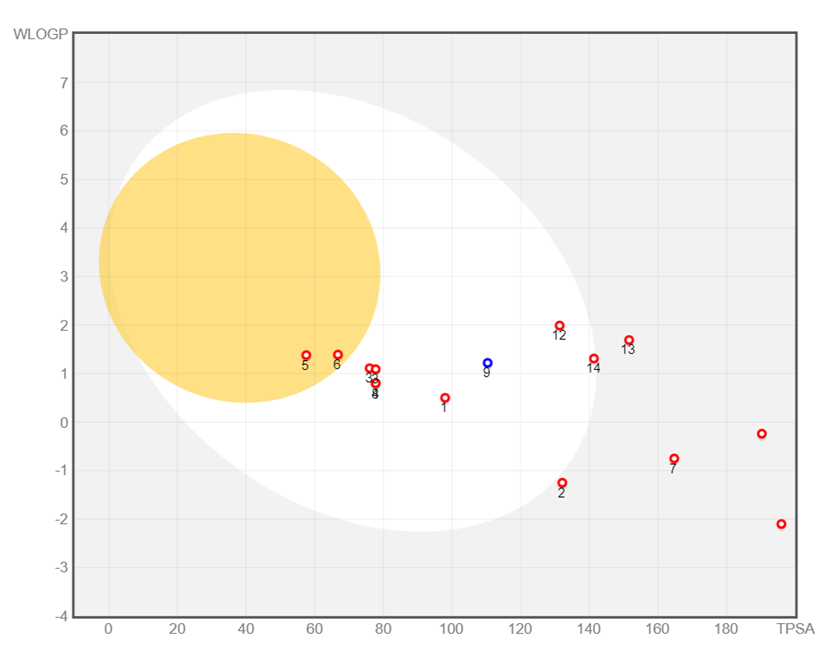
Figure 10. The BOILED-Egg model for monitoring phenolic chemicals. Note: Bioactive compounds are numbered in the order given in the Table 7.
Furthermore, their ADMET profiles indicated favorable attributes, implying good absorption, distribution, metabolism, excretion, and toxicity properties. These findings underscore the potential of Kaempferol 3-O-glucoside and Rutin as promising candidates for further investigation as drug molecules in the context of relevant disease processes.
The ADMET properties of Kaempferol 3-O-glucoside and Rutin were thoroughly assessed through comprehensive in silico analyses (Table 8). Notably, the results of ADMET tables revealed promising characteristics for these compounds. Both Kaempferol 3-O-glucoside and Rutin demonstrated high inhibitory activity against TNF-alpha, suggesting their potential utility in mitigating inflammatory processes. Furthermore, their ADMET profiles indicated favorable attributes, implying good absorption, distribution, metabolism, excretion, and toxicity properties. These findings underscore the potential of Kaempferol 3-O-glucoside and Rutin as promising candidates for further investigation as drug molecules in the context of relevant disease processes.
Discussion
Based on our results, the DPPH activity of the water root extract was higher than that of the control and methanol extracts, whereas the DPPH activity of the methanol root extract was higher than that of the control. We found that the water root extract had higher iron chelating activity and phenolic content than the methanol extract. The phenolic content of R. canina root extract was higher than that of other Rosa species (28). While previous research has shown that plant leaves, seeds, and fruit have antioxidant properties, this study suggests that plant roots also have high antioxidant properties. We showed that the antioxidant potential of R. canina extracts was higher than that of BHT, which revealed the high antioxidant potential of root extracts. All studies examining the qualitative and quantitative amounts of phenolic compounds in R. canina fruits found comparable results (29).
Although there are not many studies on the polyphenolic composition of root extract in the literature, according to the findings, R. canina fruits from Türkiye showed some phenolic composition similarities with samples taken from Norway, Poland, and Serbia (30). The phenolic acid levels determined in this study are consistent with the findings of Fecka (2009), who assessed the quantities of gallic acid, protocatechuic acid, vanillic acid, chlorogenic acid, p-coumaric acid, ferulic acid, and t-cinnamic acid by HPLC in rose hips (31). Interestingly, R. canina contains the flavonoid tiliroside (kaempferol 3-O-β-d-(6-pcoumaryl)-glycopyranoside), which inhibits the oxidation of human LDL in vitro and has been shown to possess significant antiobesity, antioxidant, cytotoxic, and anti-complement properties in humans. Our study provides the first evidence for the presence of galloylquinic acid in R. canina roots. Galloylquinic acid has protective activity against free radical-induced damage (32). The largest concentrations of phenolic compounds in WRE were found in myricetin (3.26 mg/100g dw) and catechin (2,453.26 mg/100g dw). Galloylquinic acid was found in the methanol extract (5.43 mg/100g dw), which was not reported elsewhere for R. canina. The phenolic content of this plant may be linked to its high antioxidant potential (33).
Our in vitro results show that the untreated plasmid underwent digestion with BamHI and HindIII enzymes, resulting in the sole observation of a band corresponding to form III. Conversely, when plasmid DNA treated with R. canina’s water extract (WRE) and methanol-rich extract (MRE) was subjected to BamHI digestion, a singular linear band emerged, indicative of enzymatic DNA cleavage. Notably, in the HindIII digestion of WRE- and MRE-treated samples, lanes 3 and 4 exhibited three distinct bands denoting forms I, II, and III, implying a state of partial DNA digestion (Figure 2B). In the context of HindIII digestion within the specific A/A region, it was determined that plasmid digestion interacting with the extract is impeded by the extract. The primary interaction of the extract with DNA, leading to the formation of interstrand adducts, could result in conformational changes in the plasmid DNA structure. Consequently, the HindIII restriction enzyme failed to recognize the specific A/A region. These findings confirm that the methanol-rich extract (MRE) does not preserve DNA integrity. In addition, it was determined that the roots of R. canina exhibit a UV-protective effect even at a moderate concentration (1/10 dilution).
Furthermore, considering the data obtained from in
vivo experiments, it has been determined that R.
canina root extracts exhibit promising potential in
reducing elevated blood glucose levels and body mass
in diabetic rats. This discovery unveils a new
perspective on its potential against obesity. The groups
treated with the extract demonstrated significantly
lower blood glucose levels compared to the control
group. Given the known antidiabetic properties of the
species' fruits and fruit seeds, it is plausible to assert
that R. canina possesses a synergistic antidiabetic
effect throughout the entire plant (34).
Table 8. Theoretical ADMET properties of Kaempferol 3-O-glucoside and Rutin.
|
ADMET Properties |
Kaempferol 3-O-glucoside |
Rutin |
Ideal Range |
|
Physicochemical Properties |
|||
|
Molecular Weight (g/mol) |
448.38 |
610.52 |
(50.0/500.0) |
|
Fraction Csp3 |
0.29 |
0.44 |
(≥0.25) |
|
Num. Rotatable Bonds |
4 |
6 |
(1.0/10.0) |
|
Num. H-bond Acceptors |
11 |
16 |
(2.0/20.0) |
|
Num. H-bond Donors |
7 |
10 |
(0.0/6.0) |
|
TPSA Ų |
190.28 |
269.43 |
(≤140.0) |
|
Pharmacological Properties |
|||
|
Consensus Log Po/w |
-0.25 |
-1.29 |
(≥1.0, ≤4.0) |
|
log S (Water Solubility) |
-3.18 |
-3.3 |
(-6.5/0.5) |
|
Solubility Class |
Soluble |
Soluble |
Soluble |
|
GI Absorption |
Low |
Low |
- |
|
BBB Permeant |
No |
No |
No |
|
P-gp Substrate |
No |
Yes |
- |
|
Log Kp (Skin Permeation cm/s) |
-8.52 |
-10.26 |
(cm/h Kp) |
|
Lipinski Rule of 5 Violations |
2 |
3 |
(Max. 4) |
|
Bioavailability Score |
0.17 |
0.17 |
(≥0.10) |
Furthermore, considering the data obtained from in vivo experiments, it has been determined that R. canina root extracts exhibit promising potential in reducing elevated blood glucose levels and body mass in diabetic rats. This discovery unveils a new perspective on its potential against obesity. The groups treated with the extract demonstrated significantly lower blood glucose levels compared to the control group. Given the known antidiabetic properties of the species' fruits and fruit seeds, it is plausible to assert that R. canina possesses a synergistic antidiabetic effect throughout the entire plant (34).
From the pathogenicity of the disease, considering the known association of the inflammatory phenotype with diabetes, an increase in the expression of proinflammatory cytokines has been observed in diabetic patients (35). So, in this study, the levels of TNF-a and IL-1β were examined. It is well-established that TNF-a, released in adipocytes, restricts insulin response within the cell by promoting the phosphorylation of IRS-1. The elevated levels of TNF-a disrupt insulin signaling through serine phosphorylation, contributing to insulin resistance in adipocytes and peripheral tissues, ultimately leading to the development of Type 2 Diabetes Mellitus (T2DM) (36). Additionally, it has been observed that elevated blood glucose levels increase the production of IL-1β in pancreatic cells (37). Based on these information’s, it was observed that the root extract of R. canina reduced the expression of TNF-a and IL-1β genes in diabetic rats. The research demonstrates a decrease in the elevated levels of the proinflammatory cytokine TNF-α by both water and methanol root extracts. This aligns with the in silico results, supporting the emergence of high scores in the analysis of TNF-α. It is plausible to assert that the phenolic components present in the root exhibit a synergistic anti-inflammatory effect, thereby reducing sugar levels in rats. Hence, the bioactive composition of the plant manifests both antidiabetic and anti-inflammatory effects. Regarding inflammatory parameters, oral supplementation with LDWE and HDWE resulted in a significant reduction in serum TNF-a and IL-1 beta levels in diabetic rats when compared to untreated diabetic rats (TNF-a: 1.64, 0.83, and IL-1β: 0.48, 2.04, respectively). This reduction was noteworthy compared to the diabetic control group (TNF-α: 42.26, and IL-1β: 4.34).
However, the difference in serum TNF-a and IL-1 beta levels between high and low doses of methanol and water extracts was not statistically significant. This suggests an extract-independent effect, highlighting that the extracts exert an effect irrespective of concentration. The results obtained from in silico analyses indicate that the kaempferol 3-O-glucoside compound present in the plant extract is effective in inhibiting TNF-α, and the inhibitory mechanism occurs through a highly potent binding activity. Additionally, rutin exhibited the highest activity for IL-1β. Considering that both bioactive components are found in methanolic extracts and the significant reduction in inflammatory expressions in methanolic extracts by in vivo experiments, it can be said that methanolic extracts of R. canina are more effective both in vivo and in silico in terms of their antidiabetic activity, and the contribution of these two compounds to this effect is considerable.
After predicting the ADMET properties of compounds exhibiting high activity, optimal resolution, non-toxic, and non-carcinogenic activities were determined. Based on these findings, it is possible to assert that compounds demonstrating high anti-inflammatory activity in the root extract of the plant are potential drug candidates with high druggability (38).
Conclusion
Inflammation associated with IL-6 and TNF-α has been reported as a critical factor in diabetes literature. The root extract of R. canina is a promising candidate for an anti-inflammatory agent based on its impact on cytokine levels and biological activity. The results obtained from conducted in vivo and in silico analyses revealed that the compounds kaempferol 3-O-glucoside and rutin present in R. canina methanol extracts (at concentrations of 119.85 and 25.72 mg.100-1 dw, respectively) exhibit strong inhibitory and suppressive effects on inflammatory cytokines to a significant extent. Furthermore, the examined ADMET properties highlight the pharmaceutical suitability of these two compounds. Further in vitro and in vivo studies are needed to elucidate the properties of the root extract and its potential benefits in diabetes treatment.
Declarations
Ethics Statement
The investigation was permitted by the Gazi University Ethics Committee, (Approval Date: 26.06.2020) and followed the instructions for the care and use of laboratory animals published by the "Compliance with ethical rules" specified in the 13th article of the Gazi University Ethics Committee.
Data Availability
The datasets generated during and/or analyzed during the current study are available from the corresponding author on reasonable request.
Funding Information
Gazi University Scientific Research Projects Coordination Unit (Project no: 05/2020-24).
Conflict of Interest
The authors declare no conflicting interest.
References
- Care ADAJD. Standards of medical care in diabetes—2009. 2009;32(Suppl 1):S13.
- Dal Canto E, Ceriello A, Rydén L, Ferrini M, Hansen TB, Schnell O, et al. Diabetes as a cardiovascular risk factor: An overview of global trends of macro and micro vascular complications. 2019;26(2_suppl):25-32.
- Harding JL, Pavkov ME, Magliano DJ, Shaw JE, Gregg EWJD. Global trends in diabetes complications: a review of current evidence. 2019;62:3-16.
- Rao V, Rao LV, Tan SH, Candasamy M, Bhattamisra SKJD, Research MSC, et al. Diabetic nephropathy: an update on pathogenesis and drug development. 2019;13(1):754-62.
- Fakhruddin S, Alanazi W, Jackson KEJJodr. Diabetes-induced reactive oxygen species: mechanism of their generation and role in renal injury. 2017;2017.
- Hildebrandt X, Ibrahim M, Peltzer NJCD, Differentiation. Cell death and inflammation during obesity:“Know my methods, WAT (son)”. 2023;30(2):279-92.
- Swaroop JJ, Rajarajeswari D, Naidu JJTIjomr. Association of TNF-α with insulin resistance in type 2 diabetes mellitus. 2012;135(1):127.
- Sun Q, Li J, Gao FJWjod. New insights into insulin: The anti-inflammatory effect and its clinical relevance. 2014;5(2):89.
- Qiao Y-c, Shen J, He L, Hong X-z, Tian F, Pan Y-h, et al. Changes of regulatory T cells and of proinflammatory and immunosuppressive cytokines in patients with type 2 diabetes mellitus: a systematic review and meta-analysis. 2016;2016.
- Esser N, Legrand-Poels S, Piette J, Scheen AJ, Paquot NJDr, practice c. Inflammation as a link between obesity, metabolic syndrome and type 2 diabetes. 2014;105(2):141-50.
- Akash MSH, Rehman K, Liaqat AJJocb. Tumor necrosis factor‐alpha: role in development of insulin resistance and pathogenesis of type 2 diabetes mellitus. 2018;119(1):105-10.
- Wang T-y, Wang W, Li F-f, Chen Y-c, Jiang D, Chen Y-d, et al. Maggot excretions/secretions promote diabetic wound angiogenesis via miR18a/19a – TSP-1 axis. Diabetes Research and Clinical Practice. 2020;165:108140.
- Maione F, Russo R, Khan H, Mascolo NJNpr. Medicinal plants with anti-inflammatory activities. 2016;30(12):1343-52.
- Demir F, Özcan MJJofe. Chemical and technological properties of rose (Rosa canina L.) fruits grown wild in Turkey. 2001;47(4):333-6.
- Doğan ŞJMFD. XIV.-XV. yüzyıl Türkçe tıp metinlerinde halk hekimliği izleri. 2011.
- Khazaei M, Khazaei M, Pazhouhi MJW. An overview of therapeutic potentials of Rosa canina: A traditionally valuable herb. 2020;7:e1580.
- Demir N, Yildiz O, Alpaslan M, Hayaloglu AJL-fs, technology. Evaluation of volatiles, phenolic compounds and antioxidant activities of rose hip (Rosa L.) fruits in Turkey. 2014;57(1):126-33.
- Moustafa EM, Araby E, Elbahkery ALJEJoRS, Applications. Assessing the Antimicrobial, Antioxidant and Anti-inflammatory Potential of Ethanolic Extract of Irradiated Rosa canina L. Fruits. 2021;34(1):27-43.
- Schaich KM, Tian X, Xie JJJoff. Hurdles and pitfalls in measuring antioxidant efficacy: A critical evaluation of ABTS, DPPH, and ORAC assays. 2015;14:111-25.
- Adjimani JP, Asare PJTr. Antioxidant and free radical scavenging activity of iron chelators. 2015;2:721-8.
- Agbor GA, Vinson JA, Donnelly PEJIJoFS, Nutrition, Dietetics. Folin-Ciocalteau reagent for polyphenolic assay. 2014;3(8):147-56.
- Ouerghemmi S, Sebei H, Siracusa L, Ruberto G, Saija A, Cimino F, et al. Comparative study of phenolic composition and antioxidant activity of leaf extracts from three wild Rosa species grown in different Tunisia regions. Industrial Crops and Products. 2016;94:167-77.
- Oda T, Yamazumi Y, Hiroko T, Kamiya A, Kiriya S, Suyama S, et al. Mex-3B induces apoptosis by inhibiting miR-92a access to the Bim-3′ UTR. 2018;37(38):5233-47.
- Aydın B, Gönder LY, Çerçi NA, Ateş YC, Yalçınkaya İS, Canbolat N, et al. Biological activities and DNA interactions of aqueous extract of Phlomis linearis (Boiss. & Bal.). 2023;3(1):73-85.
- Al-Mahmood S, Razak TA, Abdullah ST, Fatnoon NA NN, Mohamed AH, Al-Ani IMJMJoHR. A comprehensive study of chronic diabetes complications in streptozotocin-induced diabetic rat. 2016;20(2):4.
- Shah K, Maghsoudlou PJBjohm. Enzyme-linked immunosorbent assay (ELISA): the basics. 2016;77(7):C98-C101.
- Pettersen EF, Goddard TD, Huang CC, Couch GS, Greenblatt DM, Meng EC, et al. UCSF Chimera—a visualization system for exploratory research and analysis. 2004;25(13):1605-12.
- Tumbas VT, Canadanović-Brunet JM, Cetojević-Simin DD, Cetković GS, Ethilas SM, Gille L. Effect of rosehip (Rosa canina L.) phytochemicals on stable free radicals and human cancer cells. Journal of the science of food and agriculture. 2012;92(6):1273-81.
- Zadernowski R, Naczk M, Nowak‐Polakowska HJJotAOCS. Phenolic acids of borage (Borago officinalis L.) and evening primrose (Oenothera biennis L.). 2002;79(4):335-8.
- Bisla G, Choudhary S, Chaudhary VJTSWJ. Evaluation of the nutritive and organoleptic values of food products developed by incorporated Catharanthus roseus (Sadabahar) fresh leaves explore their hypoglycemic potential. 2014;2014.
- Fecka IJPA. Qualitative and quantitative determination of hydrolysable tannins and other polyphenols in herbal products from meadowsweet and dog rose. 2009;20(3):177-90.
- Moore JP, Westall KL, Ravenscroft N, Farrant JM, Lindsey GG, Brandt WFJBJ. The predominant polyphenol in the leaves of the resurrection plant Myrothamnus flabellifolius, 3, 4, 5 tri-O-galloylquinic acid, protects membranes against desiccation and free radical-induced oxidation. 2005;385(1):301-8.
- Al-Rowais NAJSmj. Herbal medicine in the treatment of diabetes mellitus. 2002;23(11):1327-31.
- Ertas B, Hazar-Yavuz AN, Topal F, Keles-Kaya R, Karakus Ö, Ozcan GS, et al. Rosa canina L. improves learning and memory-associated cognitive impairment by regulating glucose levels and reducing hippocampal insulin resistance in high-fat diet/streptozotocin-induced diabetic rats. 2023;313:116541.
- Cieślak M, Wojtczak A, Cieślak MJABP. Role of pro-inflammatory cytokines of pancreatic islets and prospects of elaboration of new methods for the diabetes treatment. 2015;62(1):15-21.
- Li J, Xu J, Qin X, Yang H, Han J, Jia Y, et al. Acute pancreatic beta cell apoptosis by IL-1β is responsible for postburn hyperglycemia: Evidence from humans and mice. 2019;1865(2):275-84.
- Wang Z, Zhang S, Xiao Y, Zhang W, Wu S, Qin T, et al. NLRP3 Inflammasome and Inflammatory Diseases. Oxidative medicine and cellular longevity. 2020;2020:4063562.
- Riaz A, Rasul A, Hussain G, Zahoor MK, Jabeen F, Subhani Z, et al. Astragalin: a bioactive phytochemical with potential therapeutic activities. 2018;2018.

 ETFLIN
Notification


