RESEARCH ARTICLE
Evaluation of Total Flavonoid Content, Xanthine Oxidase Inhibition, and Uric Acid Inhibitory Activity In Vitro and In Vivo of Ethanol Extract of Sida rhombifolia
Academic Editor: Burak Kuzu
Sciences of Pharmacy|Vol. 3, Issue 3, pp. 144-152 (2024)
Views
Downloads
Shares
Received
Jun 3, 2024Revised
Jul 31, 2024Accepted
Aug 2, 2024Published
Sep 1, 2024
Abstract
Keywords:
Introduction
Gout, or hyperuricemia (HPU), occurs when uric acid levels increase in the body. HPU is one of the most common inflammatory joint diseases. Conditions that can cause hyperuricemia include decreased uric acid excretion or increased uric acid synthesis (1, 2). The most common clinical manifestation of hyperuricemia is the crystallization and deposition of uric acid in the joints and surrounding tissues (3). Gout is found worldwide, and its prevalence varies from one country to another. It is the most common cause of inflammatory arthritis in men, with a prevalence estimated at 13.6 per 1000 men and 6.4 per 1000 women. This prevalence increases with age, with an average of 7% in men aged > 75 years and 3% in women aged > 85 years (2). Efforts to manage hyperuricemia include adhering to a low-purine diet, consuming healthy vegetables, and engaging in sufficient exercise. However, if non-pharmacological measures do not reduce uric acid levels below 6.8 mg/dL, pharmacological treatment is necessary (1, 3, 4).
HPU drugs, such as allopurinol, belong to the uricostatic class of medications. These drugs work by inhibiting the XO enzyme, which is responsible for converting hypoxanthine and xanthine into uric acid, thereby reducing the concentration of uric acid in the body (1, 5). Allopurinol, which is a synthetic drug, can cause various side effects in patients, including liver disorders, gastrointestinal issues, skin rashes, and a reduction in red blood cells, among others. Therefore, there is a need for alternative herbal medicines that can provide pharmacological effects similar to those of allopurinol (3, 6).
Indonesia has many efficacious plants that have been used as medicinal ingredients for a long time, as evidenced by herbal medicine products and other traditional remedies. Among the diverse biodiversity found in Indonesia, several plants have the potential to inhibit the activity of the XO enzyme. Some plants that can be used as XO enzyme inhibitors include sidaguri (Sida rhombifolia L. ) (5). Sidaguri (SR), a member of the Malvaceae family, is known for its various medicinal properties. SR is a plant that is easy to find in Indonesia (5, 7). It is a wild plant that is rarely cultivated. Empirically, this plant is used by people to relieve pain, inflammation, gout, jaundice, vomiting blood, worms, and toothache. SR contains metabolites from various groups of compounds, such as phenolic acids, flavonoids, coumarins, steroids, porphyrins, alkaloids, and fatty acids (8), as well as tannins, terpenoids, saponins, and alkaloids (9). The flavonoids found in SR leaves extract are believed to act as xanthine oxidase inhibitors and have diuretic effects. SR is considered an alternative treatment for gout (10). Research by Karamah et al. (2023) has shown that there are differences in the compound content in different parts of the SR plant. Seven metabolites were identified only in the leaves, three in the stems, and another 18 in both leaves and stems (9). The secondary metabolite compounds in the SR plant that are believed to have antihyperuricemia activity belong to the flavonoid group (11, 12). The flavonoid compounds known to be present in the 96% ethanol extract of SR include quercetin, kaempferol, glutinoside, epicatechin, and kaempferol-3-O-D-glucose-6'-D-rhamnose (8).
The diversity of metabolite compounds in the extract makes it challenging to isolate the active compound that plays the most significant anti-hyperuricemic role. The choice of a suitable solvent for extraction greatly influences the levels of metabolites obtained, particularly the flavonoid levels, which are believed to play an important role in anti-hyperuricemia activities (13). This study aims to compare flavonoid levels, XO inhibitory activity, and reduced uric acid levels from SR extract using both in vitro and in vivo methods. Previous research indicates that the roots, stems, and leaves of the SR plant contain flavonoid compounds that are likely involved in inhibiting hyperuricemia, making it necessary to determine flavonoid levels to identify the metabolites responsible for this activity. Ethanol is used as the solvent for extracting flavonoids from plants because it is a universal solvent and the most effective for extracting flavonoids. It is expected that the extraction process will yield a high concentration of flavonoids, which will, in turn, allow for a detailed examination of the xanthine oxidase inhibitory activity of each part of the plant. This data will support the role of these compounds in anti-hyperuricemia treatment.
Experimental Section
Materials and Tools
The samples of leaves, stems, stems, roots and herbs of SR obtained as dried Simplicia from the Bogor Research Institute for Medicinal and Aromatic Plants (BALITRO) (Determination No. 766/UN2. F3.11/PDP.02.00/2021 by Biology Departement FMIPA, Indonesia University, Indonesia). The chemical material is Xanthine Oxidase Activity Colorimetric/Fluorometric Assay Kit (Biovision, Biovision Incorporated, USA), ethanol 96% and Glacial acetic acid (Merk, Darmstadt, Germany), AlCl3, (Sigma Aldrich, Sigma Chemical Company, Singapore). The equipment is Microplate Spectrophotometer (Thermo Scientific™ Multiskan™ GO, Finlandia), micropipette (DRAGONLAB, Beijing, China), analytical balance (AND HR-120 (A& D Comp, Ltd. , Tokyo, Japan), blender philips HR2116/01 (Philips, Indonesia), Atomic Absorption Spectrophotometer with Flame, GFA, HVG dan MVU, AA-7800F (SHIMADZU, Japan)
Preparation of Simplisia Powder
The samples were dried under sunlight for 3 days. The dried simplicia were ground using a blender, sieved using sieves no. 4 and 18 and weighed (14).
Determination of Organic Contaminant
To determine the level of organic contaminants (OC), 25-500 g of whole or chopped simplicia was weighed and spread on a flat plate (on clean paper). It was then divided into four groups, and each group was selected and separated from foreign organic material using the naked eye or a magnifying glass. Equation 1 was used to calculate the OC where no more than 2% is categorized as safe.
Preparation of Thick Extracts of Sidaguri
SR simplicia powder from the leaves (EESRL), stems (EESRS), roots (EESRR), and herbs (EESRH) was poured into Erlenmeyer flasks, with each flask containing 500 g of simplicia powder. The powder was macerated with 96% ethanol (500 mL) at a ratio of 1: 10 for 3 days at room temperature and then filtered. The three filtrates were concentrated using a rotary vacuum evaporator at a temperature of 50°C, a speed of 60 rpm, and a pressure of 175 mmHg. After the concentration process, the extract was evaporated in an oven at a temperature of 40-50°C until a thick extract was obtained. The extract was weighed, and its yield was calculated (15).
Determination of Extract Quality Parameters
The determination of extract quality parameters was done in two ways: specific and non-specific. Non-specific parameters included drying loss, water content, total ash content, acid-insoluble ash content, residual solvent quantification, and metal contamination quantification. Specific parameters included extract identity, organoleptic tests, determination of ethanol-soluble extract levels, and determination of water-soluble extract levels (15).
Identification of Secondary Metabolites
The phytochemical test in this research was conducted following the Harborne method (16) and was combined with several other studies (17). The phytochemical tests included the identification of the alkaloid group, flavonoid group, saponin group, steroid and triterpenoid group, tannin group, quinone group, coumarin group, and essential oil group.
Determination of Total Flavonoid Levels
The test solution was prepared by dissolving 5 mg of extract in 5 mL of distilled water. The solution was stored in a tightly closed container. The comparison solution was made by dissolving 5 mg of quercetin in 96% ethanol to obtain a concentration of 1000 ppm. A series of dilutions of the comparison solution was then prepared with concentrations of 100, 50, 25, 12.5, and 6.25 ppm. Each concentration was placed in a dark container and tightly closed (17).
The total polyphenol content was measured by pipetting 50 µL of AlCl₃ and 50 µL of extract, then incubating the mixture at room temperature, protected from light, for 15 minutes. The absorption was then measured at a wavelength of 435 nm using a 96-well microplate reader (VersaMax). The percentage of total flavonoids as quercetin in simplicia powder was calculated using a standard curve or by applying the appropriate formula.
Cp means comparative solution levels, Au = absorption test solution, Ap = Absorption of comparison solution, V = volume of test solution before dilution, F = dilution factor of test solution, and W = test material weight.
In Vitro Xanthine Oxidase Inhibition
Standard Curve Preparation
Four microliters of 0.88 M H₂O₂ standard was added to 348 µL of dH₂O to produce a 10 mM H₂O₂ standard. Then, 20 µL of the 10 mM H₂O₂ standard was added to 980 µL of dH₂O to produce a 0.2 mM H₂O₂ standard. A colorimetric test was carried out by adding 0, 10, 20, 30, 40, and 50 µL of the 0.2 mM H₂O₂ standard into a 96-well microplate, and this process was duplicated. The total volume per well was adjusted to 50 µL with dH₂O to produce 0, 2, 4, 6, 8, and 10 nmol/well H₂O₂ standard (18, 19, 15).
Positive Control Samples and Preparations (Allopurinol)
Fifty microliters per well of the test sample was added with 200 µL of Assay Buffer (Xanthine Oxidase Activity Colorimetric/Fluorometric Assay Kit) into a 96-well plate, and then centrifuged for 10 min. The positive control (allopurinol) was prepared by adding 5 µL of allopurinol solution into the wells, and then dH₂O was added until the volume reached 50 µL per well.
Preparation of Enzyme and Substrate
Fifty microliters of enzyme and substrate preparation solution was added to each well. Then, 50 µL of solutions, including standard H₂O₂, positive control (allopurinol), and test sample, was added to each well until homogeneous. The samples were measured at a wavelength of 570 nm with an incubation temperature of 25°C for 10-20 min, and were protected from light.
Inhibition of Xanthine Oxidase
The percentage of xanthine oxidase (XO) inhibition was calculated using Equation 3 (15). B means change in absorption of test solution that does not contain blank extract (ABS with enzyme) - blank control (ABS without enzyme) while S means change in absorption of test solution containing sample extract (ABS with enzyme) - control sample (ABS without enzyme). IC50 values were obtained through statistical tests (linear regression analysis and standard deviation) using Microsoft Excel 2406 (build 17726.20160) plotted between concentration and percentage inhibition.
In Vivo Uric Acid Inhibition
Preparation of Test Animals
The test animals used were male white mice of the DDY strain, aged 2-3 months, with a body weight ranging from 20-30 g. A total of 35 test animals were included, consisting of 7 groups: the normal group (not induced), negative group (potassium oxonate), positive group (allopurinol), and dose groups (50, 100, 200, 400 mg/kg BW) of EESRL. The test animals were first adapted for 7 days to adjust to the environment. The body weight of the mice was measured to adjust the dose to be administered (15, 20).
Preparation of 0.2% Allopurinol Suspension
A 0.5% Na CMC solution was prepared by weighing approximately 0.5 g, dissolving it in hot water, and leaving it for approximately 24 h until it swelled. The expanded Na CMC was stirred until homogeneous. Allopurinol powder (0.2 g) was then mixed with the expanded Na CMC until homogeneous, and distilled water was added to reach a total volume of 100 mL.
Induction of Hyperuricemia
The test animals were induced with a suspension of 250 mg/kg BW of potassium oxonate orally for 7 days, except for the normal group. The induction process was carried out for up to 7 days.
Animal Grouping and Treatment
The test animals were divided into 7 groups, with the grouping being carried out completely randomly, ensuring a minimum number per group as determined by Federer's formula.
Male white mice of the DDY strain were divided into 7 groups: Group 1 served as the normal control, Group 2 as the negative control, which was given potassium oxonate at a dose of 250 mg/kg BW intraperitoneally (i. p. ). Group 3 was the positive control, and Group 4, 5, 6, and 7 received a dose of EESRL (50, 100, 200, 400 mg/kg BW), respectively, 1 hour after the administration of potassium oxonate. Blood samples were collected from the positive control group and the dose variation group 1 hour after the administration of Allopurinol and various doses of EESRL.
Blood Collection
The mice were fasted for approximately 12 h before 0.2 mL of blood was collected via the lateral tail vein. The blood was then stored in an Eppendorf tube containing Na EDTA and centrifuged at 3000 rpm for 10 min.
Measurement of Uric Acid Levels
The uric acid measurement reagent was prepared by mixing 1000 µL of reagent 1 with 250 µL of reagent 2. The mixture was incubated for 10 min at 37°C (the reagent was prepared in an amount sufficient for the number of samples to be measured). A total of 1.0 mL (1000 µL) of the prepared reagent was added to 0.0025 mL (25 µL) of serum from the blood sample, shaken, and incubated in all tubes at 37°C for 10 min. Uric acid levels were measured using the enzymatic colorimetric method with a Microlab 300 spectrophotometer at a wavelength of 546 nm.
Result and Discussion
Sample Extraction and Yield
The SR plant samples prepared included the herb, stem, leaves, and roots. This was done to identify the secondary metabolite compounds in each part of the plant. The results of the plant extraction and the yield of the resulting extract are shown in Table 1.
| Simplicity | Powder (g) | Extract (g) | % Yield |
|---|---|---|---|
| Herb | 502.74 | 41.6 | 8.27 |
| Stem | 512.88 | 47.4 | 9.24 |
| Leaf | 504.94 | 50.9 | 10.08 |
| Root | 513.65 | 64.6 | 4.26 |
The yield value determines the amount of extract obtained; the higher the yield, the more extract is produced. A large percentage yield indicates better efficiency and a higher content of metabolites. The low yield from SR roots is thought to be due to the roots’ voluminous characteristics when soaked in organic solvents such as 96% ethanol, causing them to expand during maceration, which requires more solvent for optimal extraction. As a result, the extract from the roots yields very little and does not meet the requirements.
Table 1 shows that the highest yield was from the leaves, at 10.08%. A high yield value indicates a significant content of secondary metabolite compounds in that part of the plant. The higher yield from the leaf extract compared to other parts of the SR plant is likely due to the leaves' high content of green leaf compounds (chlorophyll). During the maceration process with 96% ethanol, chlorophyll (C₅₅H₇₂O₅N₄Mg), a chemical compound with a relatively large molecular weight (21, 17), is extracted, which is thought to contribute to the higher yield values in the leaves compared to other plant parts such as the stems and roots.
Quality Parameters of Sidaguri Ethanol Extract
Testing of SR extract parameters was carried out using both specific and non-specific methods. Analysis of non-specific parameters of plant extracts is essential for understanding the physical and chemical properties of the extracts, such as the presence of inorganic substances, water content, and purity. The total ash content and acid-insoluble ash content determine the mineral content of the extract, while the water-soluble ash content indicates the extract's quality. Analyses of solvent residue and loss on drying assess the extract's purity, while water content measurements are essential for quality control. Analyzing these non-specific parameters is critical for determining the quality and safety of plant extracts. Table 2 presents the test results for the parameters of the 96% ethanol extract of SR.
| Parameters | Results | Standard Requirements | |||
|---|---|---|---|---|---|
| Roots Extract (EESRR) | Stems Extract (EESRS) | Leaves Extract (EESRL) | Herbs Extract (EESRH) | ||
| Water soluble compounds | 17.96% | 44.05% | 53.56% | 55.08% | ≥6% |
| Ethanol soluble compounds | 43.17% | 51.87% | 64.74% | 63.87% | ≥3% |
| Water contents | 2.41% | 15.51% | 6.88% | 12.31% | ≤17.5% |
| Loss on drying | 3.89% | 3.39% | 1.34% | 2.00% | ≤10% |
| Total ash content | 4.7% | 4.68% | 5.2% | 4.47% | ≤5.9% |
| Acid insoluble ash content | 0.74% | 0.35% | 0.35% | 0.27% | ≤0.9% |
| Residual Solvent | 0.396% | 0.538% | 0.417% | Not detected | < 1% |
| Pb metal contamination | Not detected | Not detected | Not detected | Not detected | ≤10 ppm |
| Cd metal contamination | Not detected | Not detected | Not detected | Not detected | ≤0.3 ppm |
| Hg metal contamination | Not detected | Not detected | Not detected | Not detected | ≤0.5 ppm |
| As metal contamination | Not detected | Not detected | Not detected | Not detected | ≤5 ppm |
| Examination | Test | Results (indicating a positive test) | EESRR | EESRS | EESRL | EESRH |
|---|---|---|---|---|---|---|
| Alkaloids | Dragendorff’s test | A. Brownish-reddish precipitate | - | - | - | - |
| Mayer’s test | B. White/yellowish creamy precipitate | - | - | - | - | |
| Flavonoids | Isoamyl alcohol test | The color-appearing upper layer | - | + | + | + |
| Saponins | Foam test | Foam lasting for 10 min | - | + | + | - |
| Quinones | NaOH test | Intensive red color | - | - | - | - |
| Tannins | FeCl3 test | Blue-green color | - | - | + | - |
| Steroids | Libermann-Bouchard | Ether blue or green color | - | + | + | + |
| Triterpenoids | Libermann-Bouchard | Crimson color | + | - | - | + |
| Essential oil | Petroleum ether test | Aromatic smell | + | + | + | + |
| Coumarins | NaOH test | Blue-green fluorescence under UV light | + | + | + | + |
From Table 2, it can be observed that the levels of water- and ethanol-soluble compounds in the root samples are lower than those in the stem, leaf, and herb samples. This suggests that the root samples contain fewer polar secondary metabolite compounds. This observation is consistent with the phytochemical test results in Table 3, which show that polar compounds such as alkaloids, flavonoids, and tannins tested negative in the roots. Based on the test results in Table 2, it can be concluded that all tested parameters meet the standards. This indicates that the extract used is of good quality for further research (15).
Phytochemical Screening
Phytochemical screening was carried out to see the secondary metabolite content of each part of the plant. The phytochemical test data of the SR plant is presented in Table 3.
From Table 3, the most secondary metabolite compounds found in the leaves of the Siliguri plant are six compounds, namely positive for flavonoids, saponins, tannins, steroids, essential oils, and coumarin. Meanwhile, the fewest metabolite compounds found in the roots are positive for containing three component compounds (triterpenoids, essential oils, and coumarin). The coumarin component compounds and positive essential oils are found in all parts of the Siliguri plant, such as roots, stems, leaves, and herbs. Meanwhile, tannins were only found in the leaves, and triterpenoids were only positive for the roots. Tami's research (2014) stated that SR leaves positively contain alkaloids, flavonoids, saponins, tannins and phenols (22). This result is different from the data obtained in Table 3, that SR leaf extract does not contain alkaloids. This could be due to differences in the growing location of the sample plants used. Previous research has not reported many phytochemical test results for the stems and roots of the SR plant, so there is not much data that can be used as a comparison in phytochemical tests for the plant's metabolites.
From phytochemical testing, secondary metabolite compounds (alkaloids) were damaged in all parts of the plant (roots, stems, and leaves). Alkaloid testing in this study only used Dragendorff and Mayer reagents, so it is not enough to conclude that there is no alkaloid compound content in the SR plant. Testing alkaloids with Wagner's reagent needs to be done to find out other types of alkaloids that might react positively with this phytochemical test because the principle of the reaction of testing alkaloids with several reagents is to form a complex compound that reacts with the nitrogen atom in the structure of the alkaloid compound so that it will produce a different color. It varies depending on the reagent used.
Total Flavonoids Content
Calculations of total flavonoid levels were carried out in each part of the plant to confirm the highest flavonoid content of that part. The following is a diagram of the results of testing the total flavonoid levels of all SR extracts (Figure 1).
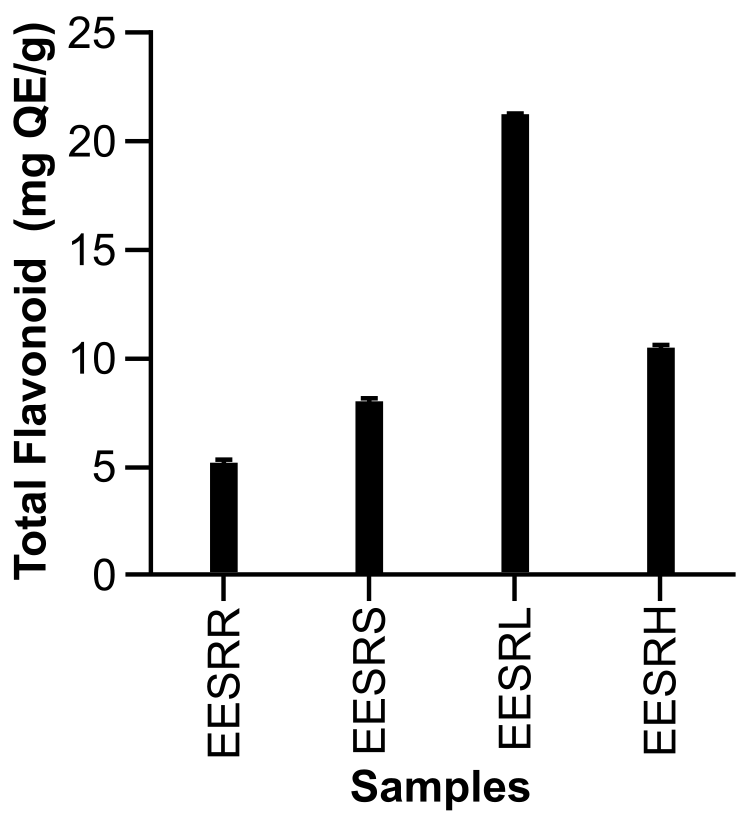
Based on the test results, the flavonoid content of EESRR was 5.23 ± 0.10 mg QE/g, EESRS was 7.87 ± 0.14 mg QE/g, EESRL was 21.29 ± 0.08 mg QE/g, and EESRH was 10.60 ± 0.16 mg QE/g. The highest total flavonoid content in SR was found in the leaves, at 21.29 ± 0.08 mg QE/g extract, while the lowest was in the roots, at 5.23 ± 0.10 mg QE/g. Figure 1 provides information on the levels of quercetin-equivalent flavonoids in the samples. However, the data shows that the smallest flavonoid levels were in the root samples, with 5.23±0.10 mg QE/g. In the phytochemical test results in Table 3, the root extract tested negative for flavonoids. This discrepancy may occur because the color produced in qualitative testing is often not significant due to the reaction, leading to a negative result. It may also be because the sample contains fewer flavonoid compounds compared to other compounds, resulting in often insignificant reactions.
Xanthine Oxidase Inhibition
XO is an enzyme that catalyzes the oxidation of hypoxanthine to xanthine and then catalyzes xanthine to become uric acid, which has an important role in human purine catabolism. The results of testing inhibitory activity with the XO enzyme showed the following data in Figure 2.
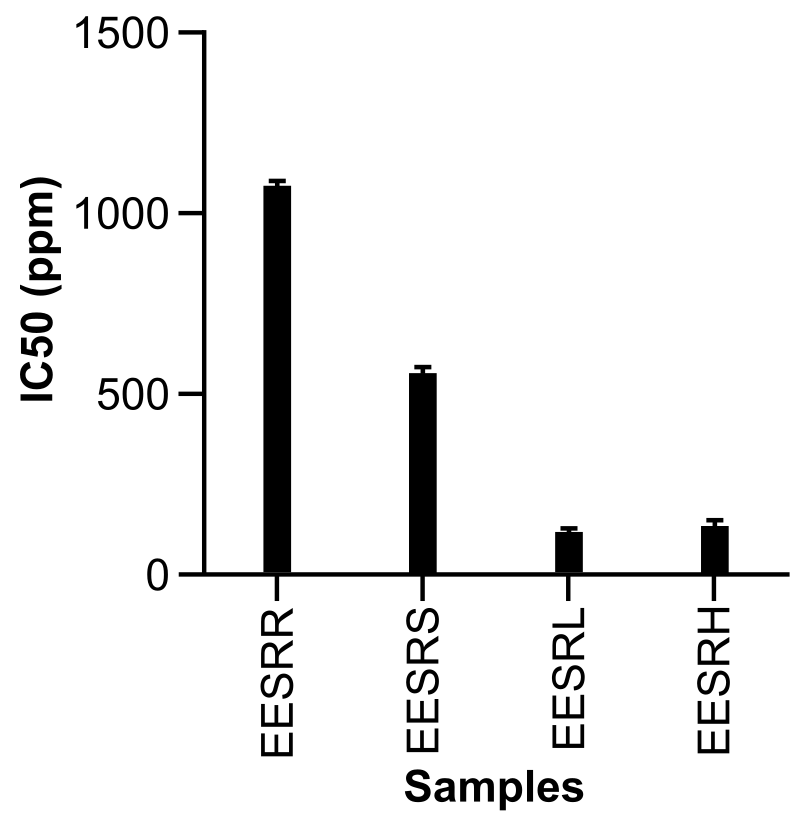
Figure 2 shows that the best IC50 value is for the SR leaves, at 101.84 ± 0.63 ppm. Meanwhile, the IC50 values for EESRR, EESRS, EESRL, and EESRH were 1096.07±1.07 ppm, 561.62±7.01 ppm, 101.84±0.63 ppm, and 104.70±3.50 ppm, respectively. The calculation of the inhibition value for the XO enzyme shows that the absorbance value is inversely proportional to the % inhibition; the smaller the absorbance value, the greater the inhibition value, and a large inhibition value will result in a small IC50 value. The smaller the IC50 value, the greater the xanthine oxidase inhibitory activity. From the IC50 value data, it can be seen that the smallest value is in EESRL, which is likely due to the very high flavonoid content in the leaves compared to other samples. This high flavonoid content leads to greater XO inhibition, resulting in a smaller IC50 value.
Oxygen acts as an electron acceptor during oxidation, producing superoxide anion radicals and hydrogen peroxide. As a result, during the reaction, superoxide anion radicals (O2∗−) and hydrogen peroxide (H2O2) are formed. Furthermore, superoxide which is formed spontaneously or under the influence of enzymes, is converted into hydrogen peroxide and oxygen (8). The final product of purine catabolism in this reaction is uric acid which is secreted by the kidneys. Excessive XO activity will cause high levels of uric acid in the blood plasma (hyperuricemia) and trigger the development of diseases such as gout and kidney disorders. From Figure 2, it can be seen that the extract that is best at inhibiting this process is leaf extract, this is also in line with the high levels of flavonoids in this extract.
In Vivo Antihyperuricemia Activity
The percentage reduction in uric acid levels was carried out to determine the ability of the positive group and the test preparation (EESRL) in reducing uric acid levels in the blood of mice. The ability to reduce uric acid levels of each test preparation can be seen in Table 4.
| Test Preparations | Percentage Reduction in Mice Uric Acid Levels (%) |
|---|---|
| Allopurinol | 66.28 |
| Extract dose 50 mg/kg BW | 42.69 |
| Extract dose 100 mg/kg BW | 46.62 |
| Extract dose 200 mg/kg BW | 50.92 |
| Extract dose 400 mg/kg BW | 70.52 |
Based on data on the percentage reduction in uric acid levels from the test preparation, Allopurinol has the highest ability to reduce uric acid levels, followed by the EESRL group at doses of 400 mg/kg BW, 200 mg/kg BW, 100 mg/kg BW, and 400 mg/kg BW. The 400 mg/kg BW dose group when compared with the positive group (Allopurinol) showed no significant difference. This shows that EESRL at a dose of 400 mg/kg BW has the equivalent ability to reduce blood uric acid levels in mice when compared to the positive group.
Urikase works on uric acid to produce allantoin, carbon dioxide and hydrogen peroxide. Hydrogen peroxide mixes with the peroxidase enzyme, then reacts with chromogen substances (amino-antipyrine and dichlorohydroxybenzene suffonate) to form the compound quinonimine, which is a pink complex compound. The absorbance measured at a wavelength of 520 nm is proportional to the amount of uric acid in the sample. These results are also in line with the antihyperuricemia test in mice carried out in vivo in previous research. EESRL can reduce uric acid levels in the blood of mice and is practically non-toxic (18).
Conclusion
SR ethanol extract can inhibit the XO enzyme and has potential as an antihyperuricemic agent. The total flavonoid content and IC50 values tested using the in vitro method provided the best inhibition data in the EESRL samples, with values of 21.29 ± 0.08 mg QE/g and 101.84 ± 0.63 ppm, respectively. In in vivo testing, EESRL showed an LD50 value of 400 mg/kg BW and demonstrated an ability to reduce blood uric acid levels in mice comparable to that of the positive control group.
Declarations
Acknowledgment
First and foremost, we would like to sincerely thank the Doctoral Programme in Pharmaceutical Sciences, Faculty of Pharmacy, Pancasila University for their support and direction during this project. Second, we would like to express our deepest gratitude to the National University (UNAS) for providing a research scholarship to the author and being recognized as an award recipient for their partnership with the Center for Plants and Chronic Disease (CBCD) of Rutgers University.
Conflict of Interest
The authors declare no conflicting interest.
Data Availability
The unpublished data is available upon request to the corresponding author.
Ethics Statement
Ethical approval was granted by the Tropical Biopharmaceutical Study Center, Institute for Research and Community Service (LPPM), IPB University (No. 026–2022 KEH TROP BRC).
Funding Information
Research grant from the Center for Botany and Chronic Diseases (CBCD) of Rutgers University in collaboration with National University (UNAS).
References
- Gliozzi M, Malara N, Muscoli S, Mollace V. The treatment of hyperuricemia. Int J Cardiol [Internet]. 2016;213:23–7. Available from: http://dx.doi.org/10.1016/j.ijcard.2015.08.087
- Simamora RH, Saragih E. Penyuluhan kesehatan terhadap masyarakat: Perawatan penderita asam urat dengan media audiovisual. JPPM (Jurnal Pendidik dan Pemberdaya Masyarakat). 2019;6(1):24–31.
- Hidayat AY, Yuniarti L, Ratnawati Y. Efek Antihiperurisemia Ekstrak Etanol Buah Stroberi (Fragaria ananassa) terhadap Mencit Model Hiperurisemia. 2017;1(22):4231213.
- Unique A. Legal Forms Against Corporations as Perpetrators of Environmental Crime in Indonesia: Study Based on the Environmental Protection and Management Law. 2016;8(0):1–23.
- Rizki KP, Muslichah S, Ningsih IY. Pengaruh Pemberian Kombinasi Ekstrak Etanol Daun Sidaguri (Sida rhombifolia L.) dan Rimpang Jahe Merah (Zingiber officinale Rosc.) pada Mencit Jantan Hiperurisemia. Pustaka Kesehat. 2018;6(2):205.
- Xue H, Xu M, Gong D, Zhang G. Mechanism of flavonoids inhibiting xanthine oxidase and alleviating hyperuricemia from structure–activity relationship and animal experiments: A review. Food Front. 2023;4(4):1643–65.
- Chaves OS, Teles YCF, De Oliveira Monteiro MM, Mendes Junior LDG, De Fátima Agra M, De Andrade Braga V, et al. Alkaloids and phenolic compounds from Sida rhombifolia L. (Malvaceae) and vasorelaxant activity of two indoquinoline alkaloids. Molecules. 2017;22(1).
- Karomah AH, Rafi M, Septaningsih DA, Ilmiawati A, Safitri UD, Aminah NS, et al. UHPLC-Q-Orbitrap HRMS-based Untargeted Metabolomics of Sida rhombifolia Leaves and Stem Extracts. HAYATI J Biosci. 2023;30(4):770–8.
- Ika Nur Masruroh. Uji Aktivitas Antihiperurisemia Ekstrak Metanol Biji Juwet (Syzygium cumini (L.) Skeels) Pada Mencit Jantan Galur Balb-C Hiperurisemia. Skripsi, Universitas Jember. 2016. 139–141 p.
- Capinera john L. Efek penghambatan enzim xantin oxidase oleh ekstrak etanol biji pepaya (Carica papaya linn.). Block Caving – A Viable Altern [Internet]. 2021;21(1):1–9. Available from: https://doi.org/10.1016/j.solener.2019.02.027
- Iswantini D, Darusman L. Indonesian sidaguri (Sida rhombifolia L.) as antigout and inhibition kinetics. Vol. 9, Journal of Biological Sciences. 2009. p. 504–8.
- Iswantini D, Yulian M, Mulijani S, Trivadila. Inhibition kinetics of Sida rhombifolia L. extract toward xanthine oxidase by electrochemical method. Indones J Chem. 2014;14(1):71–7.
- Yunita E, Khodijah Z. Pengaruh Konsentrasi Pelarut Etanol saat Maserasi terhadap Kadar Kuersetin Ekstrak Daun Asam Jawa (Tamarindus indica L.) secara Spektrofotometri UV-Vis. Pharm J Farm Indones (Pharmaceutical J Indones. 2020;17(2):273.
- Aulena DN, Kumala S, Abdillah S, Rahmat D, Zaidan S. Toxicity of Sida rhombifolia L . 96 % ethanol extract based on LD 50 and macropathological examination of mice ’ s organs. 2024;22(1):21–7.
- Farida S, Pratami DK, Sahlan M, Mun’im A, Djamil R, Winarti W, et al. In vitro study on antidiabetic and antihypertensive activities of ethanolic extract of propolis of Indonesian stingless bee Tetragonula sapiens. J King Saud Univ - Sci [Internet]. 2023;35(6):102738. Available from: https://doi.org/10.1016/j.jksus.2023.102738
- Putra LM, Yani DF, Faturrizqi M, Rahayu P, Parawansya OI. Skrining Fitokimia Dan Uji Sun Protection Factor (SPF) Ekstrak Daun Sungkai (Peronema Canescens Jack) Secara In Vitro. Fuller J Chem [Internet]. 2023;8(2):32–7. Available from: https://indochembull.com/index.php/fulerene/article/view/490
- Aulena DN, Yani DF, Mariyamah M, Tondi ML, Dandi M, Wahyudin HK, et al. Determination of Flavonoid Content and Anti-Inflammatory Activity Extract and Fraction of Sungkai Leaf (Peronema canescens Jack). J Ilmu Kefarmasian Indones. 2023;21(2):223.
- Mohammad MK, Almasri IM, Tawaha K, Issa A, Al-Nadaf A, Hudaib M, et al. Antioxidant, antihyperuricemic and xanthine oxidase inhibitory activities of Hyoscyamus reticulatus. Pharm Biol. 2010;48(12):1376–83.
- Li Y, Kang X, Li Q, Shi C, Lian Y, Yuan E, et al. Anti-hyperuricemic peptides derived from bonito hydrolysates based on in vivo hyperuricemic model and in vitro xanthine oxidase inhibitory activity. Peptides [Internet]. 2018;107(May):45–53. Available from: https://doi.org/10.1016/j.peptides.2018.08.001
- Ferrari FC, Lemos Lima RDC, Schimith Ferraz Filha Z, Barros CH, De Paula Michel Araújo MC, Antunes Saúde-Guimarães D. Effects of Pimenta pseudocaryophyllus extracts on gout: Anti-inflammatory activity and anti-hyperuricemic effect through xantine oxidase and uricosuric action. J Ethnopharmacol [Internet]. 2016;180:37–42. Available from: http://dx.doi.org/10.1016/j.jep.2016.01.007
- Aulena DN, Fitriyani D. Studi In Silico Enam Senyawa dari Caesalpinia bonduc L. (Robx) untuk Prediksi Toksisitas dan Interaksi pada Reseptor 5JMY sebagai Inhibitor Enzim Elastase. Sainteks. 2022;19(2):199.
- Chinchilla. Identifikasi Dan Uji Fitokimia Ekstrak Alami Tanaman Antiurolithiasis. 2014;1(2):1–23.
- Widyasari EM, Sriyani ME, Daruwati I, Halimah I, Nuraeni W. Karakteristik Fisikokimia Senyawa Bertanda 99mtc-KUERSETIN. J Sains Dan Teknologi Nuklir Indonesia. 2019;20(1):9.